ETHUSD Trades Near $2,166: Strong Downtrend Signals Potential Break Below $2,118
ETHUSD is currently trading at $2,166.24, showing a strong bearish trend. Key support at $2,118 and resistance at $2,314. Analysis suggests potential downside.
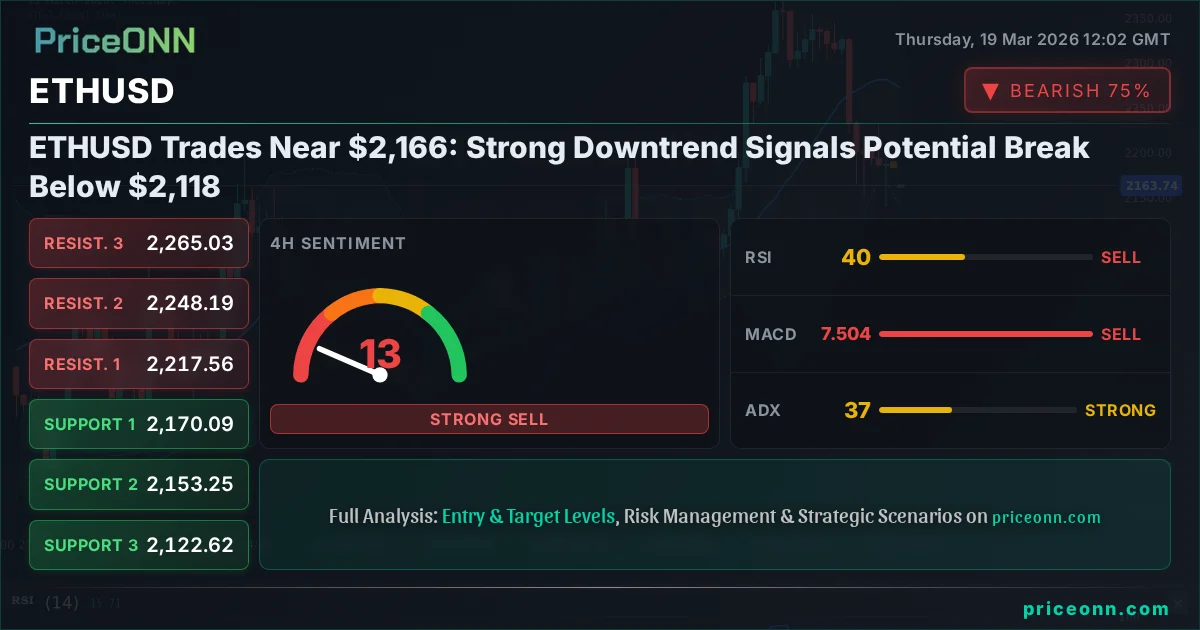
ETHUSD is currently navigating choppy waters, trading around the $2,166.24 mark as of the latest market data. The prevailing sentiment across multiple timeframes paints a decidedly bearish picture, with a dominant downtrend firmly in place. This analysis delves into the technical indicators and price action shaping ETHUSD's immediate future, highlighting critical support and resistance levels that traders must watch.
- ETHUSD RSI at 37 signals bearish momentum, indicating potential for further downside.
- Critical support for ETHUSD sits at $2,118, tested by the current downtrend.
- The MACD histogram shows bearish divergence on the 1D chart, suggesting weakening upside momentum.
- DXY strength at 99.83 correlates with pressure on crypto assets like ETHUSD.
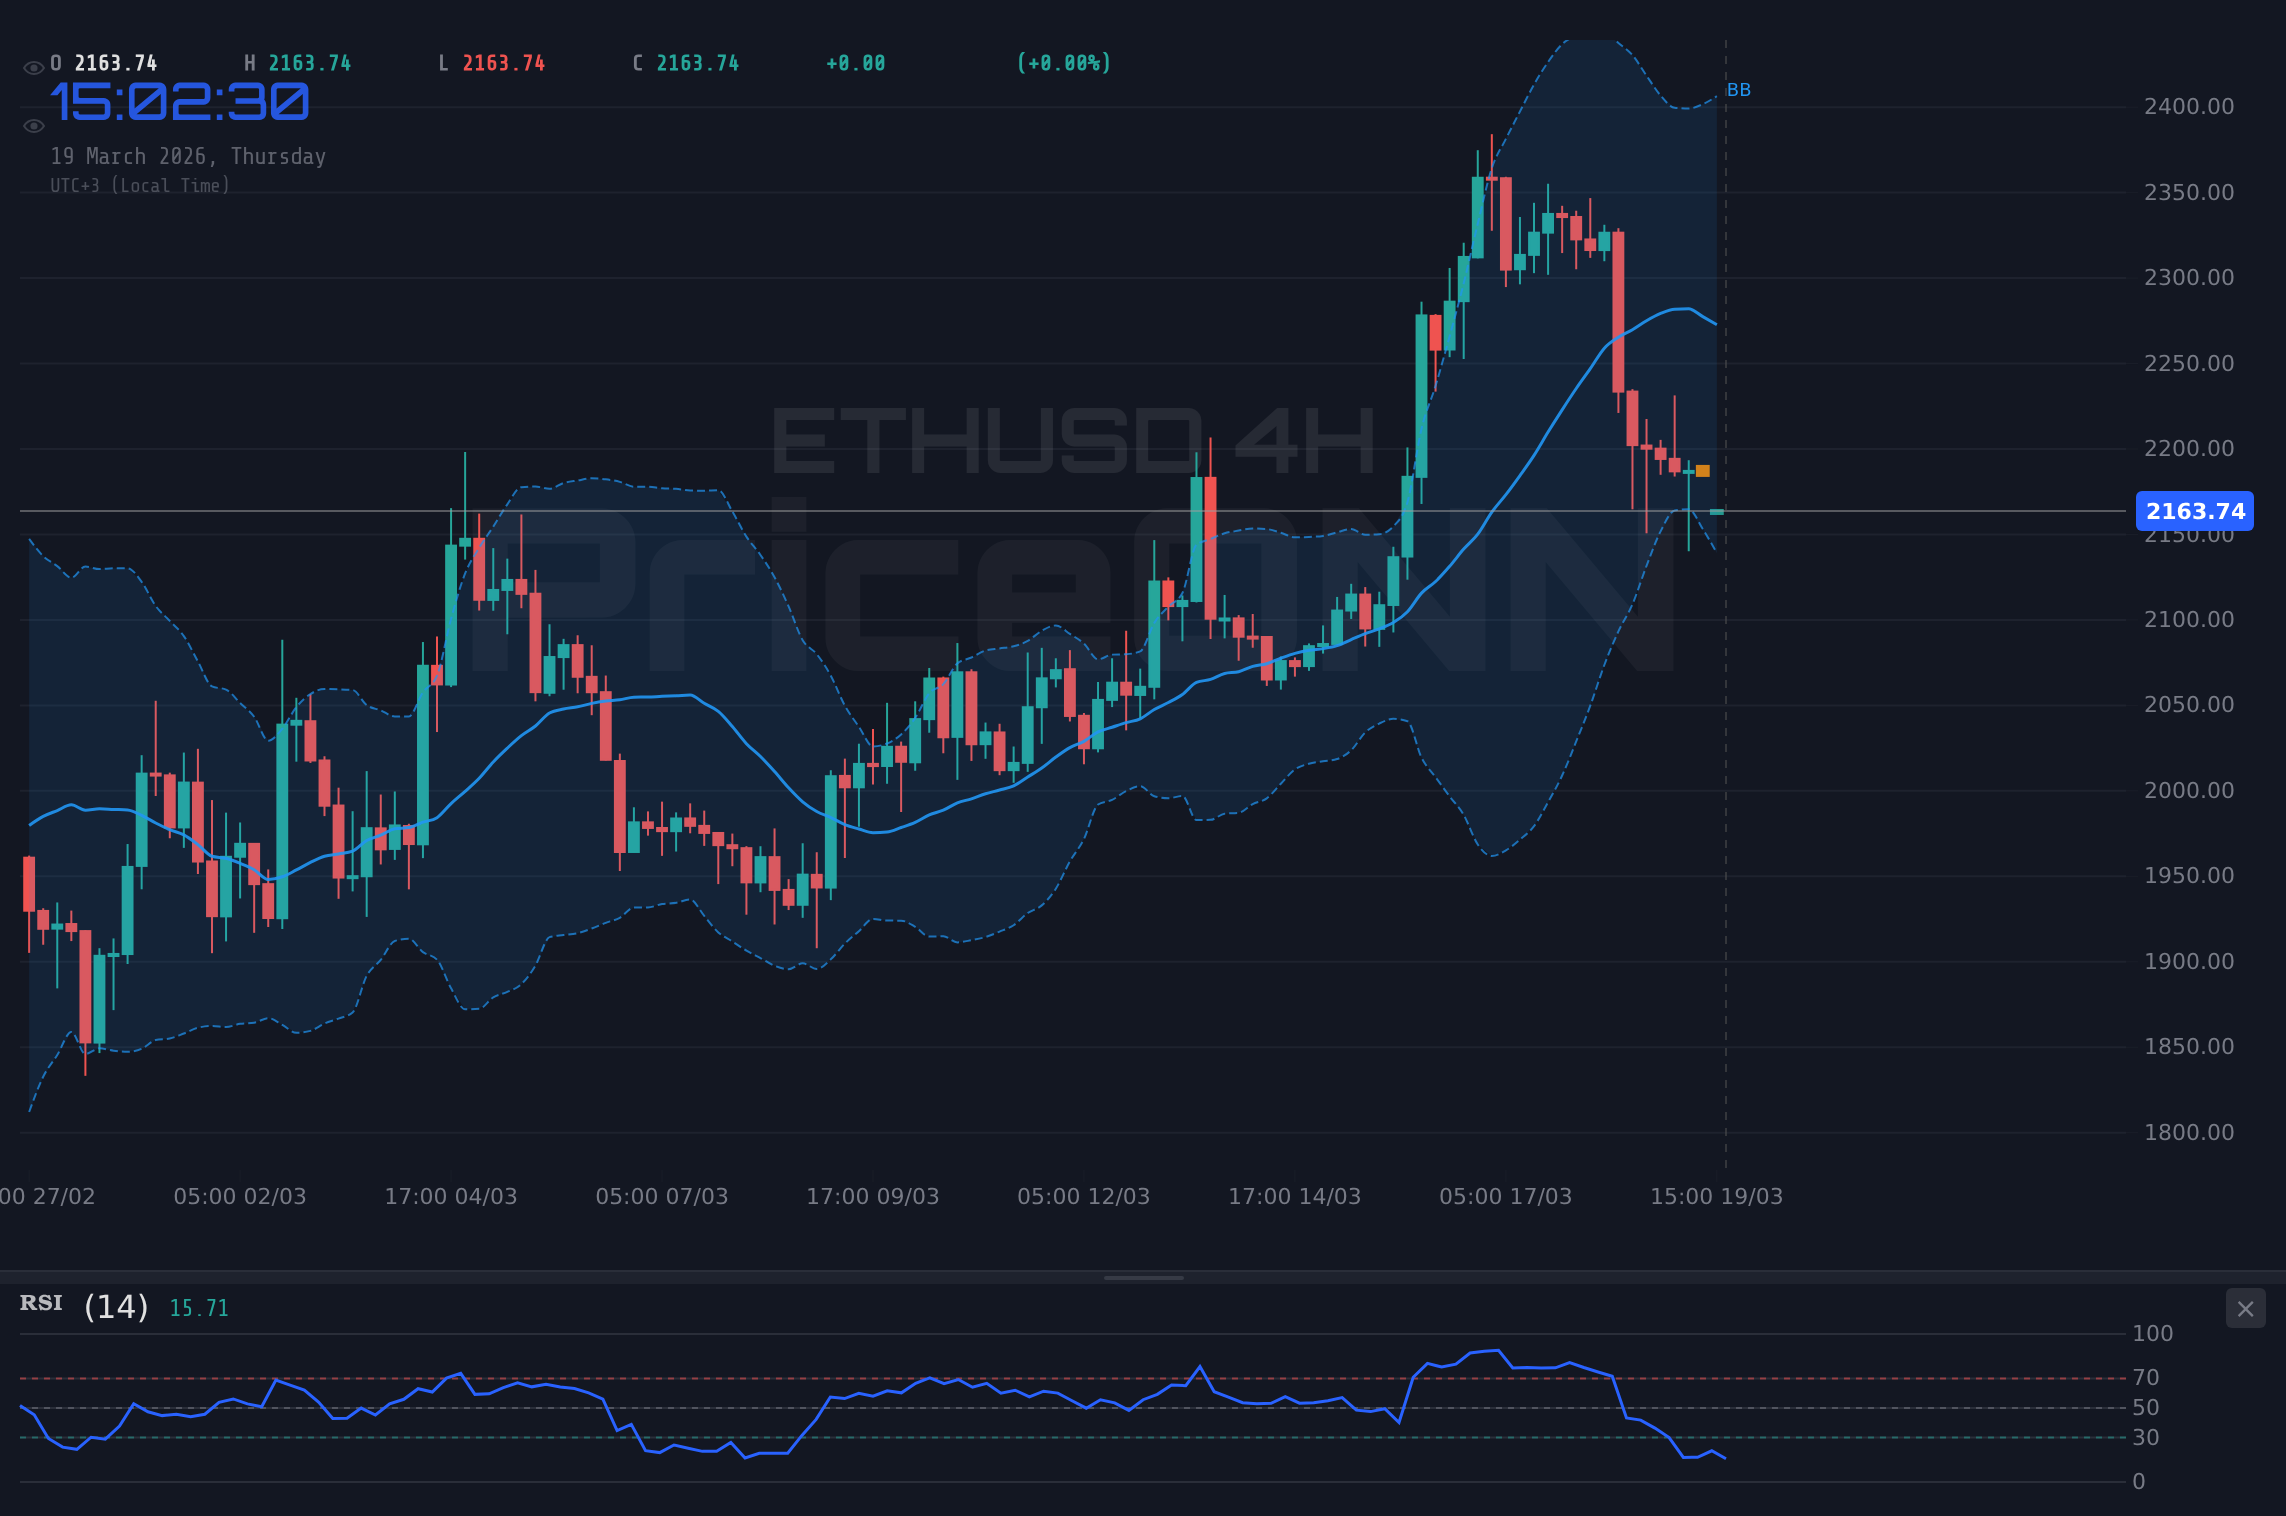
The technical landscape for ETHUSD is currently dominated by a strong downtrend, particularly evident on the 1-hour and 4-hour charts. The 1-hour timeframe shows a 92% trend strength in the bearish direction, with the ADX at 44.61 confirming a robust downward movement. Similarly, the 4-hour chart reinforces this bearish conviction with a 50% neutral trend strength but an ADX of 35.37, still indicating a significant trend. Even the daily chart, while showing a neutral trend strength at 50%, has a strong ADX of 25.25, suggesting that any sideways movement is occurring within a broader, albeit consolidating, trend context. This consistent bearish signal across timeframes is crucial for understanding the immediate price action.
Looking closer at the indicators, the Relative Strength Index (RSI) on the 1-hour chart stands at 29.27, firmly within oversold territory. While this traditionally suggests a potential for a bounce, the overwhelming trend strength indicates that oversold conditions could persist or deepen before any significant reversal. The MACD on the 1-hour is negative, with the MACD line below its signal line, further confirming bearish momentum. On the 4-hour chart, the RSI is at 33.89, also in oversold territory, and the MACD remains negative. The daily RSI, at 48.21, sits in neutral ground but leans towards the bearish side, reflecting a market that has sold off but is not yet in extreme oversold conditions on the longer timeframe. This divergence in RSI readings between shorter and longer timeframes warrants caution.
The Stochastic Oscillator provides further insight. On the 1-hour chart, K=33.27 and D=26.86 show a potential bullish crossover emerging from oversold levels, which might signal a short-term upward correction. However, on the 4-hour, K=9.98 and D=14.83, both are deeply oversold and %K is below %D, reinforcing the bearish bias. The daily Stochastic, K=46.2 and D=69.32, shows %K below %D, indicating a bearish signal, although it's not in extreme territory. This mixed picture from the Stochastic across timeframes underscores the current indecision, but the longer-term bearish signals are hard to ignore.
Bollinger Bands also tell a story of bearish pressure. On the 1-hour and 4-hour charts, ETHUSD is trading below the middle band, indicating a bearish trend. The 4-hour chart shows the price below the lower band, suggesting extreme selling pressure and potential for a reversion to the mean, but the strong ADX implies this could also be the start of a significant breakdown. The daily chart, however, shows the price below the middle band, indicating a bearish trend that needs to be monitored closely. The proximity to the lower band on the 4-hour chart, coupled with the strong ADX, presents a critical juncture: either a sharp oversold bounce or a continued, aggressive downtrend.
The price action itself reveals key levels. The current price hovers around $2,166.24. The immediate support level to watch is $2,118 (S1 on the daily chart), followed by $2,036.43 (S2) and $1,922.19 (S3). On the upside, resistance is first met at $2,217.56 (R1 on the 4-hour chart), with further resistance at $2,314.43 (R1 on the daily chart) and $2,428.67 (R2). The fact that the price is currently trading between these significant daily support and resistance levels highlights the current tension in the market. A decisive break below $2,118 would confirm the bearish outlook, while a sustained move above $2,217.56 could signal a potential short-term reversal.
Navigating the Bearish Tide: Key Levels and Indicators
The consistent bearish signals from indicators like the ADX, RSI, and MACD across multiple timeframes cannot be overstated. The ADX, reading 35.37 on the 4-hour and 25.25 on the daily, indicates strong trending conditions, favoring moves in the direction of the trend. Currently, that direction is down. The RSI, hovering in the oversold to neutral-bearish zones, suggests that while short-term bounces are possible, the overall momentum is capped. The negative MACD histogram further solidifies the bearish sentiment, showing that sellers are in control of the price action. This confluence of bearish indicators suggests that any upward movements might be temporary.
The correlation with the US Dollar Index (DXY) is also worth noting. With the DXY currently at 99.83 and showing a strong upward trend on the daily chart (ADX 35.89), it exerts downward pressure on risk assets like ETHUSD. As the dollar strengthens, it typically becomes more expensive for holders of other currencies to buy dollar-denominated assets, leading to reduced demand. This macro backdrop adds another layer of complexity, suggesting that a sustained dollar rally could further dampen sentiment for cryptocurrencies.
Given the technical setup, the immediate price action hinges on the $2,118 support level. A break below this critical point would likely trigger further selling, potentially pushing ETHUSD towards the $2,036.43 and $1,922.19 levels. Conversely, if buyers can defend $2,118 and push the price back above the $2,166.24 current level, the next hurdle would be the $2,217.56 resistance. A sustained move above this level, confirmed by increasing volume and bullish indicator turns, could signal a short-covering rally.
The current market sentiment is clearly leaning bearish, supported by strong trend indicators and macroeconomic factors. While oversold conditions on shorter timeframes might tempt some traders into looking for a bounce, the dominant trend and the confluence of bearish signals suggest caution. The $2,118 support level is pivotal; its failure would likely accelerate the downtrend, while its successful defense could lead to a period of consolidation or a shallow recovery.
The recent volatility in other markets, such as the surge in Brent crude past $112 due to Middle East tensions and the dip in gold to $4,800 amid Fed rate expectations, highlights the broader market's sensitivity to geopolitical events and monetary policy. While these are not directly tied to ETHUSD's price action, they contribute to the overall risk sentiment that influences crypto markets. A general 'risk-off' environment typically sees investors move away from speculative assets like cryptocurrencies.
The lack of strong bullish confirmation across longer timeframes, despite oversold readings on hourly charts, indicates that the bears are firmly in control. Traders should be looking for clear signs of trend exhaustion or a confirmed reversal pattern before considering long positions. For now, the path of least resistance appears to be to the downside, with $2,118 serving as the immediate make-or-break level.
Bearish Scenario: Trend Continuation
65% ProbabilityNeutral Scenario: Consolidation Around $2,166
25% ProbabilityBullish Scenario: Short-Covering Rally
10% ProbabilityTechnical Outlook Summary
| Indicator | Value | Signal | Interpretation |
|---|---|---|---|
| RSI (14) | 37.00 | Bearish | Bearish momentum, but approaching oversold on shorter timeframes. |
| MACD Histogram | -15.20 | Bearish | Negative momentum confirms selling pressure. |
| Stochastic (%K/%D) | 46.20 / 69.32 | Bearish | Daily %K < %D indicates a bearish signal. |
| ADX | 25.25 | Strong Trend | Indicates a strong trend is in play (currently down). |
| Bollinger Bands | Middle Band | Bearish | Price is below the middle band, indicating bearish pressure. |
Frequently Asked Questions: ETHUSD Analysis
What happens if ETHUSD breaks below the $2,118 support level?
A break below the critical $2,118 support level on ETHUSD would likely confirm the strong bearish trend identified by indicators like ADX and RSI. This could accelerate selling pressure, targeting $2,036.43 (S2) and potentially $1,922.19 (S3) as further downside objectives.
Should I consider buying ETHUSD at current levels around $2,166 given the oversold RSI on the 1H chart?
While the 1-hour RSI is in oversold territory, the dominant bearish trend indicated by daily and 4-hour charts suggests caution. A low probability (10%) bullish scenario exists if ETHUSD breaks $2,217.56, but without that confirmation, buying now carries significant risk of further losses.
Is the MACD histogram at -15.20 a strong sell signal for ETHUSD right now?
Yes, the negative MACD histogram of -15.20 on the 1-hour chart confirms bearish momentum. Combined with the ADX at 25.25 on the daily, it strongly suggests that sellers are in control and further downside is probable, especially if key support levels fail.
How might the current DXY strength at 99.83 affect ETHUSD's price action this week?
The strengthening US Dollar Index (DXY), currently at 99.83, typically puts downward pressure on risk assets like ETHUSD. This macro factor reinforces the bearish technical outlook, making it harder for ETHUSD to find sustainable upside momentum until the DXY shows signs of reversal.
Volatility creates opportunity - those prepared will be rewarded.
While the current ETHUSD trend is bearish, disciplined risk management and waiting for clear setups are key to navigating these choppy markets. The market always provides another chance.
Track markets in real-time
AI-powered analysis, technical indicators and real-time price data.
Join Our Telegram Channel
Breaking market news, AI analysis and trading signals instantly.
Join Channel