XAGUSD Tests $75.16 Support Amidst Soaring Oil and Hot PPI Data
Silver struggles at $76.19 as oil and US PPI surge, fueling Fed hawkishness fears. Will $75.16 support hold amid this volatile backdrop?
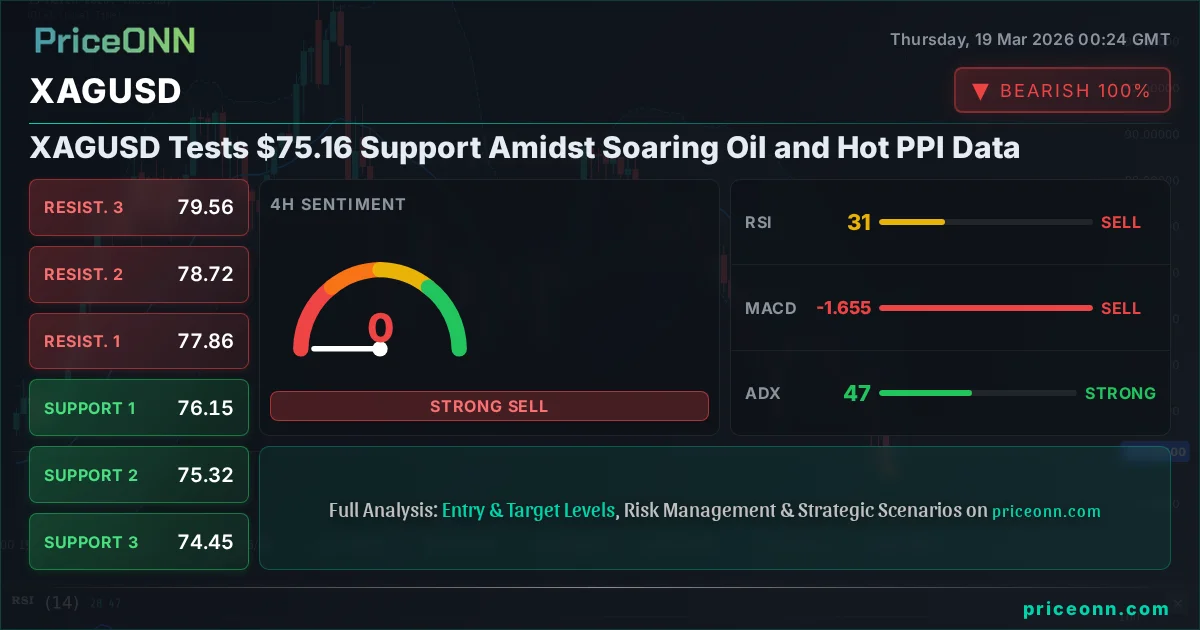
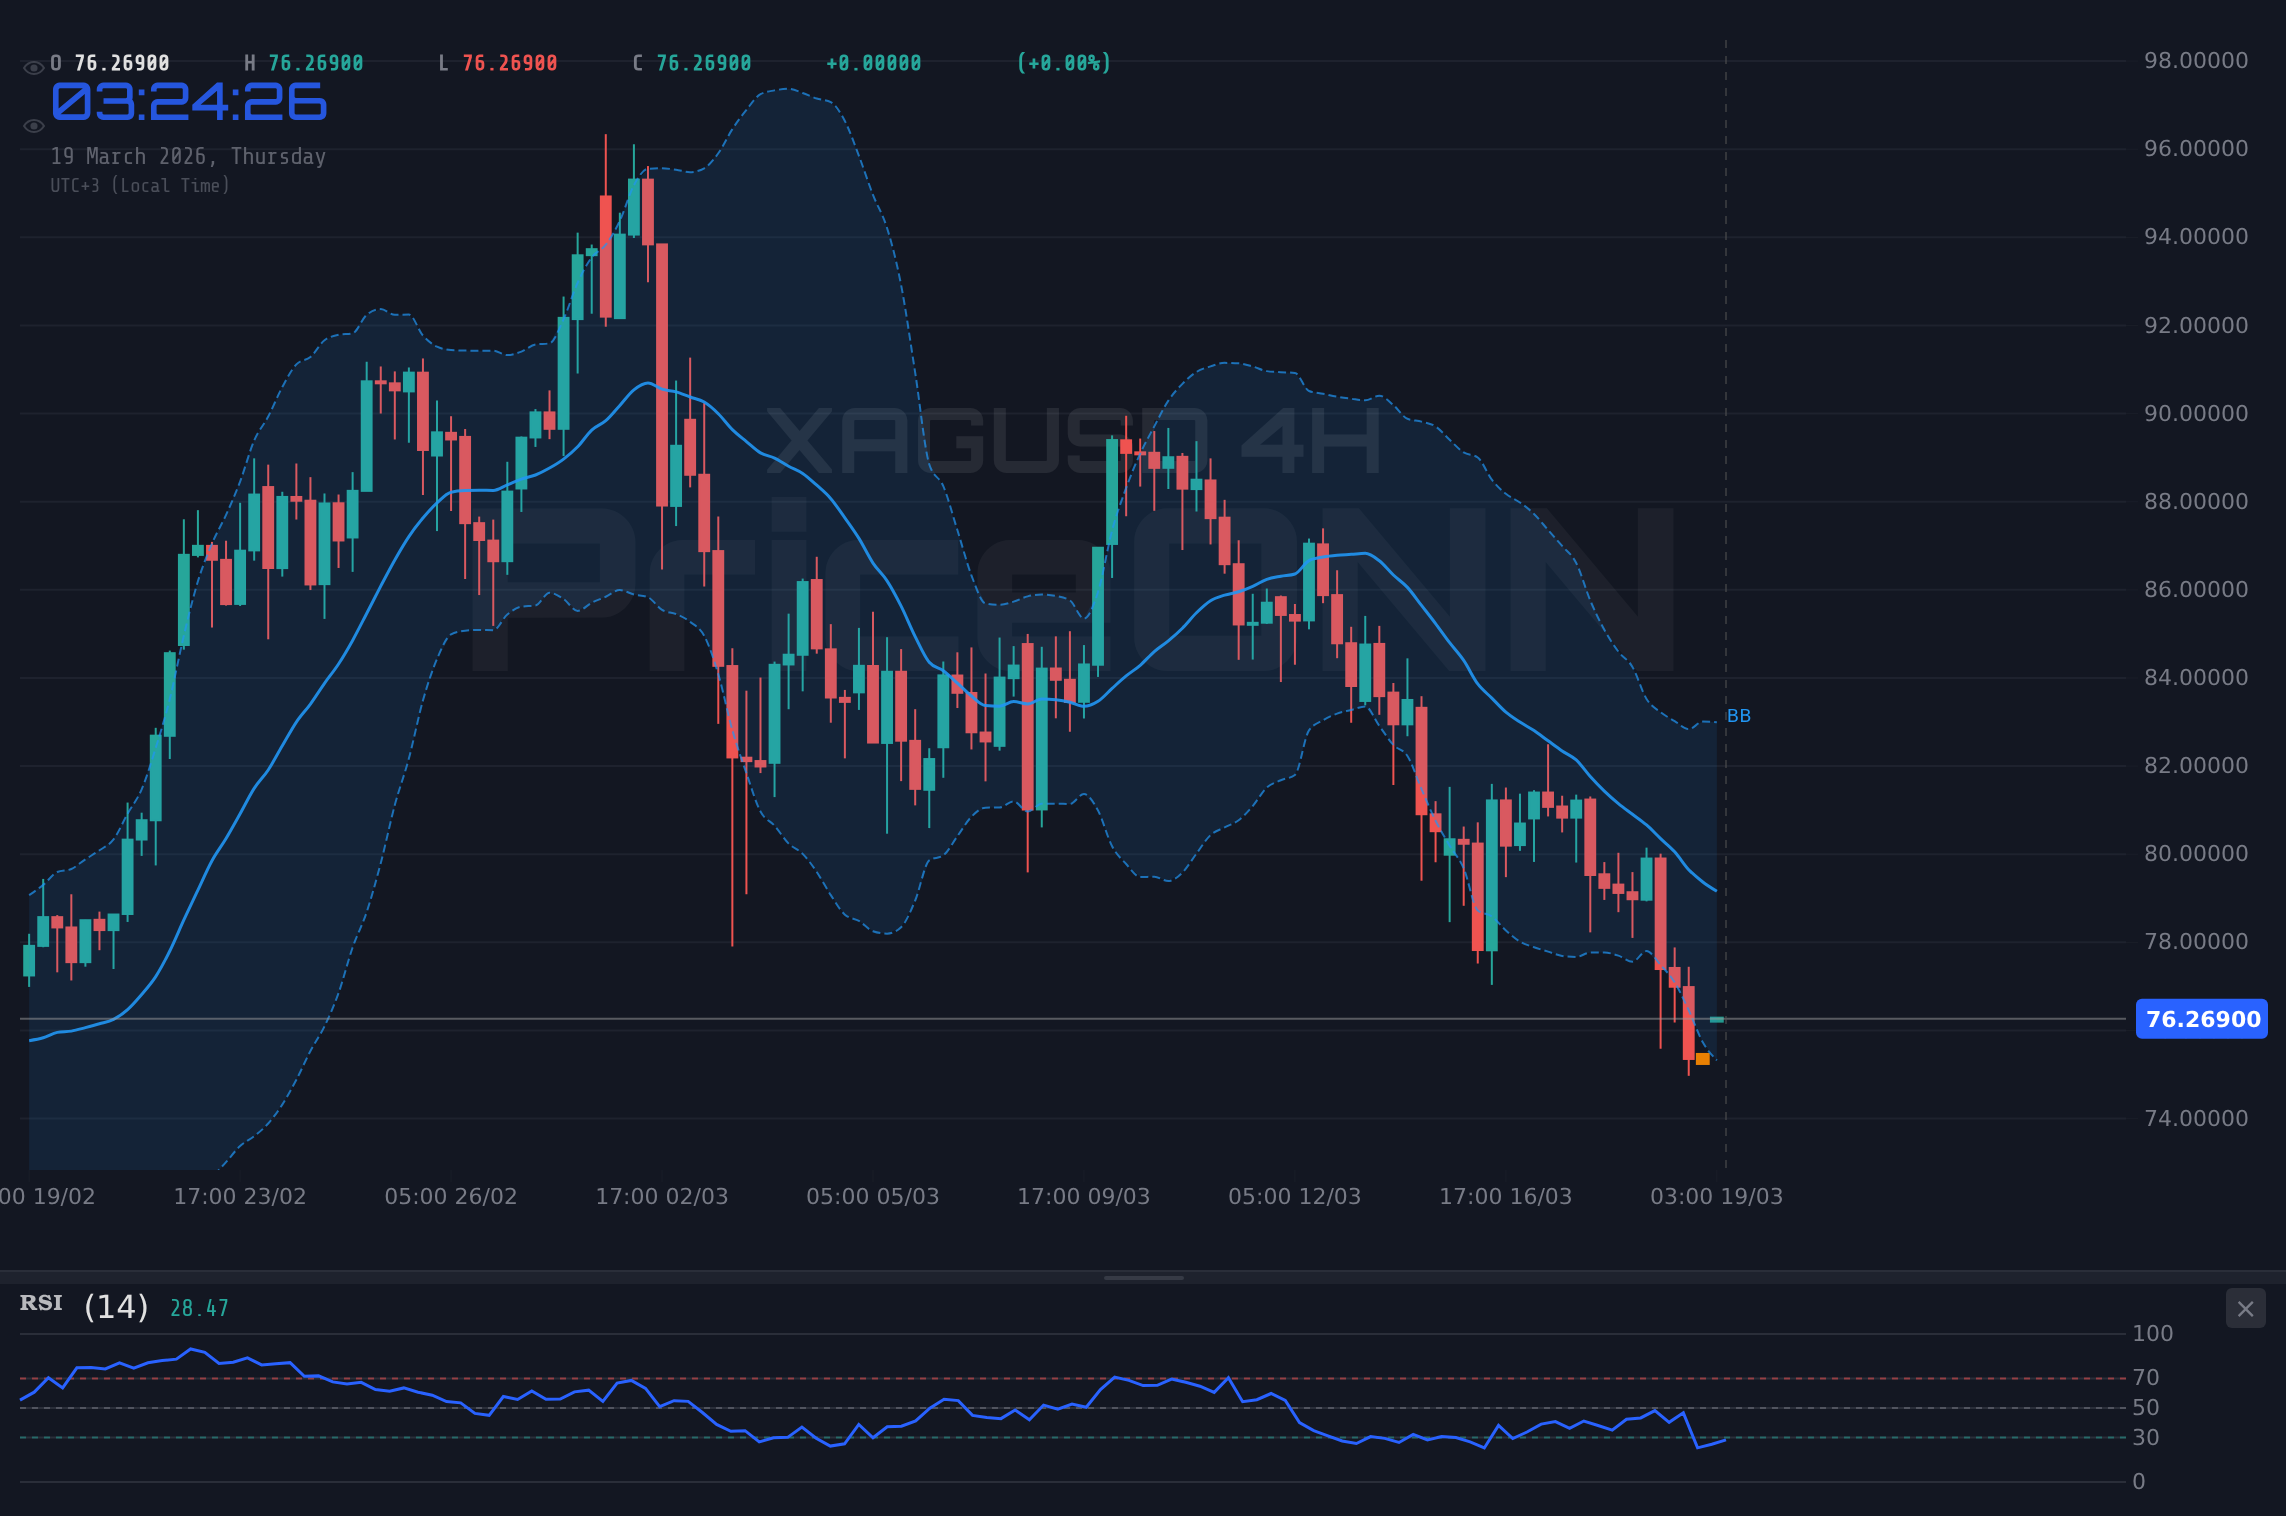
Silver, or XAGUSD, is currently navigating choppy waters, trading at $76.19 as of the latest market data. The precious metal has seen a notable 3.84% daily decline, falling $3.04 from its previous close. This downward pressure intensified as crude oil prices surged past $108 and US Producer Price Index (PPI) data dramatically exceeded expectations, painting a complex picture for inflation and potential central bank responses. The market sentiment leans bearish, with the 1-hour, 4-hour, and daily charts showing strong selling signals, but the critical question remains: can the immediate support level at $75.16 offer a reprieve, or is further downside imminent?
- Silver (XAGUSD) is trading at $76.19, down 3.84% on the day, with key support at $75.16.
- US PPI data surged significantly, fueling inflation concerns and potentially strengthening the US Dollar Index (DXY) which is nearing 100.00.
- Crude oil prices (Brent above $108) rallied sharply amid geopolitical tensions, adding to inflationary pressures.
- Technical indicators show a strong bearish trend on 4H and 1H, but RSI on 4H is approaching oversold territory at 30.99.
The immediate environment for silver is being shaped by powerful, albeit conflicting, macro forces. On one hand, the scorching US PPI data released yesterday, printing at levels significantly above forecasts, has reignited inflation fears across financial markets. This hotter-than-expected inflation print typically strengthens the US Dollar, as it increases the probability of a more hawkish stance from the Federal Reserve. Indeed, the US Dollar Index (DXY) is showing strength, hovering near the 99.97 mark on the 1-hour chart, with an RSI of 76.77 signaling overbought conditions that could precede a brief pullback, but the overall trend remains upwards. A stronger dollar generally acts as a headwind for dollar-denominated commodities like silver, making them more expensive for holders of other currencies.
Adding to the complexity, crude oil prices have experienced a dramatic surge. Brent crude climbed past $108 per barrel, with WTI not far behind at $99.10, driven by escalating geopolitical tensions in the Middle East, including reports of attacks impacting Iran's energy infrastructure. This surge in oil prices, a key component of inflation, further complicates the economic outlook. While higher oil prices can sometimes be seen as a hedge against inflation and a driver for precious metals like gold, the immediate reaction in silver has been bearish. This suggests that the dominant market narrative is currently focused on the potential for aggressive central bank tightening in response to inflation, overshadowing the safe-haven appeal of precious metals.
Navigating the Technical Landscape: A Bearish Tilt
From a technical standpoint, silver's price action on the shorter timeframes paints a decidedly bearish picture. On the 1-hour chart, the trend is firmly downward with a strength of 94%, supported by a MACD histogram showing negative momentum and the price trading below the middle Bollinger Band. The ADX at 27.78 indicates a strong downtrend is in play. While the Stochastic Oscillator is showing an oversold condition with %K (14.04) above %D (11.28), suggesting a potential for a short-term bounce, the overall signal leans heavily towards 'SELL' across most indicators.
The 4-hour timeframe reinforces this bearish sentiment. The trend is unequivocally downwards, with a strength of 100%. The ADX reading of 46.68 here is particularly significant, denoting a very strong downtrend. The RSI(14) at 30.99 is hovering near oversold territory, which could signal a pause or a minor retracement, but the Stochastic K line (22.22) is still below the D line (31.28), maintaining a bearish signal. The price is trading below the lower Bollinger Band, a sign of extreme selling pressure. The general signal across indicators on this timeframe is a firm 'SELL'.
However, the daily chart presents a slightly more nuanced view, though still predominantly bearish. The trend is classified as 'Düşüş' (Downtrend) with a strength of 88%. The ADX at 16.6 suggests a weakening trend, implying that the current strong downtrend might be losing momentum on a longer-term horizon, potentially leading to a period of consolidation or a less aggressive decline. The RSI(14) at 40.87 is in the neutral zone, but still trending downwards. The MACD remains negative, and the Stochastic K line (17.86) is below the D line (31.72), continuing to signal a sell. Despite the daily chart showing signs of a potentially less forceful trend, the overwhelming signals from the 1-hour and 4-hour charts indicate that immediate downside risk remains elevated.
Key Levels and the $75.16 Crucible
The immediate focus for traders will be on the support levels provided in the data. The first line of defense is at $75.16. A break below this level on significant volume would likely trigger further selling pressure, potentially targeting the next support at $74.67, and then $74.37. These levels are crucial; a decisive move below $75.16 would confirm the continuation of the bearish trend observed on the shorter timeframes and could signal a deeper correction.
On the upside, resistance levels need to be cleared for any bullish sentiment to take hold. The nearest resistance is at $75.96, followed by $76.26, and then $76.75. For the bears to lose control, silver would need to not only break these resistance levels but also establish a firm footing above them, ideally closing a daily candle above the $76.75 mark. The current price of $76.19 sits precariously between these immediate support and resistance zones, highlighting the intraday volatility and the importance of the $75.16 level as a critical pivot.
Correlations and Macro Drivers: DXY and Oil's Influence
The interplay between silver, the US Dollar Index (DXY), and oil prices is a critical factor to monitor. As noted, the DXY is showing renewed strength, currently near 99.97. If it continues its ascent towards the 100.00 psychological level, as suggested by the hot PPI data, this typically exerts downward pressure on silver. The fact that silver is falling despite a surge in oil prices – usually a bullish sign for commodities due to inflation hedging properties – underscores the dominance of the Fed-centric narrative and the 'higher for longer' interest rate expectations.
The geopolitical events fueling the oil rally, particularly the tensions surrounding Iran, also contribute to broader market uncertainty. While such events often boost safe-haven assets, the current market environment seems to prioritize inflation and interest rate concerns above all else. This means that even if geopolitical risks escalate, the immediate impact on silver might be muted or even negative if it reinforces expectations of aggressive monetary tightening. Traders are watching closely to see if the DXY can decisively break above 100.00; such a move would likely add further strain to XAGUSD.
Trade Scenarios and Probability Estimates
Bearish Scenario: Downside Acceleration
65% ProbabilityNeutral Scenario: Consolidation Around $75.16
25% ProbabilityBullish Scenario: Short-Covering Rally
10% ProbabilityThe current technical setup, particularly the strong bearish signals on shorter timeframes and the critical support level at $75.16, suggests that the path of least resistance for silver remains to the downside in the immediate term. The surge in oil prices and the unexpectedly high US PPI data create a challenging environment. While the RSI on the 4-hour chart is approaching oversold territory, indicating potential for a bounce, the prevailing trend strength (ADX 46.68 on 4H) suggests that any such bounce might be short-lived unless key resistance levels are decisively breached.
Traders should remain vigilant. A close below $75.16 could initiate a significant move lower, targeting $74.67 and potentially $74.37. Conversely, a sustained hold above $75.16, followed by a break and consolidation above $76.26, might signal a temporary reprieve or a short-covering rally. However, given the macro backdrop of rising inflation expectations and a strengthening dollar, any bullish move would need to be strong and sustained to overcome the current headwinds.
Frequently Asked Questions: XAGUSD Analysis
What happens if XAGUSD breaks below the $75.16 support level today?
If XAGUSD breaks decisively below the $75.16 support, expect further downside acceleration. The next key targets would be $74.67 and potentially $74.37, as the strong bearish trend indicated by the ADX (46.68 on 4H) would likely remain intact.
Should I consider buying XAGUSD at current levels of $76.19 given the RSI at 30.99 on the 4H chart?
Buying at $76.19 solely based on the RSI at 30.99 (oversold territory) carries significant risk. While it suggests potential for a bounce, the strong downtrend (ADX 46.68) and negative MACD momentum indicate caution. A higher probability setup would involve waiting for a confirmed hold above $75.16 or a break above immediate resistance at $75.96.
Is the current ADX reading of 46.68 on the 4H chart a strong sell signal for XAGUSD?
Yes, an ADX reading of 46.68 on the 4-hour chart indicates a very strong trend, and when combined with negative MACD momentum and price below the Bollinger bands, it strongly supports a bearish outlook for XAGUSD. This suggests that the current downward move has significant strength behind it.
How will the surging US PPI data and oil prices affect XAGUSD this week?
The surging US PPI data and oil prices are fueling inflation concerns, which could lead to a more hawkish Federal Reserve. This typically strengthens the USD (DXY near 99.97) and puts pressure on commodities like silver. While high oil can be inflationary, the immediate market reaction suggests rate hike fears are dominating, potentially keeping XAGUSD under pressure unless geopolitical risks significantly shift sentiment.
| Indicator | Value | Signal | Interpretation |
|---|---|---|---|
| RSI (14) | 30.99 | Neutral (Oversold Zone) | Approaching oversold on 4H, suggesting potential for bounce but trend remains bearish. |
| MACD Histogram | Negative | Bearish | Negative momentum persists across timeframes, indicating selling pressure. |
| Stochastic | K=22.22, D=31.28 | Bearish | %K below %D on 4H signals continued downside, though nearing oversold. |
| ADX | 46.68 | Strong Trend | Indicates a very strong downtrend on the 4H chart, confirming current momentum. |
| Bollinger Bands | Below Mid Band | Bearish | Price is trading below the middle band on 1H and 4H, indicating bearish pressure. |
As we look ahead, the confluence of macroeconomic data and geopolitical events creates a highly uncertain environment for silver. The Federal Reserve's upcoming policy decision will be paramount. If the Fed signals a more aggressive stance on inflation due to the hot PPI data, the US Dollar could strengthen further, adding to the downward pressure on XAGUSD. Conversely, any hint of caution from the Fed, or a significant de-escalation in geopolitical tensions, could provide a reprieve for precious metals. For now, the technical picture strongly favors the bears, with $75.16 serving as the immediate critical level to watch. Traders should prioritize risk management and await clearer signals before committing to significant positions.
Track markets in real-time
AI-powered analysis, technical indicators and real-time price data.
Join Our Telegram Channel
Breaking market news, AI analysis and trading signals instantly.
Join Channel