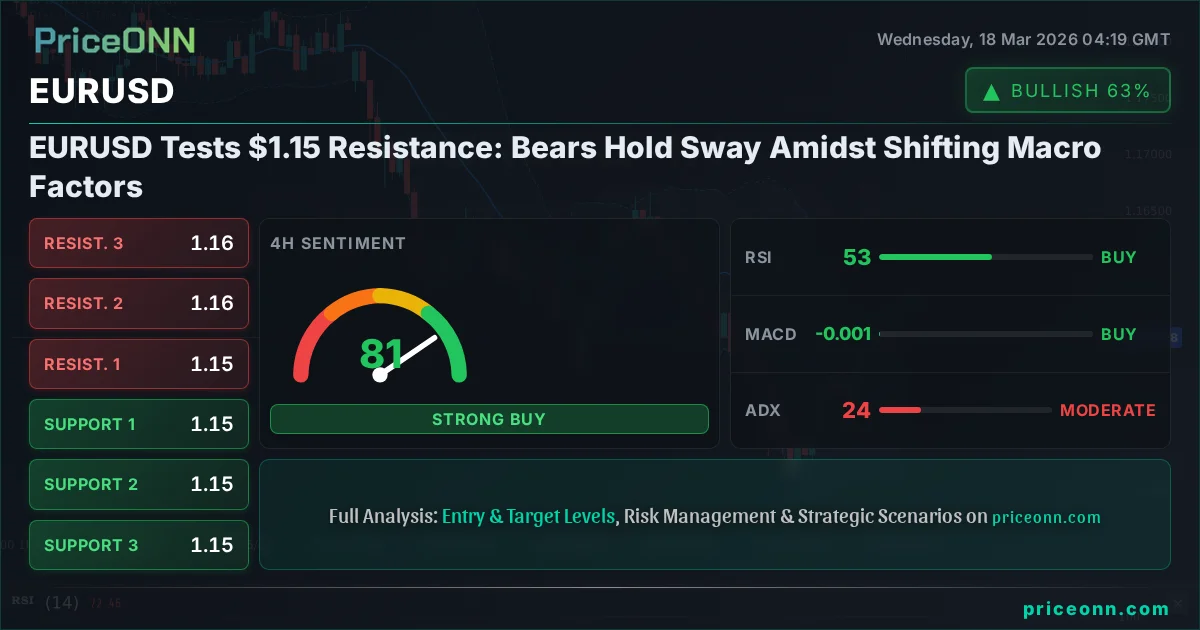
EURUSD Tests $1.15 Resistance: Bears Hold Sway Amidst Shifting Macro Factors
EURUSD faces renewed selling pressure around the $1.15 mark. Technical indicators suggest caution as macroeconomic factors align against the pair.
The currency market is a constant tug-of-war, and right now, the battleground for EURUSD is precisely at the $1.15 level. This pivotal price point is where bulls and bears are currently locked in a fierce struggle, with the latest data suggesting that the bears might be gaining the upper hand. After a period of choppy trading, the pair is testing key resistance, and the technical indicators are flashing warning signs that cannot be ignored. Understanding the interplay of macroeconomic forces and the subtle shifts in technical readings is crucial for navigating this complex landscape.
- EURUSD faces significant resistance around the $1.15355 level, with the 1-day RSI at 38.46 indicating downward pressure.
- Critical support for EURUSD lies at $1.15295 on the 1-hour chart and $1.14843 on the daily chart, with bears looking to break these levels.
- The MACD histogram on the 1-day chart shows negative momentum, suggesting that bearish sentiment is building.
- DXY strength, currently at 99.32, correlates with downward pressure on EURUSD, reinforcing the bearish outlook.
The Bull Case: A Fleeting Rally or Sustainable Rebound?
Glimmers of Strength on Shorter Timeframes
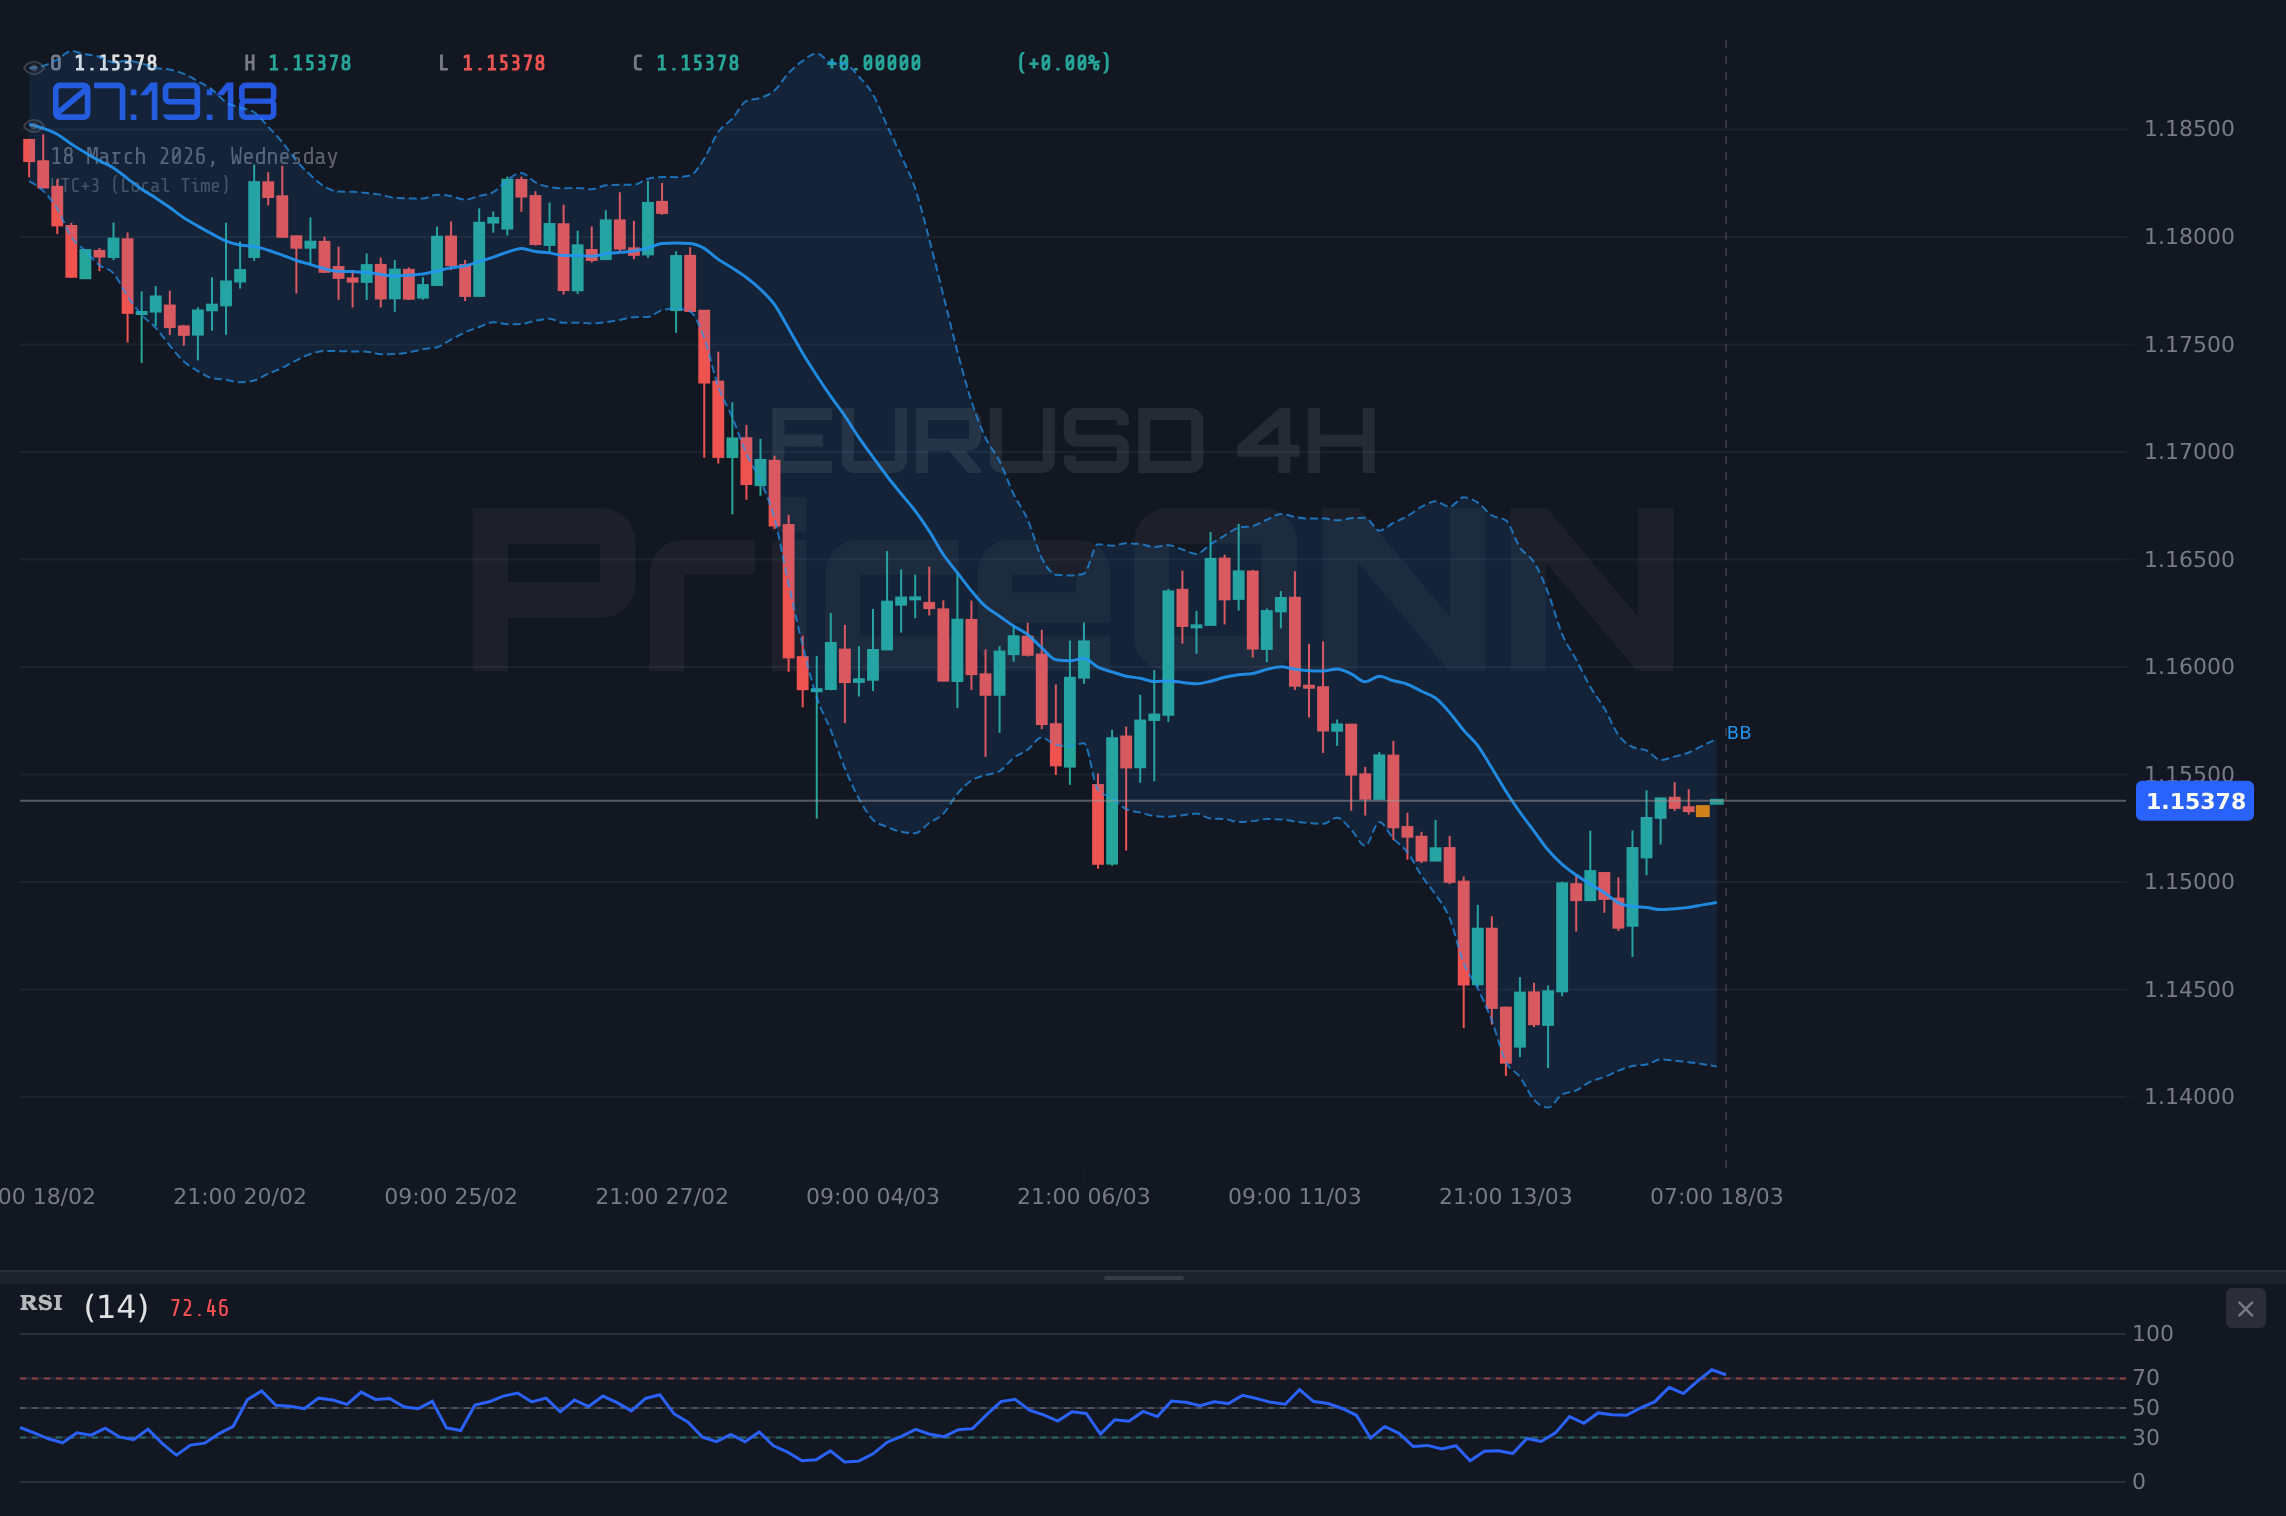
On the 1-hour chart, EURUSD presents a somewhat mixed picture, which is often the case when a currency pair approaches a significant resistance level. The price is hovering around $1.15383, showing a slight daily gain of 0.03%. The RSI(14) at 60.49 suggests some upward momentum, and the Bollinger Bands are showing the price pushing above the upper band, which can sometimes signal strength or an impending reversal. Furthermore, the Stochastic oscillator, with %K at 23.74 and %D at 51.59, is showing a crossover that, in isolation, might suggest a potential move higher. The ADX at 28.84 indicates a strong trend, and on this shorter timeframe, it's leaning towards bullish. This is the picture the bulls would love to see: a pair holding its ground and showing signs of life, potentially setting up for a move towards the $1.15355 resistance, and perhaps even higher towards $1.15394 and $1.15415.
However, this short-term optimism must be tempered with caution. The MACD on the 1-hour chart is showing negative momentum, with the MACD line below the signal line. This suggests that while the price might be nudging higher, the underlying momentum is actually weakening. This divergence is a classic warning sign that the current upward move might be running out of steam. The bulls need to see a decisive break above the $1.15415 resistance level, coupled with sustained buying volume and improved MACD readings, to truly regain control on this timeframe. Without that confirmation, this could simply be a temporary pause before the next leg down.
The 4-Hour Chart: A More Nuanced Perspective
Shifting to the 4-hour timeframe offers a slightly more balanced, yet still cautious, view. The EURUSD is trading at $1.15383, with support identified at $1.15295 and $1.15245. The RSI(14) is at 53.27, sitting comfortably in neutral territory and indicating a slight upward bias, which aligns with the short-term bullish sentiment. The MACD here is more encouraging for the bulls, showing positive momentum with the MACD line above its signal line. The Bollinger Bands are also showing the price trading above the middle band, suggesting an upward trend is in play. However, the Stochastic oscillator is flashing a significant warning: %K is at a very high 89.47, and %D is at 83.75. This indicates that the pair is in overbought territory, meaning the recent upward move might be overextended and due for a pullback or consolidation. The ADX at 23.54 suggests a moderately strong trend, but the combination of high Stochastic readings and the approaching resistance levels paints a picture of caution.
For the bulls to truly gain confidence, they need to see this upward momentum continue despite the overbought Stochastic conditions, pushing the price decisively above the 4-hour resistance at $1.1543, and ideally towards $1.15515 and $1.15565. This would require a significant shift in market sentiment or a catalyst that overrides the current overbought signals. Until then, the risk of a pullback from these elevated levels remains substantial. The bulls are essentially hoping for a breakout that defies the immediate technical warnings.
The Bear Case: Technicals Align for Downside Pressure
The Daily Chart: A Clear Downward Bias
When we zoom out to the daily timeframe, the narrative for EURUSD shifts dramatically towards the bears. The current price of $1.15383 is trading below the middle Bollinger Band, and the RSI(14) at 38.46 clearly indicates a downward trend, far from overbought conditions and pointing towards potential further downside. The MACD is also showing negative momentum, with the MACD line below its signal line, reinforcing the bearish sentiment. The Stochastic oscillator is displaying %K at 44.97 and %D at 24.13, with %K above %D, which might seem like a slight bullish divergence in isolation. However, given the overall bearish setup on the daily chart, this could simply be a temporary pause or a 'bear flag' formation before the next decline.
The ADX at 37.42 confirms a strong downward trend on the daily chart. This is a significant indicator for bears, suggesting that the prevailing market direction is indeed downwards. The immediate support levels to watch are $1.15295, $1.1516, and crucially, the daily support at $1.14843. A break below $1.14843 would likely accelerate the selling pressure. The bears are looking for confirmation of this bearish bias, aiming to push the price towards the next significant support at $1.14341 and potentially even to $1.1403. The resistance levels on the daily chart, such as $1.15656, $1.15967, and $1.16469, are now seen as key hurdles that the bulls must overcome to invalidate the bearish thesis.
Correlation Analysis: DXY and Equities Weighing on EURUSD
The broader market context is also leaning towards the bears. The US Dollar Index (DXY) is currently trading at 99.32, showing a daily increase of 0.14%. On the 1-day timeframe, the DXY exhibits a strong upward trend (ADX: 34.3), with RSI at 61.54 in neutral-to-bullish territory and MACD showing positive momentum. This strengthening dollar typically exerts downward pressure on pairs like EURUSD, as a stronger dollar makes the Euro relatively more expensive for holders of USD. The current correlation between DXY and EURUSD is inverse, meaning as the dollar index rises, EURUSD tends to fall. This relationship is a significant headwind for the bulls.
Moreover, the major US indices, while showing some strength on shorter timeframes, present a concerning picture on the daily charts. The S&P 500 is showing a strong downtrend (ADX: 41.09) with RSI at 45.08 and negative MACD momentum. Similarly, the Nasdaq 100, despite a recent push higher on the 1-hour chart, has a daily ADX of 32.77 indicating a strong downtrend. This risk-off sentiment in equities often correlates with a stronger dollar and weaker risk-sensitive currencies, further supporting the bearish case for EURUSD. The bears are leveraging this broader market weakness to pressure the single currency.
Macroeconomic Headwinds: What's Driving the Bearish Sentiment?
Central Bank Divergence and Inflation Concerns
The differing stances of the European Central Bank (ECB) and the Federal Reserve continue to play a crucial role in shaping the EURUSD's trajectory. While the Fed has maintained a relatively hawkish tone, signaling a potential for further tightening or at least a prolonged period of higher rates, the ECB has adopted a more cautious approach. Although recent data points might suggest inflation is cooling in the Eurozone, the underlying economic pressures and the ongoing geopolitical uncertainties in Europe keep the ECB's policy path less clear-cut compared to the Fed's more defined stance. This policy divergence often favors the US dollar.
The market is keenly watching for any hints of a dovish shift from the ECB, which would likely send EURUSD lower. Conversely, any indication that the Fed is leaning towards maintaining higher interest rates for longer would further bolster the dollar. The recent news about Germany capping fuel prices amid rising oil costs, while seemingly localized, hints at broader inflationary pressures that central banks are grappling with globally. The market's interpretation of these inflation dynamics and their implications for monetary policy is a key driver for EURUSD.
Geopolitical Tensions and Economic Uncertainty
The global geopolitical landscape remains a significant factor influencing currency markets. While there haven't been major new escalations in the last 48 hours directly impacting EURUSD, the underlying tensions in Eastern Europe and the Middle East continue to create a backdrop of uncertainty. Such geopolitical risks often lead to a flight to safety, benefiting currencies like the US dollar, which is traditionally seen as a safe-haven asset. This increased demand for the dollar, irrespective of specific news events, adds another layer of pressure on EURUSD.
Furthermore, the economic outlook for the Eurozone, particularly concerning energy security and growth prospects, remains a concern. While the AUD/USD pair saw gains following RBA signals, the Eurozone's direct exposure to energy price volatility and its proximity to geopolitical hotspots means that any negative developments can quickly translate into a weaker euro. The bears are betting that these fundamental factors will continue to weigh on the single currency, pushing EURUSD lower despite any short-term technical bounces.
Trade Setup: A Bearish Outlook with Defined Levels
The Bearish Scenario: Targeting Key Support Levels
Given the confluence of bearish signals across multiple timeframes, the most probable scenario points towards a further decline in EURUSD. The daily chart clearly shows a strong downtrend, supported by negative MACD momentum and a neutral-to-bearish RSI. The key trigger for this scenario would be a decisive close below the 1-hour support level of $1.15295. If this level breaks, we can anticipate a swift move towards the next support at $1.15245. The primary target for this bearish trade would be the more significant daily support at $1.14843. A break below this level could open the door for further downside, potentially targeting $1.14341.
The invalidation level for this bearish thesis would be a strong daily close back above the $1.15656 resistance. Until then, traders should remain focused on the downside. The ADX readings across the 1H (28.84) and 1D (37.42) charts suggest that the trend is strong enough to support a sustained move lower once key support levels are breached. The high probability of this scenario is further supported by the inverse correlation with the strengthening DXY (currently at 99.32) and the risk-off sentiment seen in global equities.
Probability Assessment and Risk Management
Considering the technical indicators and macroeconomic backdrop, the probability of a bearish move below $1.15295 is estimated at 65-70%. The daily chart's strong downward trend (ADX 37.42) and the negative MACD momentum provide a solid foundation for this outlook. The overbought conditions on the 4-hour Stochastic (K=89.47, D=53.27) also suggest that the recent upward push might be exhausted, increasing the likelihood of a reversal.
However, markets are never certain. The bulls could find support at $1.15295, potentially leading to a bounce. If EURUSD manages to close strongly above $1.15656, this bearish view would be invalidated. Therefore, strict risk management is paramount. A stop-loss should be placed above the $1.15656 resistance level to limit potential losses if the market moves against the bearish thesis. For those looking to enter a short position, waiting for a confirmed break below $1.15295 on the 1-hour chart would provide a more conservative entry point, aligning with the prevailing daily trend.
What Lies Ahead: Key Levels to Watch
Monitoring the $1.15355 Crucial Zone
The immediate price action around $1.15355 will be critical in determining the short-term direction of EURUSD. This level represents a confluence of resistance on the 1-hour chart ($1.15355, $1.15394, $1.15415) and is also close to the daily resistance at $1.15656. If EURUSD fails to break convincingly above $1.15355, the bears will likely regain control, aiming for the support levels mentioned earlier. Traders should watch for signs of rejection at this zone, such as lower-than-average volume on upward moves or bearish candlestick patterns.
Conversely, a strong and sustained push above $1.15355, ideally with increasing volume and positive MACD divergence, could signal a shift in momentum. In such a scenario, the bulls might target higher resistance levels, but this would be against the stronger daily trend. For now, the price action around $1.15355 is the focal point, and any failure to break through it will likely reinforce the bearish sentiment that is currently building across the longer timeframes.
Economic Calendar: Watching for Catalysts
While the technical picture provides a strong bearish leaning for EURUSD, upcoming economic data releases could inject volatility and potentially alter the short-term trajectory. Investors will be closely monitoring any significant economic indicators from both the US and the Eurozone. For instance, key US employment data or inflation figures could influence Fed policy expectations, thereby impacting the DXY and, consequently, EURUSD. Similarly, any major economic surprises from the Eurozone, such as stronger-than-expected PMI or GDP figures, could provide a temporary boost to the euro.
The market's reaction to these data points will be crucial. Often, even significantly positive or negative data can be shrugged off if it aligns with existing expectations or if market participants have already 'priced in' the outcome. The true catalysts for a sustained move would be data that significantly deviates from forecasts or provides unexpected insights into central bank policy direction. Until then, the technical setup appears to favor the downside, but a significant macroeconomic event could easily disrupt this narrative.
Frequently Asked Questions: EURUSD Analysis
What happens if EURUSD breaks below the $1.15295 support level?
A break below $1.15295 on the 1-hour chart would confirm bearish momentum, likely triggering a move towards the $1.15245 support. Bears would then target the significant daily support at $1.14843, with the potential for further downside if this level is breached.
Should I short EURUSD at current levels of $1.15383 given the daily downtrend?
Entering a short position at current levels carries risk due to potential short-term bounces. A more prudent approach would be to wait for confirmation, such as a confirmed break below $1.15295, before entering. The probability of a bearish move is estimated at 65-70% if key support breaks.
Is the RSI at 38.46 a sell signal for EURUSD on the daily chart?
An RSI of 38.46 on the daily chart indicates a downward bias, reinforcing the bearish trend. While not yet in oversold territory, it suggests that sellers are in control and further downside is probable, especially when viewed alongside other bearish indicators like the MACD.
How will DXY strength at 99.32 affect EURUSD this week?
The current DXY level of 99.32, coupled with its strong daily uptrend, typically exerts downward pressure on EURUSD due to their inverse correlation. This strengthens the bearish outlook for EURUSD, as a stronger dollar makes the euro more expensive.
Technical Outlook Summary
| Indicator | Value | Signal | Interpretation |
|---|---|---|---|
| RSI (14) | 38.46 | Bearish | Downward bias on daily chart. |
| MACD Histogram | -0.001 (approx) | Bearish | Negative momentum building. |
| Stochastic %K/%D | 44.97 / 24.13 | Bearish Signal | Daily shows potential for further downside. |
| ADX | 37.42 | Strong Trend | Confirms strong downward trend on daily. |
| Bollinger Bands | Middle Band | Below | Price below mid-band suggests bearish pressure. |
Key Levels
Support Levels
Resistance Levels
Track markets in real-time
AI-powered analysis, technical indicators and real-time price data.
Join Our Telegram Channel
Breaking market news, AI analysis and trading signals instantly.
Join Channel