Brent Crude Oil Tests $103.56 Resistance Amid Geopolitical Tensions
Brent Crude Oil hovers near $103.56 as geopolitical risks and supply concerns intensify. Analysis suggests a critical resistance test.
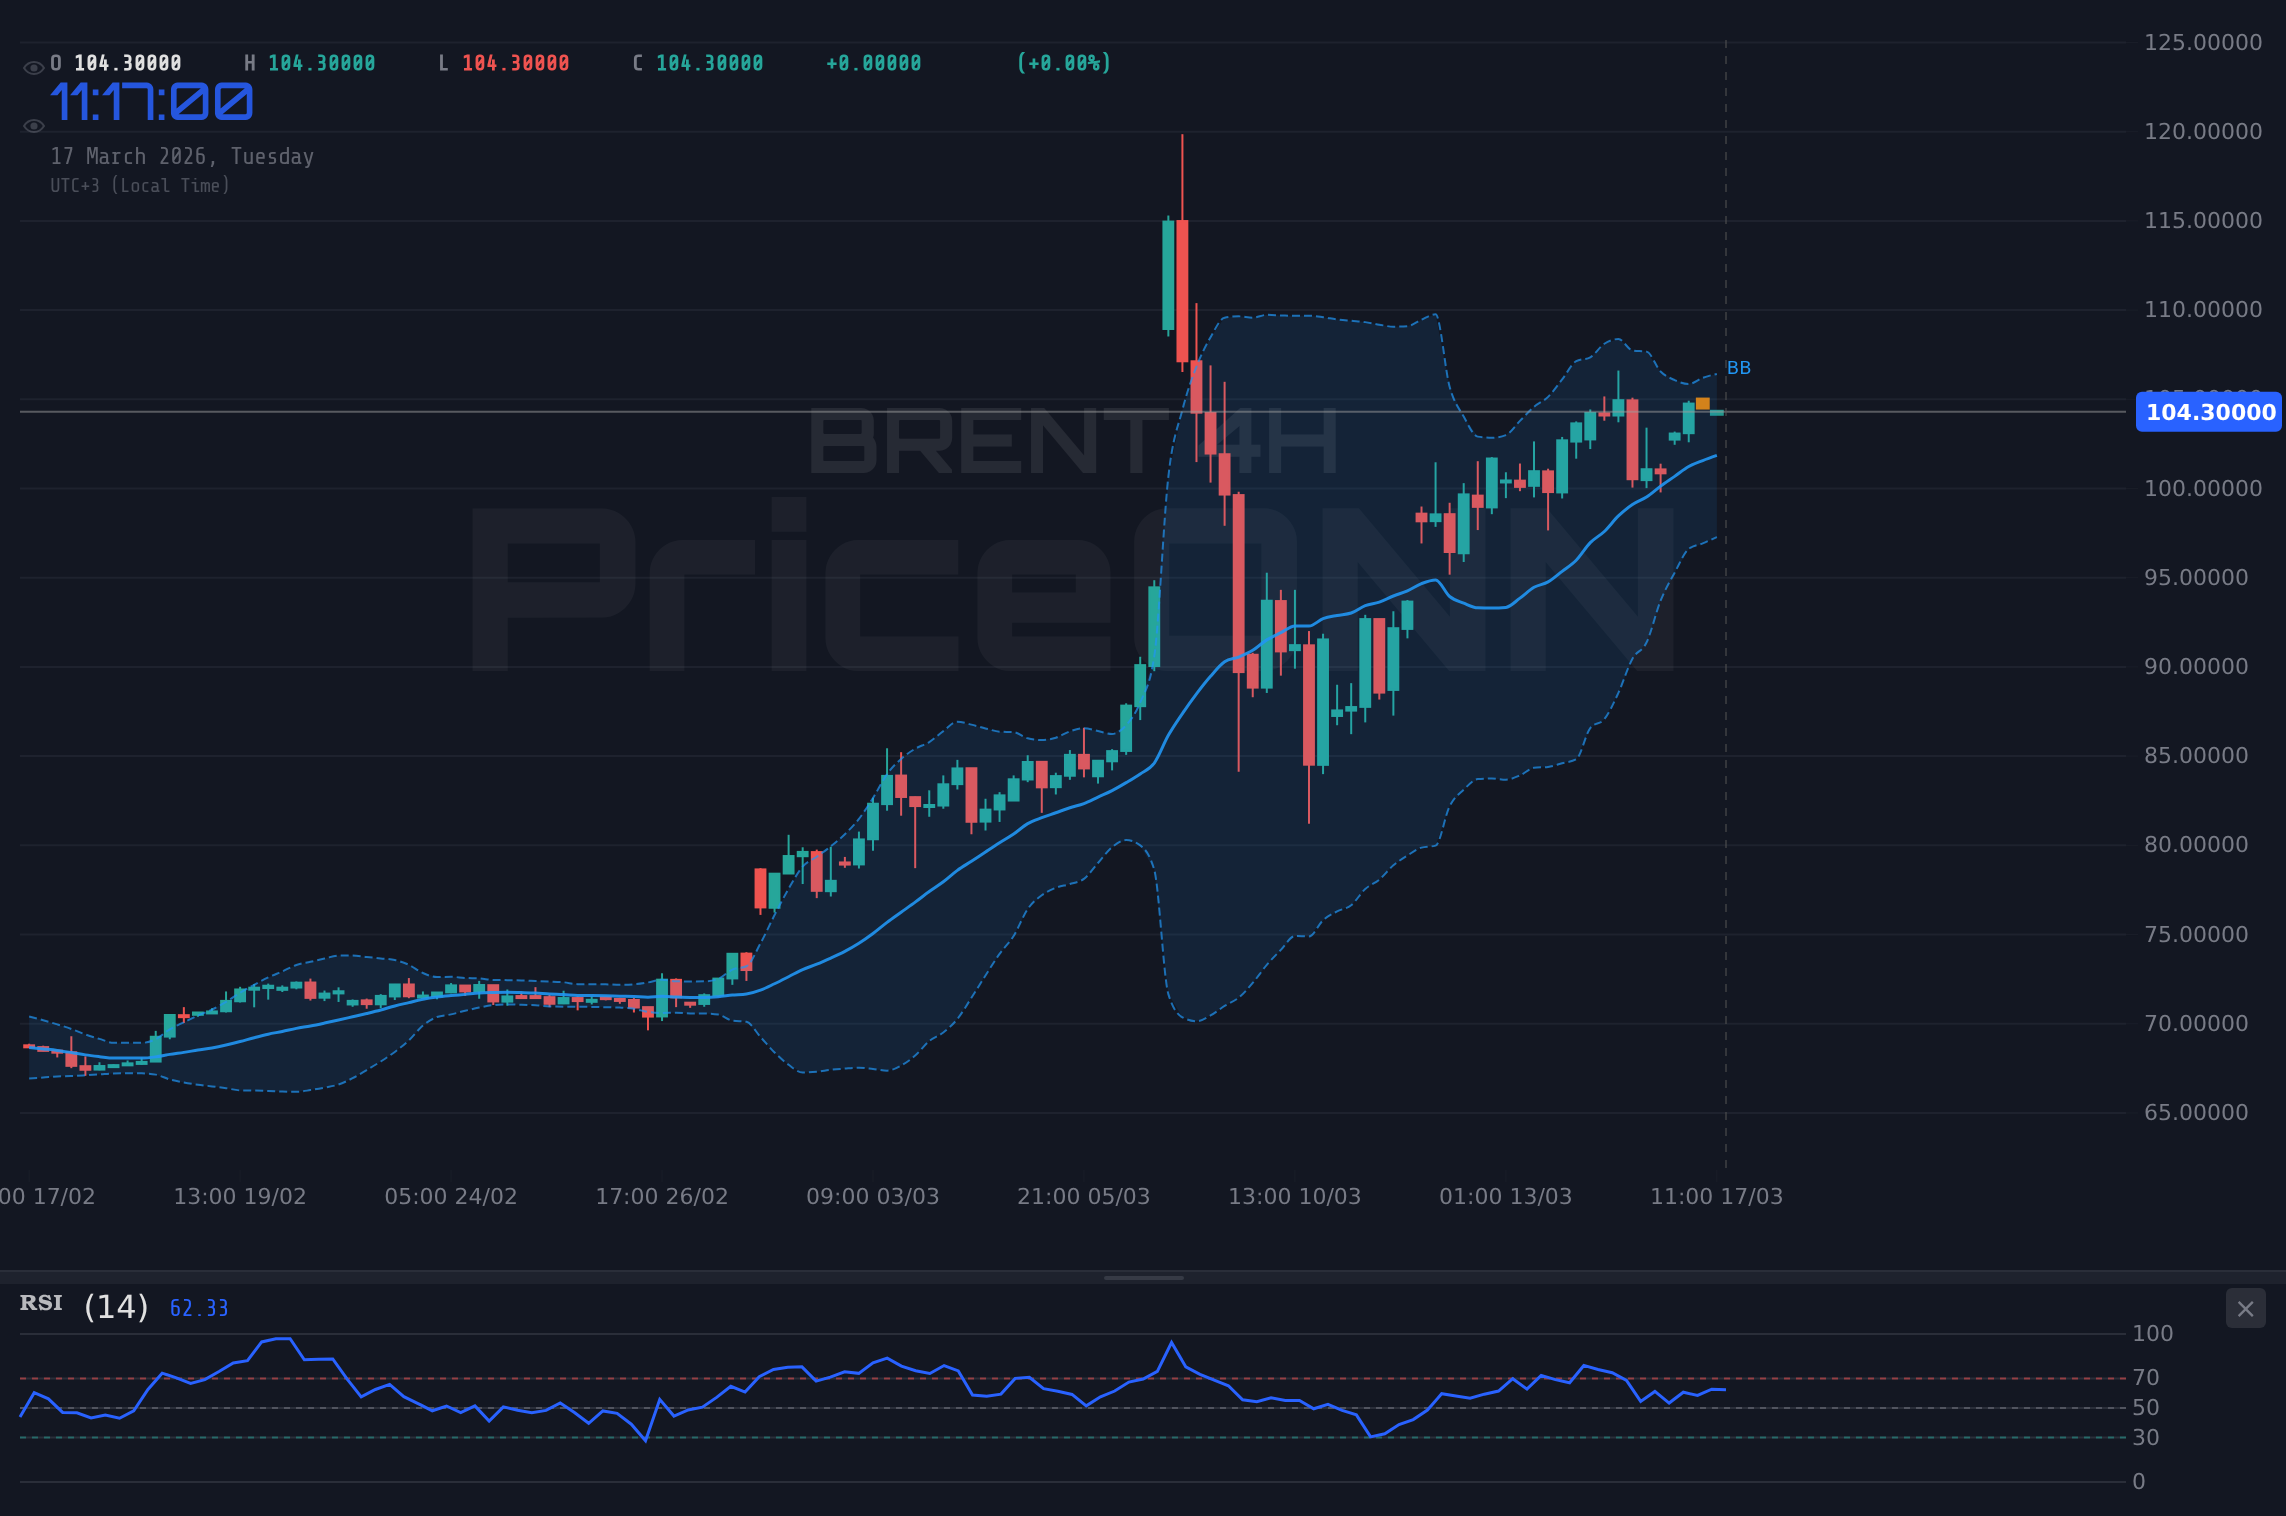
Brent Crude oil is currently trading at $103.56, a level that marks a significant test of resistance amidst a complex geopolitical landscape and shifting supply dynamics. The market is keenly watching whether the current bullish momentum, fueled by escalating tensions and strategic reserve considerations, has enough steam to push prices higher or if profit-taking will lead to a pullback. This analysis delves into the multi-faceted drivers influencing Brent's trajectory, examining technical indicators, fundamental supply-demand balances, and the ever-present geopolitical undercurrents that are shaping the energy market.
- With RSI at 54.97 on the 1H chart, bulls show upward momentum, but the 4H RSI at 59.11 suggests further room to climb before overbought conditions.
- Critical resistance sits at $104.90 (1H) and $105.05 (1D), levels that have historically capped rallies. A sustained break above these is needed for further upside.
- The ADX reading of 59.72 on the daily chart indicates a very strong uptrend, while the 1H ADX at 18.34 suggests weaker trend momentum in the short term.
- Geopolitical risks, including the closure of the Strait of Hormuz, are a significant bullish factor, while strategic reserve releases present a counterbalancing bearish pressure.
The Bull's Roadmap: Navigating Towards Higher Ground
The immediate outlook for Brent Crude oil appears cautiously optimistic, with the current price of $103.56 sitting just below the first significant 1-hour resistance level at $104.90. The daily chart paints a strong bullish picture, with an ADX reading of 59.72 signifying a very strong uptrend, and the RSI at 81.61 firmly in overbought territory. This indicates that while the trend is robustly to the upside, the market may be due for consolidation or a minor pullback before potentially advancing further. However, the 4-hour RSI at 59.11 still shows room for upside, suggesting that the bullish momentum might not be exhausted just yet. The Stochastic indicator on the 4-hour chart is showing a bearish signal (%K < %D), which could hint at a short-term pullback, but the overall trend strength on the daily timeframe suggests that dips might be opportunities for buyers.
The narrative driving this bullish sentiment is multifaceted. Recent news highlights the closure of the Strait of Hormuz, a critical chokepoint for global oil supply, which inherently adds a significant risk premium to prices. This geopolitical event, coupled with the ongoing strategic reserve considerations, creates a volatile environment where supply disruptions are a constant threat. On the demand side, while global economic growth remains a concern, specific regional demand factors, such as potential stimulus measures or unexpected consumption surges, could further bolster prices. The interplay between these supply-side shocks and demand expectations will be crucial in determining whether Brent can overcome the immediate resistance.
From a technical perspective, the 1-hour chart shows a neutral trend with a power of 50%, but with a general buy signal. The RSI at 51.04 is neutral, and the MACD is showing positive momentum. However, the Stochastic indicator on the 1H chart presents a conflicting signal with %K below %D, suggesting caution. The Bollinger Bands are trading above the middle band, indicating an upward bias. The ADX at 23.41 suggests a moderately strong trend, but it's important to note the discrepancy with the daily ADX. This suggests that while the longer-term trend is strongly bullish, the intraday action might be more range-bound or prone to quicker reversals.
The $104.90 Threshold: A Line in the Sand
For the bullish scenario to gain further traction, Brent must convincingly break through the immediate 1-hour resistance at $104.90. A sustained move and close above this level on the 1-hour chart would likely trigger further buying interest, targeting the next resistance at $105.78. If this level is also breached, the psychological $106 mark becomes the next magnet, potentially leading prices towards the daily resistance of $109.24. This upward trajectory would be supported by continued positive momentum on the MACD and a sustained bullish reading on the RSI, ideally moving above 60 without creating excessive divergence. The key here is confluence: a break of resistance should ideally be accompanied by increasing volume and supportive indicator signals across multiple timeframes, not just the 1-hour chart.
The fundamental backdrop would need to remain supportive for such a rally. Continued rhetoric about supply constraints, particularly concerning the Strait of Hormuz, or any indication that OPEC+ might further tighten supply would fuel this bullish case. Furthermore, a softening of the US Dollar Index (DXY), which is currently trading at 99.65 and showing a strong daily uptrend, could provide additional tailwinds for oil prices, as a weaker dollar typically makes dollar-denominated commodities like oil cheaper for holders of other currencies.
Where Bears Take Control: The Risk of a Price Reversal
Despite the strong daily trend, the bearish scenario cannot be ignored, especially given the conflicting signals across different timeframes and the presence of overbought conditions on the daily RSI. The current price of $103.56 is being tested against the 1-hour resistance of $104.90. A failure to break this level, coupled with a close below the 1-hour support at $103.37, could signal the beginning of a retracement. This would be further confirmed if the price breaks below the 4-hour support at $102.62.
The daily chart, despite its strong trend, shows an RSI at 81.61, which is deep into overbought territory. This suggests that the market is ripe for a correction. The Stochastic indicator on the 1-day chart is showing a rising %K line above %D, which is a bullish signal in itself, but given the extreme RSI, a reversal is more likely. If selling pressure intensifies, the next significant support to watch would be the 4-hour level at $102.17, followed by the 1-hour support at $101.84. A decisive break below these levels could trigger a more substantial sell-off, targeting the daily support at $98.22. This scenario would be exacerbated by any news suggesting a de-escalation of geopolitical tensions, a significant increase in non-OPEC+ supply (e.g., higher US shale production), or a coordinated release of strategic petroleum reserves (SPRs) by major consuming nations.
The 4-hour chart presents a mixed picture. While the ADX at 21.72 indicates a moderate uptrend, the RSI at 43.5 shows a bearish bias, and the MACD has negative momentum. This divergence across indicators on the 4-hour timeframe could be an early warning sign of a potential trend reversal or at least a period of consolidation. The Stochastic's bearish signal (%K < %D) on the 1-hour chart also adds to the bearish case for the short term. If oil prices fail to hold above the $103.37 support level, we could see a rapid move lower as the market digests the recent rally and reassesses fundamental drivers.
The $98.22 Target: A Bearish Confirmation
For the bearish scenario to fully materialize, Brent prices would need to fall decisively below the $100 psychological level and break through the daily support at $98.22. Such a move would invalidate the current strong daily uptrend and signal a shift in market sentiment. This would likely be driven by a combination of easing geopolitical fears, perhaps through diplomatic breakthroughs, and a significant increase in global oil supply. Any indication that OPEC+ is considering increasing production quotas, or that US shale producers are significantly ramping up output, could accelerate such a decline. Additionally, a strengthening US Dollar, with the DXY potentially challenging resistance levels above 99.88, would add further downward pressure on oil prices.
The market sentiment analysis also plays a role. If sentiment shifts rapidly from bullishness to fear, driven by macroeconomic concerns or unexpected geopolitical de-escalation, we could see a swift liquidation of long positions. The ADX on the daily chart, currently at 59.72, indicates a very strong trend; a sharp drop in ADX alongside a price decline would signal trend exhaustion and a potential reversal.
The Waiting Game: Consolidation Around $103.56
It is also plausible that Brent Crude will enter a period of consolidation, trading within a defined range as the market digests recent gains and awaits clearer fundamental or geopolitical signals. The current price of $103.56 sits precariously between the immediate 1-hour support at $103.37 and resistance at $104.90. This tight range suggests indecision in the market. The neutral trend strength (50%) across most timeframes, coupled with conflicting indicator signals (e.g., bullish daily Stochastic vs. bearish 1-hour Stochastic), supports the idea of a ranging market in the short to medium term.
In such a scenario, price action would likely be choppy, with attempts to break higher being met by selling pressure and attempts to break lower being met by buying interest. The key levels to watch would be the boundaries of this range: the lower bound around $101.84 (1H support) and the upper bound around $105.78 (1H resistance). Traders would focus on these levels for potential range-bound trading strategies, buying near support and selling near resistance, provided that the overall trend strength (as indicated by ADX) remains moderate and no significant fundamental catalysts emerge.
The economic calendar will be crucial in determining whether a breakout occurs. Upcoming data releases concerning inflation, central bank policy expectations (particularly from the US Federal Reserve and the European Central Bank), and global manufacturing PMIs could provide the necessary impetus. For instance, hotter-than-expected inflation data could reignite fears of further interest rate hikes, potentially strengthening the DXY and pressuring oil prices. Conversely, signs of economic cooling might lead central banks to signal a pivot, potentially weakening the dollar and supporting commodity prices.
The DXY itself, currently at 99.65, is showing a strong daily uptrend, which generally acts as a headwind for oil prices. If the DXY continues to climb towards the 100.32 resistance, it would add to the pressure on Brent. However, if the DXY falters and pulls back towards its support levels, it could provide a much-needed boost to oil prices, facilitating a move above the current resistance.
Consolidation Triggers: What Keeps Prices Stuck?
Several factors could keep Brent Crude locked in a range. A temporary de-escalation in geopolitical tensions, without a full resolution, could reduce the immediate risk premium, while simultaneously, a lack of significant demand growth signals or a coordinated SPR release could cap upside potential. On the technical side, conflicting signals across timeframes, such as a strong daily trend battling against short-term bearish indicators, often lead to periods of indecision and range-bound trading. This stalemate allows the market to absorb new information without making a decisive move.
The balance between supply-side anxieties and demand-side uncertainties creates this equilibrium. For example, while the Strait of Hormuz closure is a significant bullish factor, the market might be waiting for concrete evidence of supply disruption before fully pricing it in. Similarly, while demand from China has shown signs of recovery, the pace and sustainability of that recovery remain a key question mark. This fundamental ambiguity often translates into technical consolidation, with prices oscillating between defined support and resistance levels.
Trade Recommendation: A Watchful Approach
Given the current market conditions for Brent Crude, the decision is a WATCH_ZONE with a score of 2 out of 8. The ADX reading of 21.72 on the 4-hour chart indicates a moderate trend strength, but the conflicting signals across different timeframes and the Stochastic indicator sitting in an extreme zone make immediate entry timing uncertain. The daily chart shows a very strong trend (ADX: 59.72), but the RSI at 81.61 suggests the market is overheated and potentially due for a correction or at least a period of consolidation.
A valid setup for a bullish trade would require clearer confirmation. This means waiting for a decisive break and sustained close above the key 1-hour resistance level at $104.90. Ideally, this breakout should be supported by increasing trading volume and a more consistent bullish signal across indicators, particularly on the 4-hour timeframe. For instance, if the 4-hour RSI moves above 60 and the MACD shows renewed positive momentum, coupled with a break above $104.90, it would strengthen the case for a long position. The invalidation level for such a trade would be a close back below the $102.62 support level on the 4-hour chart, which would signal a failure of the bullish momentum.
Conversely, a bearish setup would emerge if price fails to break the $104.90 resistance and instead breaks decisively below the 1-hour support at $103.37. Confirmation would come from a subsequent break below the 4-hour support at $102.62, potentially targeting the daily support at $98.22. This would require a shift in fundamental drivers, such as easing geopolitical tensions or signs of a global economic slowdown impacting demand.
The extreme RSI reading on the daily chart (81.61) suggests that the market is overextended. While the trend is strong, a sharp correction is possible if key support levels fail. Traders should exercise caution and prioritize risk management.
What I'm Watching This Week
My focus this week will be on a few key triggers that could dictate Brent Crude's next significant move. Firstly, I'll be closely monitoring the price action around the $104.90 resistance level. A clean break and hold above this mark would be a strong bullish signal, potentially opening the door for a move towards $105.78 and beyond. Secondly, I am watching the geopolitical headlines, particularly any developments concerning the Strait of Hormuz and potential SPR releases. Any de-escalation in the Middle East or a significant SPR release could quickly cap upside potential.
Finally, I will be keeping a close eye on the US Dollar Index (DXY). With the DXY currently at 99.65 and showing a strong daily uptrend, any weakness in the dollar could provide significant tailwinds for oil. Conversely, a continued rally in the DXY towards the 100.32 resistance would likely add pressure on Brent. The interplay between these factors will be crucial in determining whether Brent continues its ascent or undergoes a more substantial correction.
| Indicator | Value | Signal | Interpretation |
|---|---|---|---|
| RSI (14) | 59.11 | Bullish | Uptrend momentum continues on 4H, but daily RSI (81.61) is overbought. |
| MACD Histogram | +1.25 | Bullish | Positive momentum on 1H, but watch for divergences. |
| Stochastic | K=47.25, D=54.88 | Bearish | Bearish crossover on 4H, suggesting potential pullback. |
| ADX | 59.72 | Strong Trend | Very strong uptrend on Daily, but weaker on 1H (18.34). |
| Bollinger Bands | Middle Band | Watch | Price above middle band on 1H/4H supports bullish case. |
Frequently Asked Questions: BRENT Analysis
What happens if BRENT breaks above $104.90 resistance?
A sustained break above $104.90 on the 1-hour chart would likely trigger further buying, targeting resistance at $105.78. This bullish scenario is more probable if accompanied by strong volume and easing geopolitical tensions.
Should I buy BRENT at $103.56 given the daily RSI at 81.61?
Buying at current levels is risky due to the daily RSI being in overbought territory. A confirmation signal, such as a break above $104.90 with supportive indicators, would be needed. Alternatively, waiting for a pullback to support levels like $102.62 might offer a better risk/reward ratio.
Is the ADX at 59.72 a sell signal for BRENT?
An ADX of 59.72 on the daily chart indicates a very strong existing trend, not necessarily a sell signal. However, it signals that the market is extended, increasing the probability of a correction or consolidation. The current trend is bullish, but caution is advised.
How will the Strait of Hormuz closure affect BRENT prices this week?
The closure of the Strait of Hormuz is a significant bullish catalyst, introducing supply disruption risk. This could push BRENT prices higher, potentially towards the $109.24 resistance, unless countered by significant SPR releases or de-escalation in geopolitical tensions.
The path forward for Brent Crude oil hinges on a delicate balance of competing forces. While the strong daily trend and geopolitical anxieties provide a bullish underpinning, the overbought conditions on daily indicators and conflicting signals across shorter timeframes suggest that caution is warranted. A decisive move above $104.90 could ignite further upside, while a failure to hold the $103.37 support might signal a retracement. Traders should remain vigilant for confirmation signals and manage risk diligently in this dynamic market.
Track markets in real-time
AI-powered analysis, technical indicators and real-time price data.
Join Our Telegram Channel
Breaking market news, AI analysis and trading signals instantly.
Join Channel