AUDUSD Tests $0.71052 Resistance Amidst Bullish Momentum
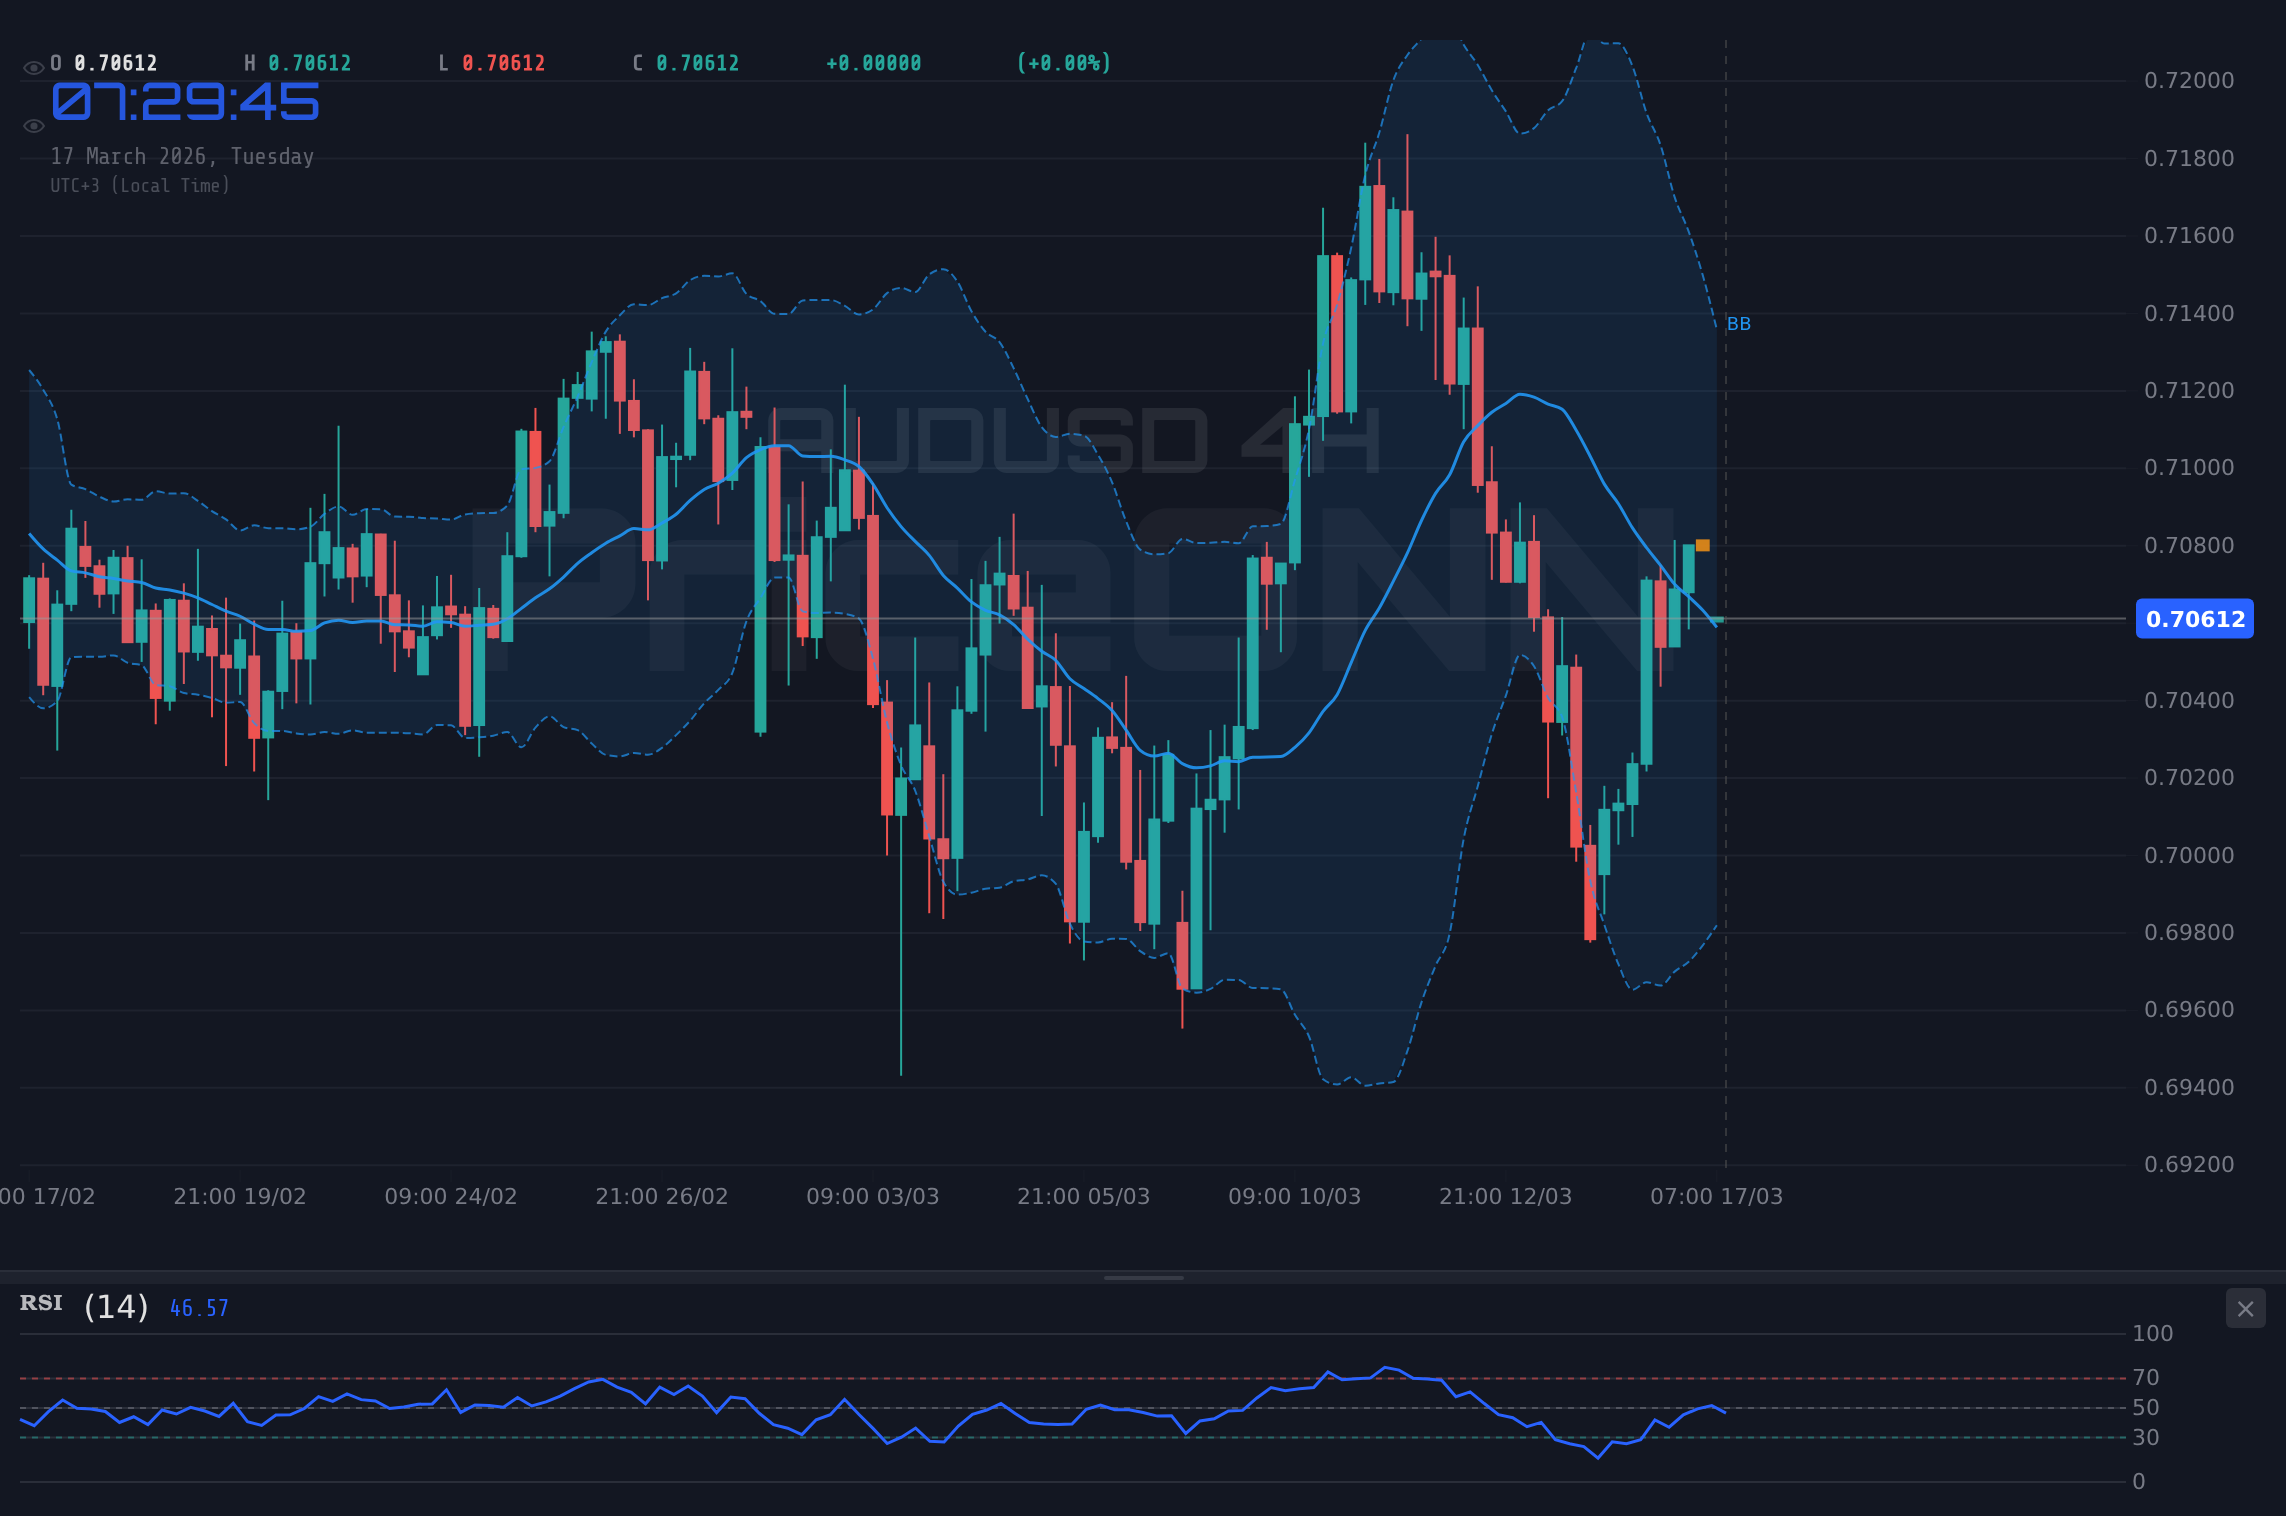
AUDUSD is currently trading at $0.70635, approaching the $0.71052 resistance level. Technical indicators suggest a cautious bullish outlook as traders watch for a decisive breakout.
The AUDUSD currency pair is currently navigating a critical juncture, hovering around the $0.70635 mark. With the Australian dollar showing signs of strength against its US counterpart, attention is firmly fixed on the significant resistance level at $0.71052. This level represents a key hurdle that, if breached, could signal a continuation of the bullish trend. However, the path forward is not without its complexities, as conflicting signals from technical indicators and broader market sentiment warrant a measured approach. Understanding the interplay between currency dynamics, commodity prices, and global risk appetite is crucial for traders looking to capitalize on potential moves in AUDUSD.
- RSI at 55.55 on the 1H chart signals neutral to slightly bullish momentum, indicating room for upward movement but cautioning against extreme overextension.
- The key resistance level to watch is $0.71052; a daily close above this level would be a significant bullish confirmation.
- MACD histogram shows positive momentum on the 1H chart, supporting the current bullish lean, while the 1D chart shows negative momentum, indicating potential for a reversal.
- The ADX at 28.22 on the 1H timeframe suggests a strengthening trend, but the ADX at 23.47 on the 1D chart indicates a weaker trend overall, highlighting a mixed picture.
- The US Dollar Index (DXY) is trading at 99.68, showing strength that typically puts pressure on pairs like AUDUSD.
The recent market action for AUDUSD has been characterized by a steady climb, pushing towards higher ground. On the 1-hour timeframe, the pair is exhibiting a generally positive bias, with the MACD histogram showing positive momentum and the Stochastic oscillator (%K > %D) signaling an upward trajectory. This short-term bullishness is further supported by an ADX reading of 28.22 on the 1H chart, indicating a strengthening trend. Traders are observing the price action closely as it approaches the significant resistance at $0.71052. A decisive break and sustained hold above this level could unlock further upside potential, potentially targeting subsequent resistance levels.
However, the longer-term technical picture presents a more nuanced view. The 4-hour chart shows a neutral trend strength with an ADX of 19.68, suggesting that the market might be in a choppier, ranging environment rather than a strong directional move. While the 1-hour Stochastic is bullish, the daily Stochastic is showing a bearish signal (%K < %D) with values at 36.93 and 56.32 respectively, hinting at potential exhaustion or a coming downturn. Furthermore, the 1-day RSI is at 52.16, sitting squarely in neutral territory with a slight upward eğilim, but not indicating strong buying conviction. This divergence across timeframes underscores the importance of waiting for clearer signals before committing to a trade. The current price of $0.70635 finds itself caught between these conflicting short-term and long-term indicators.
The broader economic landscape plays a crucial role in shaping the AUDUSD's trajectory. The US Dollar Index (DXY) is currently trading at 99.68, showing a notable increase of 0.24% on the day. A stronger dollar typically exerts downward pressure on currency pairs like AUDUSD, as it becomes more expensive for holders of other currencies to acquire US dollars. This correlation is a critical factor for traders to consider. While AUDUSD has managed to climb, the rising DXY presents a headwind. Any sustained strength in the dollar could potentially cap upside movements for AUDUSD, even if domestic Australian factors are supportive.
On the Australian front, recent economic data and Reserve Bank of Australia (RBA) policy expectations are key drivers. While specific RBA news isn't provided, the general market sentiment around the Australian economy and its monetary policy outlook significantly influences the AUD. If inflation figures continue to cool or if the RBA signals a less hawkish stance, it could dampen the Australian dollar's appeal. Conversely, stronger-than-expected economic indicators from Australia, or hawkish commentary from RBA officials, could provide the necessary impetus for AUDUSD to break through the $0.71052 resistance. The ongoing narrative surrounding global inflation and central bank tightening cycles will continue to be a major theme.
Looking at the commodity markets, particularly oil, provides additional context. WTI crude oil is trading around $95.91, showing a strong upward move of 1.99%. Brent crude is also on the rise, trading at $103.24 with a 2.37% gain. Higher oil prices can sometimes be a double-edged sword for commodity currencies like the Australian dollar. While it can signal increased global demand and commodity strength, it also contributes to inflationary pressures, which could lead to tighter monetary policy and potentially slow economic growth. For AUDUSD, the impact of rising oil prices is often intertwined with the broader risk sentiment in the market. A sharp rise in oil prices can sometimes coincide with a decline in risk appetite, which might not always benefit the risk-sensitive Australian dollar.
The technical indicators on the 1-hour chart offer a mixed but predominantly bullish signal. The RSI is at 55.55, comfortably in neutral territory but leaning towards bullish, suggesting room for further gains. The MACD is showing positive momentum, with its histogram above the signal line, reinforcing the short-term upward bias. The Stochastic oscillator presents a strong bullish signal, with %K (86.74) well above %D (63.37) on the 1H chart, indicating strong buying interest. However, the ADX at 28.22 on this timeframe points to a strengthening trend, which is a positive sign for the bulls. These short-term indicators collectively suggest that the immediate pressure might be to the upside, targeting resistance levels above the current $0.70635 price.
Transitioning to the 4-hour timeframe, the technical picture becomes more cautious. The ADX at 19.68 indicates a weaker trend, suggesting that the upward momentum seen on the 1-hour chart might not be sustainable in the medium term. The RSI at 52.97 remains in neutral territory, offering no strong directional conviction. The MACD is positive, but the Stochastic oscillator shows a bearish signal with %K (88.24) above %D (57.42) but starting to diverge, hinting at a potential pullback. The Bollinger Bands on the 4H chart are positioned below the middle band, which can sometimes precede a reversal or a period of consolidation. This intermediate timeframe analysis suggests that while the intraday trend may be bullish, the medium-term outlook requires further confirmation.
The daily chart analysis provides the longest-term perspective and reveals further complexities. The ADX at 23.47 indicates a weak trend, implying that the market is not strongly committed to a particular direction. The RSI at 52.16 is neutral, and the MACD shows negative momentum, with the histogram below the signal line. This suggests that the longer-term trend might be consolidating or even preparing for a downward correction. The Stochastic oscillator on the daily timeframe is showing a bearish signal (%K at 36.93, %D at 56.32), reinforcing the idea that the bullish momentum may be waning. Therefore, while the immediate intraday action might favour buyers, the daily outlook suggests caution and a need for a strong catalyst to break the established resistance at $0.71052.
The current setup for AUDUSD presents a classic 'watch zone' scenario. The confluence of short-term bullish signals, including positive MACD and Stochastic readings on the 1-hour chart, clashes with longer-term neutral to bearish indicators on the daily timeframe, such as negative MACD momentum and a bearish Stochastic signal. The ADX values also vary significantly across timeframes, indicating a lack of a strong, consistent trend. This environment is often characterized by heightened volatility and potential for false breakouts. Traders should exercise patience and wait for a clearer directional signal before initiating positions. A daily close above the critical resistance at $0.71052 would be the primary bullish confirmation, potentially invalidating the bearish signals from longer timeframes.
Conversely, a failure to break above $0.71052 could lead to a reversal. If AUDUSD fails to sustain its upward momentum and begins to retreat, the support levels at $0.70821, $0.70546, and potentially $0.70406 would come into focus. A break below the $0.70406 support could signal a more significant downside move, triggering the bearish scenarios suggested by the daily chart's technical indicators. The prevailing risk sentiment, driven by global events and central bank policies, will play a pivotal role in determining which direction AUDUSD ultimately takes. The strength of the US Dollar, currently at 99.68 on the DXY, will be a key factor to monitor in this regard.
Considering the current market conditions, a high-probability trade setup for AUDUSD would likely require a clear break and confirmation above the $0.71052 resistance. This would involve sustained buying pressure, ideally accompanied by improving short-term and medium-term technical indicators, and a favorable macroeconomic backdrop. For instance, if US inflation data comes in softer than expected, or if the Federal Reserve signals a pause in rate hikes, it could weaken the dollar and support a move higher in AUDUSD. Such a scenario would likely see the RSI move into overbought territory (above 70) and the MACD maintain positive momentum across multiple timeframes.
Conversely, a bearish setup would be confirmed by a decisive break below key support levels. If AUDUSD fails to hold the $0.70635 level and subsequently breaks below $0.70406, it would invalidate the short-term bullish thesis. This could be triggered by stronger-than-expected US economic data, hawkish commentary from the Federal Reserve, or escalating geopolitical tensions that boost the safe-haven demand for the US dollar. In such a scenario, traders would look for the RSI to fall below 40 and the MACD to cross below its signal line on daily charts, indicating a shift in momentum towards sellers.
The volatility analysis suggests that while there is upward pressure, the lack of a strong trend across all timeframes indicates a potential for ranging or choppy price action. The ADX values, ranging from 19.68 (4H) to 28.22 (1H), highlight this uncertainty. Traders should be prepared for potential whipsaws around the $0.71052 resistance and the $0.70406 support levels. Risk management will be paramount. Implementing stop-loss orders judiciously, perhaps just below the immediate support for long positions or just above resistance for short positions, will be essential for navigating this uncertain market environment. Patience is key; waiting for a clear breakout or breakdown confirmation will significantly improve the probability of a successful trade.
AUDUSD is at a pivotal point, testing resistance at $0.71052. While short-term indicators show bullish signs, longer-term technicals and the strong US Dollar present significant challenges. The market is currently in a 'watch zone', demanding patience and a clear strategy. Traders should look for a decisive move above $0.71052 for bullish confirmation, or prepare for a potential reversal if key support levels are breached. The interplay of global economic data, central bank policies, and geopolitical events will ultimately dictate the next significant move for this currency pair.
Frequently Asked Questions: AUDUSD Analysis
What happens if AUDUSD breaks above the $0.71052 resistance level?
A sustained break above $0.71052 would likely confirm a bullish continuation. This could trigger further upside, potentially targeting higher resistance levels around $0.71417 and $0.72019. Such a move would align with the short-term bullish signals seen on the 1-hour chart, but would require confirmation from daily indicators.
Should I buy AUDUSD at current levels of $0.70635 given the mixed signals?
Buying at $0.70635 with mixed signals carries significant risk. The 1-hour chart shows bullish indicators, but the daily chart presents bearish divergence and weak trend strength (ADX 23.47). It is advisable to wait for a clear breakout above $0.71052 or a confirmed breakdown below support like $0.70406 before entering a trade.
Is the RSI at 52.16 a sell signal for AUDUSD on the daily chart?
An RSI of 52.16 on the daily chart is considered neutral territory, not a direct sell signal. While it indicates neither strong buying nor selling pressure, the overall bearish momentum on the daily MACD and Stochastic suggests that upside potential might be limited. A move below 40 would be a more definitive bearish signal.
How will the DXY strength at 99.68 affect AUDUSD this week?
The DXY's current strength at 99.68 typically exerts downward pressure on AUDUSD. If the dollar continues to strengthen, it may cap any upward attempts by AUDUSD, potentially leading to a test of support levels. However, if US economic data surprises to the downside or the Fed signals a dovish shift, the DXY could weaken, offering AUDUSD an opportunity to climb.
| Indicator | Value | Signal | Interpretation |
|---|---|---|---|
| RSI (14) | 52.16 | Neutral | Neutral territory, slight upward eğilim on daily. |
| MACD Histogram | -0.0001 | Bearish | Negative momentum on daily, hinting at potential reversal. |
| Stochastic (%K) | 36.93 | Bearish | Bearish signal on daily, %K < %D, suggesting waning momentum. |
| ADX | 23.47 | Weak Trend | Indicates a lack of strong directional commitment on daily. |
| Bollinger Bands | Middle Band | Watch | Price is below the middle band on daily, suggesting potential downside. |
Track markets in real-time
AI-powered analysis, technical indicators and real-time price data.
Join Our Telegram Channel
Breaking market news, AI analysis and trading signals instantly.
Join Channel