WTI Crude Tests $95.30: Below $100 Amid Escalating Middle East Tensions
WTI crude oil futures are trading at $95.30, down from intraday highs near $101. Escalating Middle East tensions and easing Hormuz Strait concerns are driving the price action.
Now this is where it gets interesting! WTI crude oil, the benchmark for American crude, is currently sitting at $95.30. Just hours ago, it was flirting with the $101 mark, but a swift pullback has seen it tumble over 3% from its intraday highs. This dramatic intraday swing highlights the extreme volatility currently gripping the oil markets, fueled by a complex interplay of geopolitical tensions in the Middle East, shifting supply dynamics, and evolving inflation expectations. The market sentiment is clearly shifting, and understanding the drivers behind this rapid price action is crucial for any trader looking to navigate these choppy waters.
- WTI crude is currently trading at $95.30, down over 3% from intraday highs near $101.
- The ADX indicator at 22.7 suggests a moderate trend, indicating potential for further price movement.
- Key support is identified at $94.02, with a critical breakdown level at $92.73.
- Resistance is being tested around $95.31, with a significant barrier at $96.60.
- Geopolitical tensions in the Middle East and easing concerns over the Strait of Hormuz are key drivers.
The dramatic intraday reversal in WTI prices, from a high of $101.58 to a low of $92.81, underscores the sensitivity of oil markets to geopolitical events and shifting supply narratives. While tensions in the Middle East initially propelled WTI above the $100 mark, news of Japan tapping strategic reserves and potentially easing fears around the Strait of Hormuz created a rapid unwinding of those gains. This price action is a classic example of how quickly sentiment can pivot in commodity markets, especially when dealing with supply-disruption risks. The market's reaction demonstrates that while geopolitical risk premiums are significant, they can be volatile and subject to rapid reassessment based on new information. Traders are now grappling with whether the recent geopolitical flare-up was a temporary spike or the precursor to a more sustained period of higher oil prices.
Why WTI Volatility Analysis Points to a Breakout
Looking at the technical picture, the 1-hour chart for WTI paints a picture of indecision following a sharp move. The trend is currently classified as 'Uplift' with a strength of 87%, but this is quickly being challenged. The ADX, a measure of trend strength, stands at 23.08, indicating a moderately strong trend. However, the RSI(14) is at 47.84, sitting in neutral territory and showing a bearish inclination, suggesting that the upward momentum from earlier has stalled. Simultaneously, the Stochastic indicator is showing a bullish signal (%K > %D at 50.59 vs 25.36), creating a conflict. This divergence between indicators suggests that the market is at a crossroads. The price action has been choppy, with the Bollinger Bands showing the price moving below the middle band, signaling a bearish short-term sentiment. The overall signal for the 1-hour timeframe is 'SELL' (3 Buy, 5 Sell, 0 Neutral), reflecting this current bearish pressure.
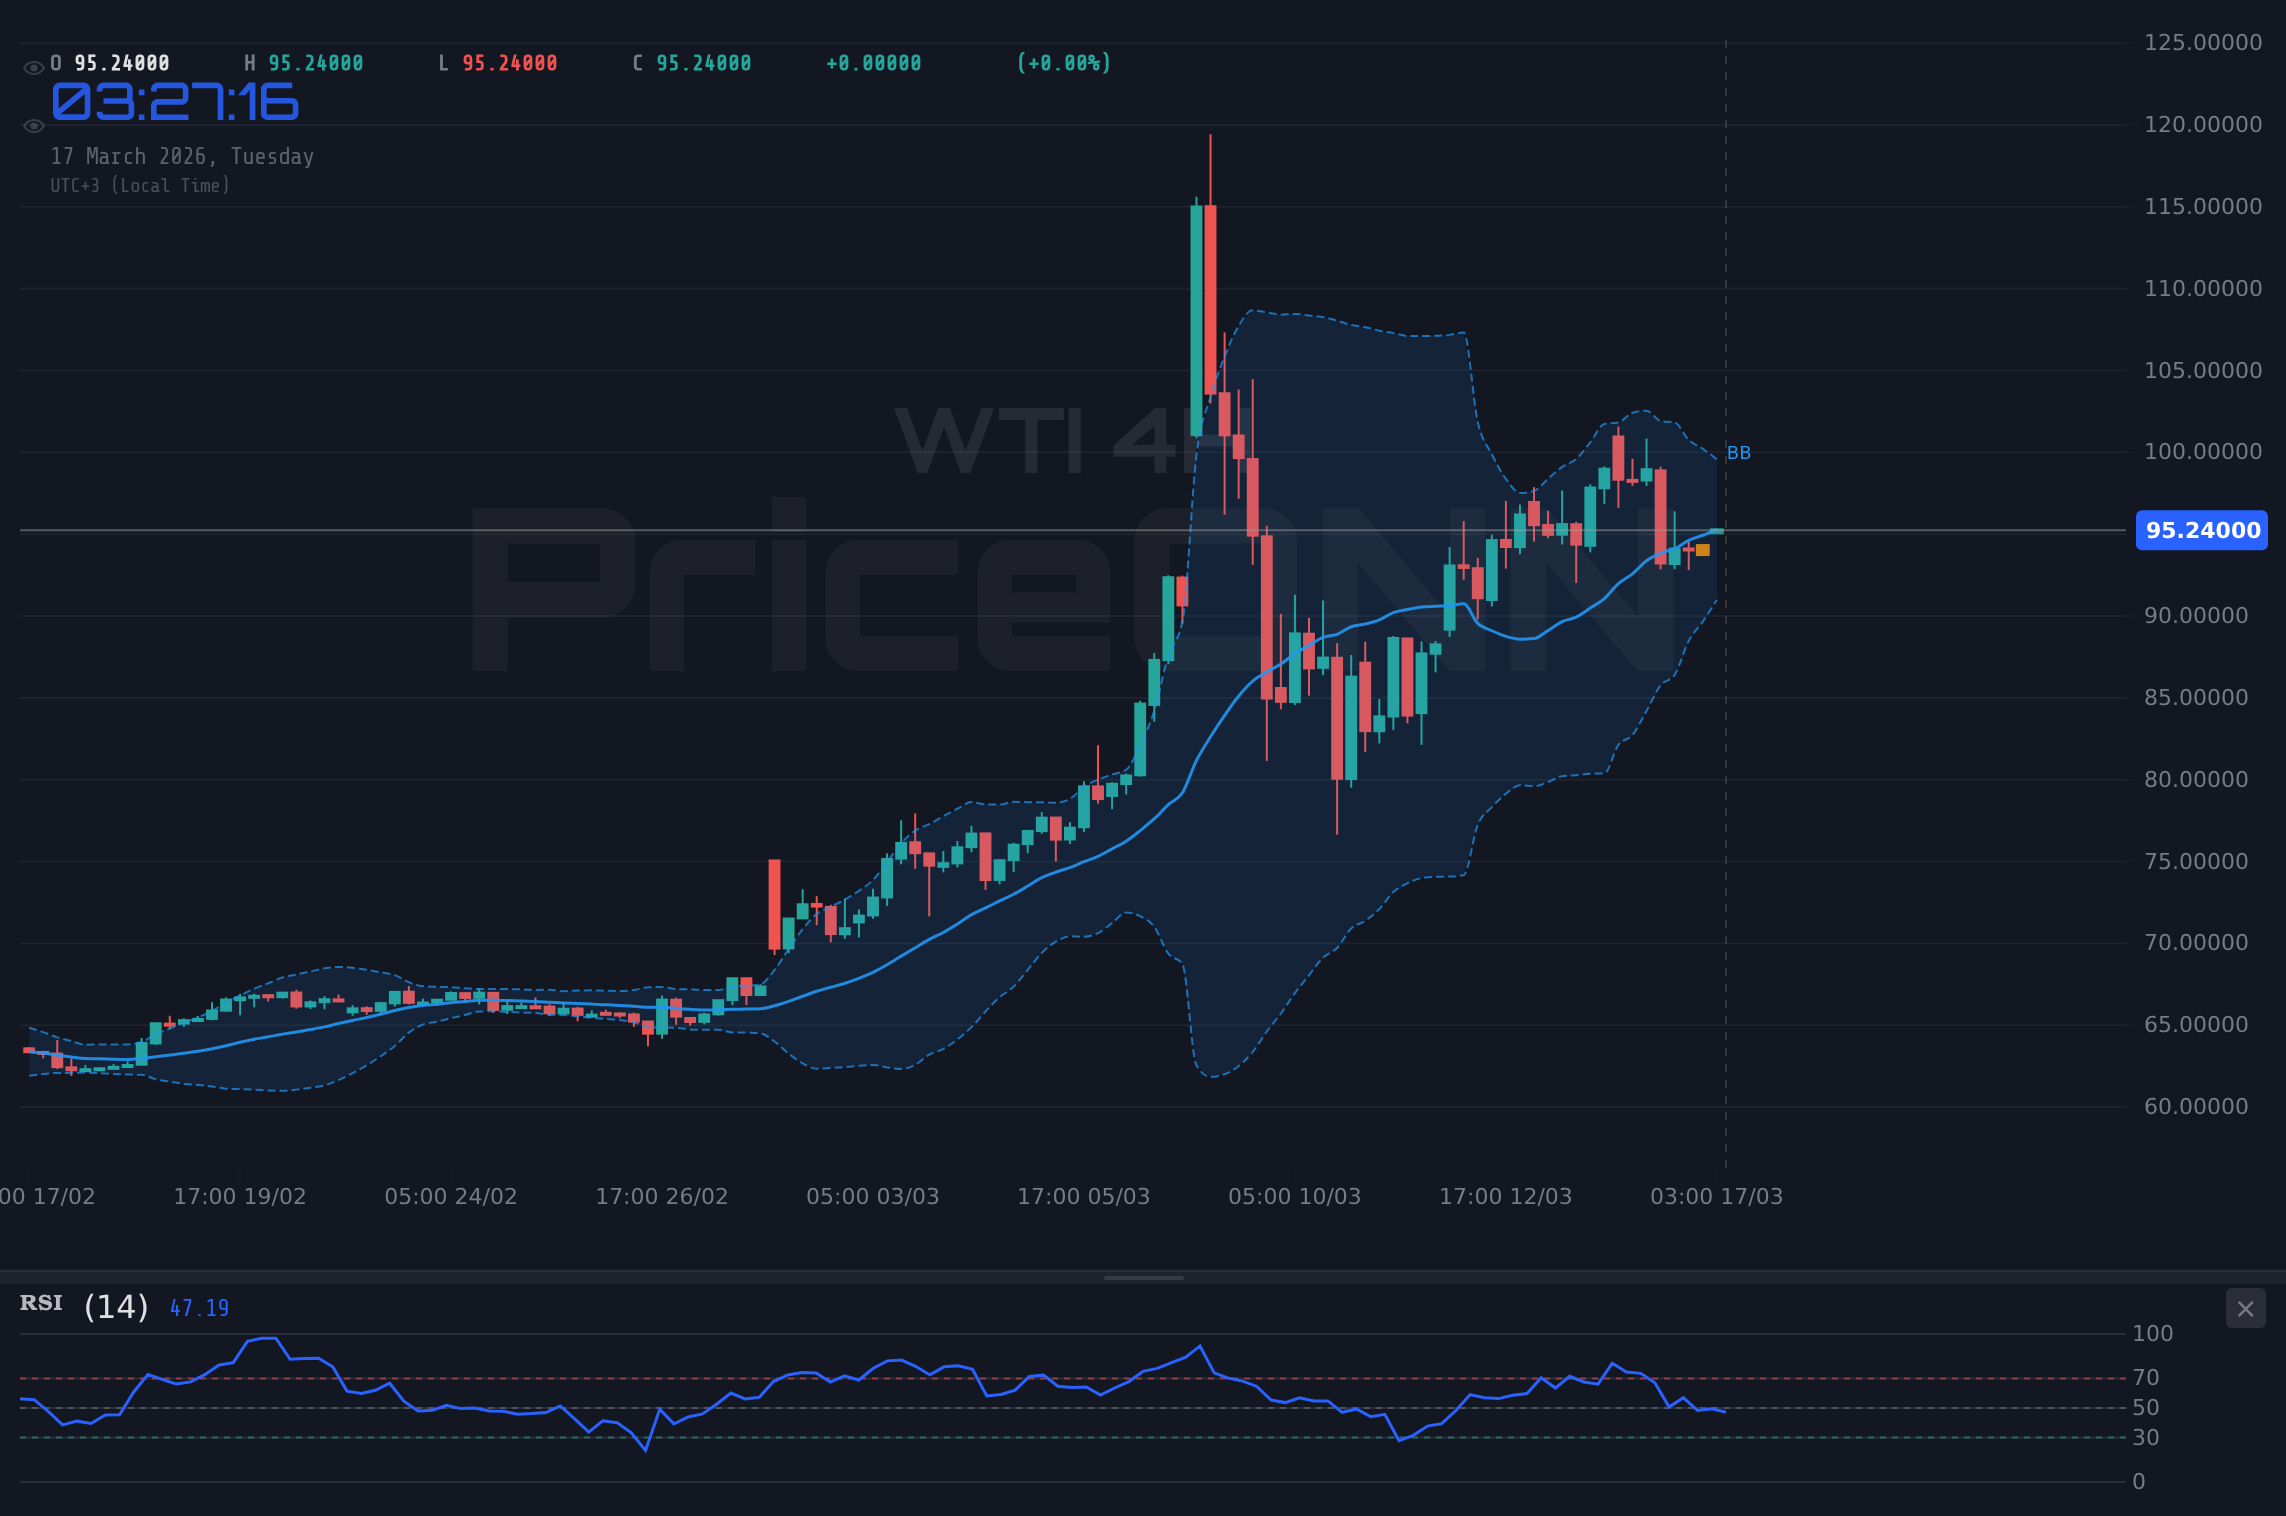
The 4-hour timeframe provides a slightly different perspective. Here, the trend is marked as 'Neutral' with 50% strength. The RSI(14) is at 53.82, slightly favoring a bullish inclination, while the MACD shows negative momentum, with the MACD line below its signal line. The Stochastic indicator, however, is signaling a potential downturn (%K < %D at 22.89 vs 56.75). The Bollinger Bands are above the middle band, indicating some underlying bullishness, but the overall signal is 'BUY' (5 Buy, 3 Sell, 0 Neutral). This mixed picture across the shorter timeframes suggests that while the immediate pressure might be downwards, there's underlying support that could prevent a sharp collapse. The ADX at 22.7, indicating a moderate trend, further supports the idea that we are in a transitionary phase, where the market is trying to decide its next major direction.
The Daily Chart: A Strong Uptrend Under Pressure
On the daily chart, the picture for WTI is still predominantly bullish, though it is clearly under pressure. The trend is classified as 'Uplift' with 100% strength. The RSI(14) is at 74.96, firmly in overbought territory. This is a significant reading, as it suggests that the recent rally might be extended and vulnerable to a correction. Typically, an RSI above 70 signals that an asset is overbought and could be due for a pullback. The MACD is showing positive momentum, with the MACD line above its signal line, supporting the bullish trend. However, the Stochastic indicator is showing a bearish signal (%K < %D at 53.24 vs 53.28), which aligns with the RSI's overbought reading. The Bollinger Bands are above the middle band, reinforcing the bullish trend. The ADX at 52 indicates a very strong uptrend, suggesting that the underlying strength behind the move is substantial, even with the overbought conditions.
The overall signal on the daily chart is 'BUY' (5 Buy, 2 Sell, 0 Neutral), reflecting the dominant uptrend. However, the high RSI reading is a clear warning sign for traders. It suggests that while the trend is strong, the market is potentially overextended. This increases the probability of a reversal or at least a significant correction in the near term. The current price of $95.30 is well above the daily support levels of $94.30 (S1) and $89.59 (S2), but a break below these could signal a more substantial downturn. Resistance lies at $101.43 (R1) and $103.85 (R2). The proximity of the current price to the intraday high of $101.58 and the significant daily resistance at $101.43 is a key focal point. A failure to decisively break above $100 could lead to a cascade of selling as overbought conditions are realized.
Navigating the Geopolitical Crosscurrents
The recent price action in WTI crude cannot be understood without acknowledging the geopolitical backdrop. Escalating tensions in the Middle East, particularly concerning potential supply disruptions, have been a major catalyst for the upward price movement. Reports from sources like Reuters and Bloomberg have highlighted concerns over key shipping routes, such as the Strait of Hormuz, which is critical for global oil tanker traffic. Japan's decision to tap into its strategic oil reserves, as reported by outlets like CNBC, indicates the seriousness with which governments are viewing these supply risks. This move is intended to alleviate immediate supply pressures and calm market nerves. However, the effectiveness of such measures in the face of sustained geopolitical uncertainty remains to be seen.
The market's rapid discounting of these geopolitical risks, evidenced by the sharp drop from the intraday high, suggests that traders are weighing multiple factors. While conflict in the region inherently introduces a risk premium, the perception of that risk can change rapidly. Easing fears, even temporarily, can lead to a swift unwinding of long positions. Furthermore, the correlation with other markets, such as the US Dollar Index (DXY), plays a crucial role. With the DXY currently at 99.67 and showing mixed signals across timeframes but a strong daily uptrend, its influence on oil prices is significant. A strengthening dollar typically puts downward pressure on dollar-denominated commodities like oil, making them more expensive for holders of other currencies. This inverse relationship adds another layer of complexity to price forecasting.
The Role of Central Banks and Inflation
Beyond immediate geopolitical events, the broader macroeconomic environment, heavily influenced by central bank policies, continues to shape the outlook for oil prices. The persistent inflation seen across major economies remains a primary concern for central banks like the Federal Reserve and the European Central Bank. While the immediate focus might be on supply-side shocks from the Middle East, the underlying demand for oil is still influenced by global economic growth prospects and monetary policy. If inflation remains stubbornly high, central banks may be forced to maintain tighter monetary policies, potentially dampening global economic activity and, consequently, oil demand.
The market is constantly pricing in expectations for future central bank actions. Any hints from Fed officials, or changes in Fed Fund Futures pricing, can significantly impact risk appetite and commodity prices. Currently, the DXY's daily uptrend suggests a degree of dollar strength that could be partly driven by expectations of a hawkish Fed stance or a 'higher for longer' interest rate narrative. This macroeconomic backdrop is critical. Even if geopolitical tensions were to subside, a global economic slowdown driven by aggressive monetary tightening could cap oil prices. The delicate balance between supply-driven inflation and demand destruction due to monetary policy is the tightrope oil markets are currently walking.
Trade Scenarios and Risk Management
Given the current technical signals and the volatile geopolitical landscape, a cautious yet opportunistic approach is warranted for WTI. The 1-hour chart shows bearish pressure with an overall 'SELL' signal, driven by the RSI and MACD readings, despite a conflicting Stochastic signal. The 4-hour chart presents a mixed picture, while the daily chart, despite its strong uptrend, shows clear overbought conditions on the RSI.
Scenario A: Bullish Continuation
45% ProbabilityScenario B: Bearish Reversal
55% ProbabilityThe higher probability is assigned to the bearish scenario due to the clear overbought conditions on the daily RSI, the conflicting signals across timeframes, and the intraday price reversal. The critical support at $94.30 must hold for the bullish thesis to remain viable. A break below this level, especially on significant volume, could trigger stop-losses and accelerate the decline towards the lower targets. Conversely, a sustained break above the $95.31 resistance, confirmed by bullish momentum across multiple timeframes, could signal a continuation of the uptrend, targeting the $96.60 and potentially the $101.13 levels. Prudent risk management is paramount; consider using tighter stop-losses on shorter timeframes and wider stops on the daily for longer-term positions.
The Canadian Dollar Connection: Oil's Influence
It's impossible to discuss WTI price action without mentioning its impact on commodity-linked currencies, particularly the Canadian Dollar (CAD). The Canadian Dollar often moves in tandem with oil prices due to Canada's significant oil export industry. When WTI prices surge, the CAD tends to strengthen, and vice versa. This is a well-established correlation that traders closely monitor. For instance, news about oil prices falling below $94 a barrel, as reported recently, directly impacts the outlook for the CAD. If oil prices continue to decline, it would likely put downward pressure on the Canadian Dollar, potentially creating opportunities for trades on pairs like CAD/JPY or USD/CAD.
The Bank of Canada (BoC) and the Bank of Japan (BoJ) are key players in this narrative. The BoC's monetary policy decisions are often influenced by inflation and growth, which are themselves tied to energy prices. Similarly, the BoJ's stance on interest rates and its approach to monetary policy can affect the yen's strength against the Canadian dollar. Recent news flow, even if indirectly related, such as discussions around inflation cooling below expectations in Canada, could signal a shift in the BoC's policy path. This complex interplay between oil prices, central bank policies in Canada and Japan, and currency movements (CAD/JPY) is a critical area for analysis. Traders looking for opportunities should monitor how these factors align or diverge, as they can create significant trading signals.
What Does the Data Tell Us About Tomorrow?
The current technical setup for WTI presents a classic battleground scenario. The daily chart shows a strong uptrend that is showing signs of exhaustion due to overbought RSI levels. The intraday price action has reversed sharply, indicating significant profit-taking or a shift in sentiment. The 1-hour and 4-hour charts are showing conflicting signals, which is typical during periods of uncertainty. The ADX at 23.08 on the 1-hour chart and 22.7 on the 4-hour chart suggests that a trend is present but not yet overwhelmingly dominant, leaving room for both upside continuation and downside correction.
The key level to watch in the immediate short term is the $94.02 support. A decisive break below this level would invalidate the bullish scenario and open the door for a move towards $92.73. On the upside, holding above $95.31 and pushing towards $96.60 would be the first step for bulls to regain control. However, the looming resistance around the $101.13 to $101.43 zone remains a significant hurdle, especially given the current overbought daily RSI reading. The market is digesting the geopolitical news, and the response from central banks regarding inflation will be crucial in determining the longer-term trajectory. For now, patience and adherence to risk management principles are key. Wait for clear confirmation on a break of either the support or resistance levels before committing to a trade.
Frequently Asked Questions: WTI Analysis
What happens if WTI breaks below the $94.02 support level?
If WTI closes decisively below the $94.02 support level, it would signal a potential trend reversal on shorter timeframes. This could trigger further selling pressure, targeting the next support at $92.73, and potentially extending towards $89.59. The daily RSI's overbought condition would be a key factor confirming this bearish move.
Should I buy WTI at current levels of $95.30 given the daily RSI is at 74.96?
Buying at $95.30 with the daily RSI at 74.96 is risky due to overbought conditions. While the daily trend remains strong, the elevated RSI suggests the market is extended. A more prudent approach would be to wait for a pullback to a more favorable support level, like $94.30, or for confirmation of a bullish continuation above $95.31 resistance.
Is the ADX reading of 23.08 a sell signal for WTI right now?
An ADX reading of 23.08 indicates a moderately strong trend, not necessarily a sell signal on its own. It suggests there's directional momentum, but it's not yet overwhelmingly strong. When combined with other indicators like a bearish RSI on the 1-hour chart and conflicting Stochastic signals, it supports caution rather than an outright sell recommendation at this exact moment.
How will easing Strait of Hormuz tensions affect WTI prices this week?
Easing tensions around the Strait of Hormuz can reduce the geopolitical risk premium priced into WTI, potentially leading to price declines. If this leads to a confirmed break below key support levels like $94.02, we could see further downside. However, the overall market sentiment and broader geopolitical landscape will ultimately determine the extent of any price impact.
Technical Outlook Summary
| Indicator | Value | Signal | Interpretation |
|---|---|---|---|
| RSI (14) | 74.96 | Bearish (Overbought) | Daily RSI is in overbought territory, suggesting potential for a pullback. |
| MACD Histogram | +0.39 | Bullish | Positive momentum continues on the daily chart, though nearing a potential crossover. |
| Stochastic | K=53.24, D=53.28 | Bearish Crossover | Daily Stochastic shows a bearish crossover in overbought conditions. |
| ADX | 52.00 | Strong Trend | Very strong uptrend indicated on the daily chart. |
| Bollinger | Middle Band | Watch | Price is above the middle band, supporting the uptrend, but RSI warns of exhaustion. |
Track markets in real-time
AI-powered analysis, technical indicators and real-time price data.
Join Our Telegram Channel
Breaking market news, AI analysis and trading signals instantly.
Join Channel