ETHUSD Targets $2,177.63 Resistance: Is the Rally Sustainable?
ETHUSD surges 4.46% to $2,177.63 amid strong bullish momentum. Can it break through key resistance levels and sustain the upward trajectory?
ETHUSD is currently trading at $2,177.63, marking a significant 4.46% intraday increase. Bulls and bears are battling it out at a critical juncture, leaving traders wondering if this rally has legs or if a pullback is imminent. The cryptocurrency's performance is being closely watched as it approaches key resistance levels.
The Bullish Case for ETHUSD
The bullish case for ETHUSD centers around the strong upward momentum observed across multiple timeframes. On the 1-hour chart, the trend is strongly bullish, with the ADX at 38.79 indicating significant trend strength. The Stochastic oscillator shows a bullish signal at K=76.53 and D=79.85, suggesting that the upward momentum is likely to continue in the short term. The 4-hour chart further supports this view, with the ADX at 32.57 reinforcing the trend. The MACD histogram is positive, indicating continued bullish momentum. The bulls are in control, but can they maintain this pace?
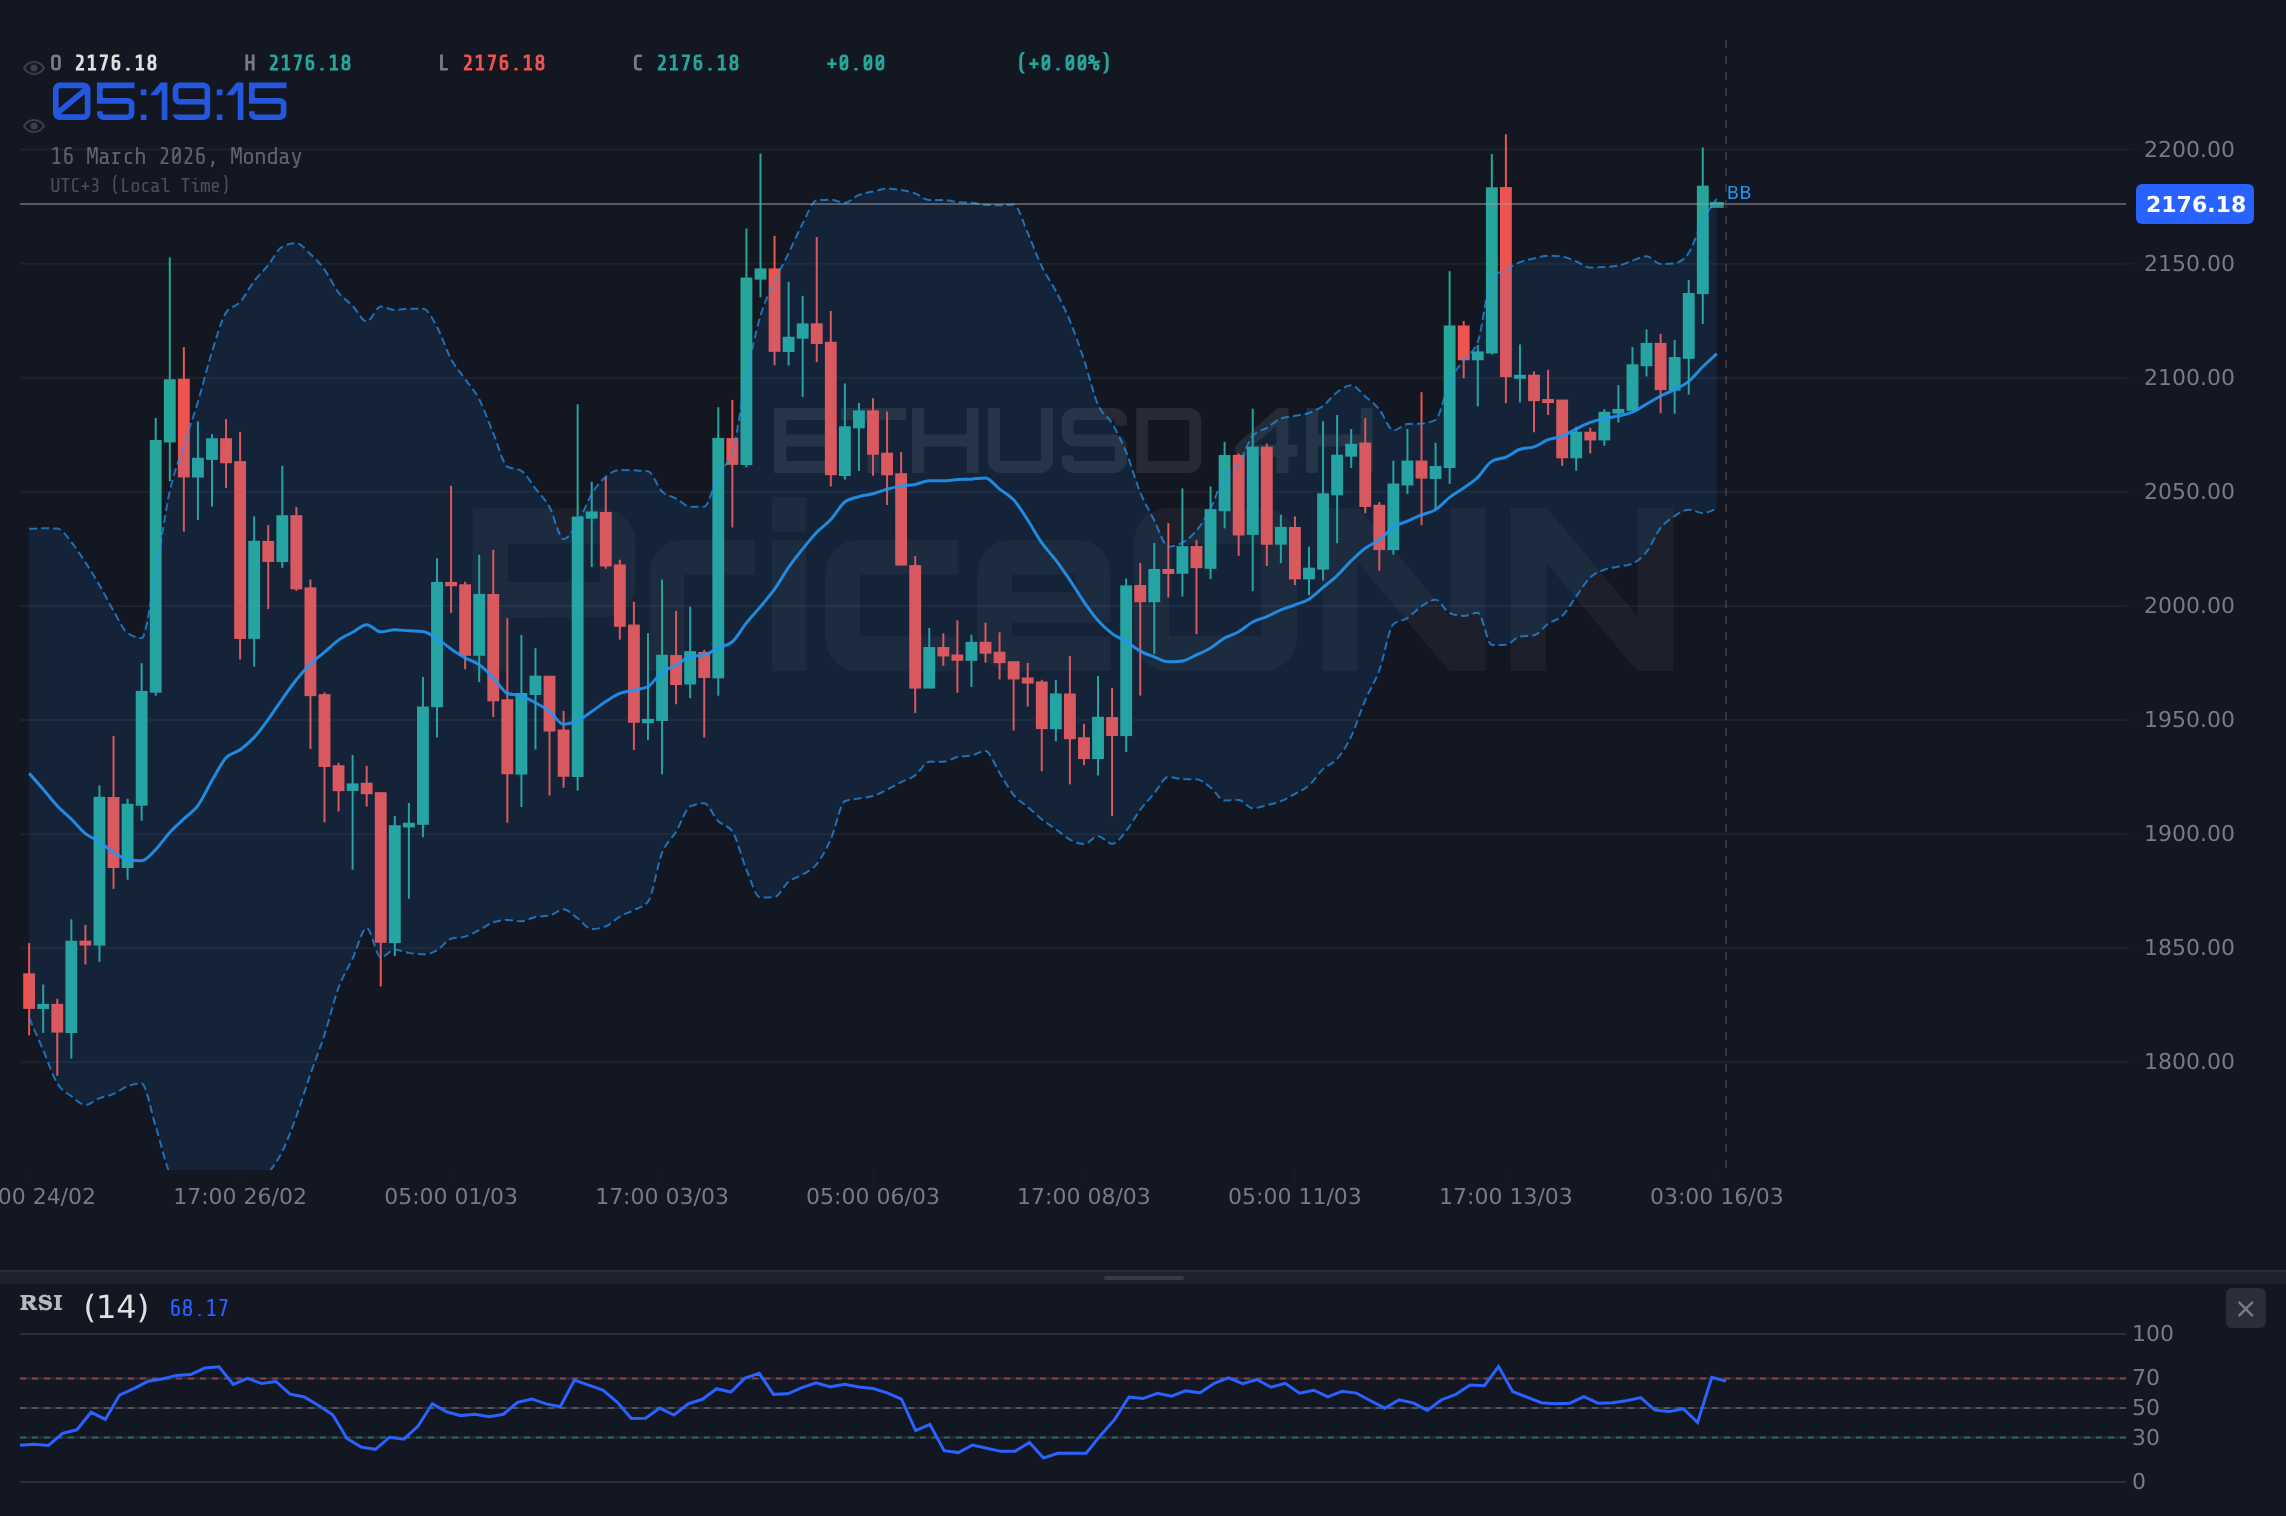
Furthermore, the daily chart shows the price trading above the middle Bollinger Band, indicating a bullish trend. The RSI stands at 56.71, leaving room for further upside before reaching overbought territory. Overall, technical indicators suggest that ETHUSD has a strong foundation for continued gains. A successful breach of $2,181.73 could pave the way for a test of $2,194.39.
Recent developments in the broader crypto market also support the bullish outlook for ETHUSD. Positive news flow regarding regulatory clarity and institutional adoption has boosted investor confidence. The CLARITY Act, though facing a tight deadline, aims to provide regulatory clarity for the crypto industry, which could attract more institutional investment into ETHUSD.
The Bearish Counter-Argument
Despite the bullish momentum, there are several factors that support a bearish counter-argument. The most immediate concern is the overbought condition indicated by the 1-hour RSI at 71.85. Historically, such high RSI readings have often preceded pullbacks as traders take profits. The Stochastic oscillator's potential crossover could signal weakening momentum. The bears are waiting for the slightest sign of weakness.
The 4-hour chart reveals that ETHUSD is trading near the upper Bollinger Band, which often acts as resistance. A failure to break above $2,181.73 could lead to a sharp reversal, with initial support at $2,159.63. A break below this level could trigger a deeper correction towards $2,150.19.
Moreover, the daily chart shows a potential for a double top formation, which is a bearish reversal pattern. If ETHUSD fails to sustain its current gains and closes below $2,159.63, this formation could be confirmed, leading to a more significant downside move. The SP500 is showing signs of weakness, currently trading at 6659.65. The DXY has been gaining strength, currently at 99.95. As the dollar index strengthens, ETHUSD faces downward pressure.
Technicals as the Tiebreaker
Let's dive deeper into the technical picture to determine which way ETHUSD is likely to break. On the 1-hour chart, the support levels are identified at 2159.63, 2150.19 and 2137.53. The resistance levels are identified at 2181.73, 2194.39 and 2203.83. The trend on the 1-hour is bullish. The RSI is at 71.85, which is overbought and a signal to sell. The MACD is showing positive momentum above the signal line. The stochastic is showing a signal to sell, with K=76.53 and D=79.85. The ADX is at 38.79, which indicates a strong trend. Taken together, the 1-hour chart is showing mixed signals.
On the 4-hour chart, the support levels are identified at 2105.3, 2073.9, and 2055.15. The resistance levels are identified at 2155.45, 2174.2, and 2205.6. The trend on the 4-hour is bullish. The RSI is at 66.65, which is neutral. The MACD is showing positive momentum above the signal line. The stochastic is showing a signal to buy, with K=85.03 and D=69.67. The ADX is at 32.57, which indicates a strong trend. Taken together, the 4-hour chart is showing a bullish signal.
The 1-day chart is showing the support levels at 2061.44, 2038.23 and 2017.23. The resistance levels are identified at 2105.65, 2126.65 and 2149.86. The trend is neutral. The RSI is at 56.71, which is neutral. The MACD is showing positive momentum above the signal line. The stochastic is showing a signal to buy, with K=71.32 and D=53.68. The ADX is at 23.56, which indicates a medium strength trend. Overall, the daily chart is showing a bullish signal.
The upcoming GBP economic data could introduce volatility. Investors should watch out for Friday's GBP data releases, as they could trigger significant market movements. With the ADX reading at 32.57, the trend is strong, but external factors could easily disrupt the current trajectory.
ETHUSD Trade Plan
Based on the technical analysis, a bullish trade setup with a 65% probability is outlined below:
ETHUSD breaks above the $2,181.73 resistance level, targeting the next resistance at $2,194.39. A successful breakout could lead to further gains towards $2,203.83.
ETHUSD fails to break above $2,181.73 and falls below the support at $2,159.63, targeting the next support at $2,150.19. A break below this level could lead to further losses towards $2,137.53.
Frequently Asked Questions: ETHUSD Analysis
What happens if ETHUSD breaks above $2,181.73 resistance?
If ETHUSD successfully breaks above the $2,181.73 resistance level, it could trigger a further rally towards the next resistance at $2,194.39. A sustained move above this level could open the door for a test of $2,203.83, potentially attracting more buyers into the market.
Should I buy ETHUSD at current levels of $2,177.63 given RSI at 71.85?
Given the RSI at 71.85 on the 1-hour chart, which indicates overbought conditions, it may be prudent to exercise caution before initiating new long positions at current levels of $2,177.63. Traders may consider waiting for a pullback towards support at $2,159.63 before entering long positions.
Is the MACD signal on the 4-hour chart a reliable indicator for ETHUSD?
The MACD on the 4-hour chart is showing positive momentum above the signal line, indicating a bullish trend for ETHUSD. This signal is further supported by the ADX reading of 32.57, suggesting that the trend is strong, making it a reliable indicator for potential bullish continuation.
How will the upcoming GBP data on Friday affect ETHUSD this week?
The upcoming GBP data on Friday could introduce volatility into the broader market, potentially impacting ETHUSD. Given the strong bullish trend, positive GBP data could reinforce the upward momentum, while negative data could trigger a pullback towards support levels.
Technical Outlook Summary
| Indicator | Value | Signal |
|---|---|---|
| RSI (14) | 71.85 | Overbought |
| MACD Histogram | Positive | Bullish |
| Stochastic | K=76.53, D=79.85 | Sell |
| ADX | 38.79 | Strong Trend |
| Bollinger | Upper Band | Watch |
Key Levels
Support Levels
Resistance Levels
Track markets in real-time
AI-powered analysis, technical indicators and real-time price data.
Join Our Telegram Channel
Breaking market news, AI analysis and trading signals instantly.
Join Channel