XAGUSD Tumbles to $80.68: Key Support Levels in Focus
XAGUSD plunges to $80.68 amid broad market sell-off; traders eye critical support levels for potential bounce.
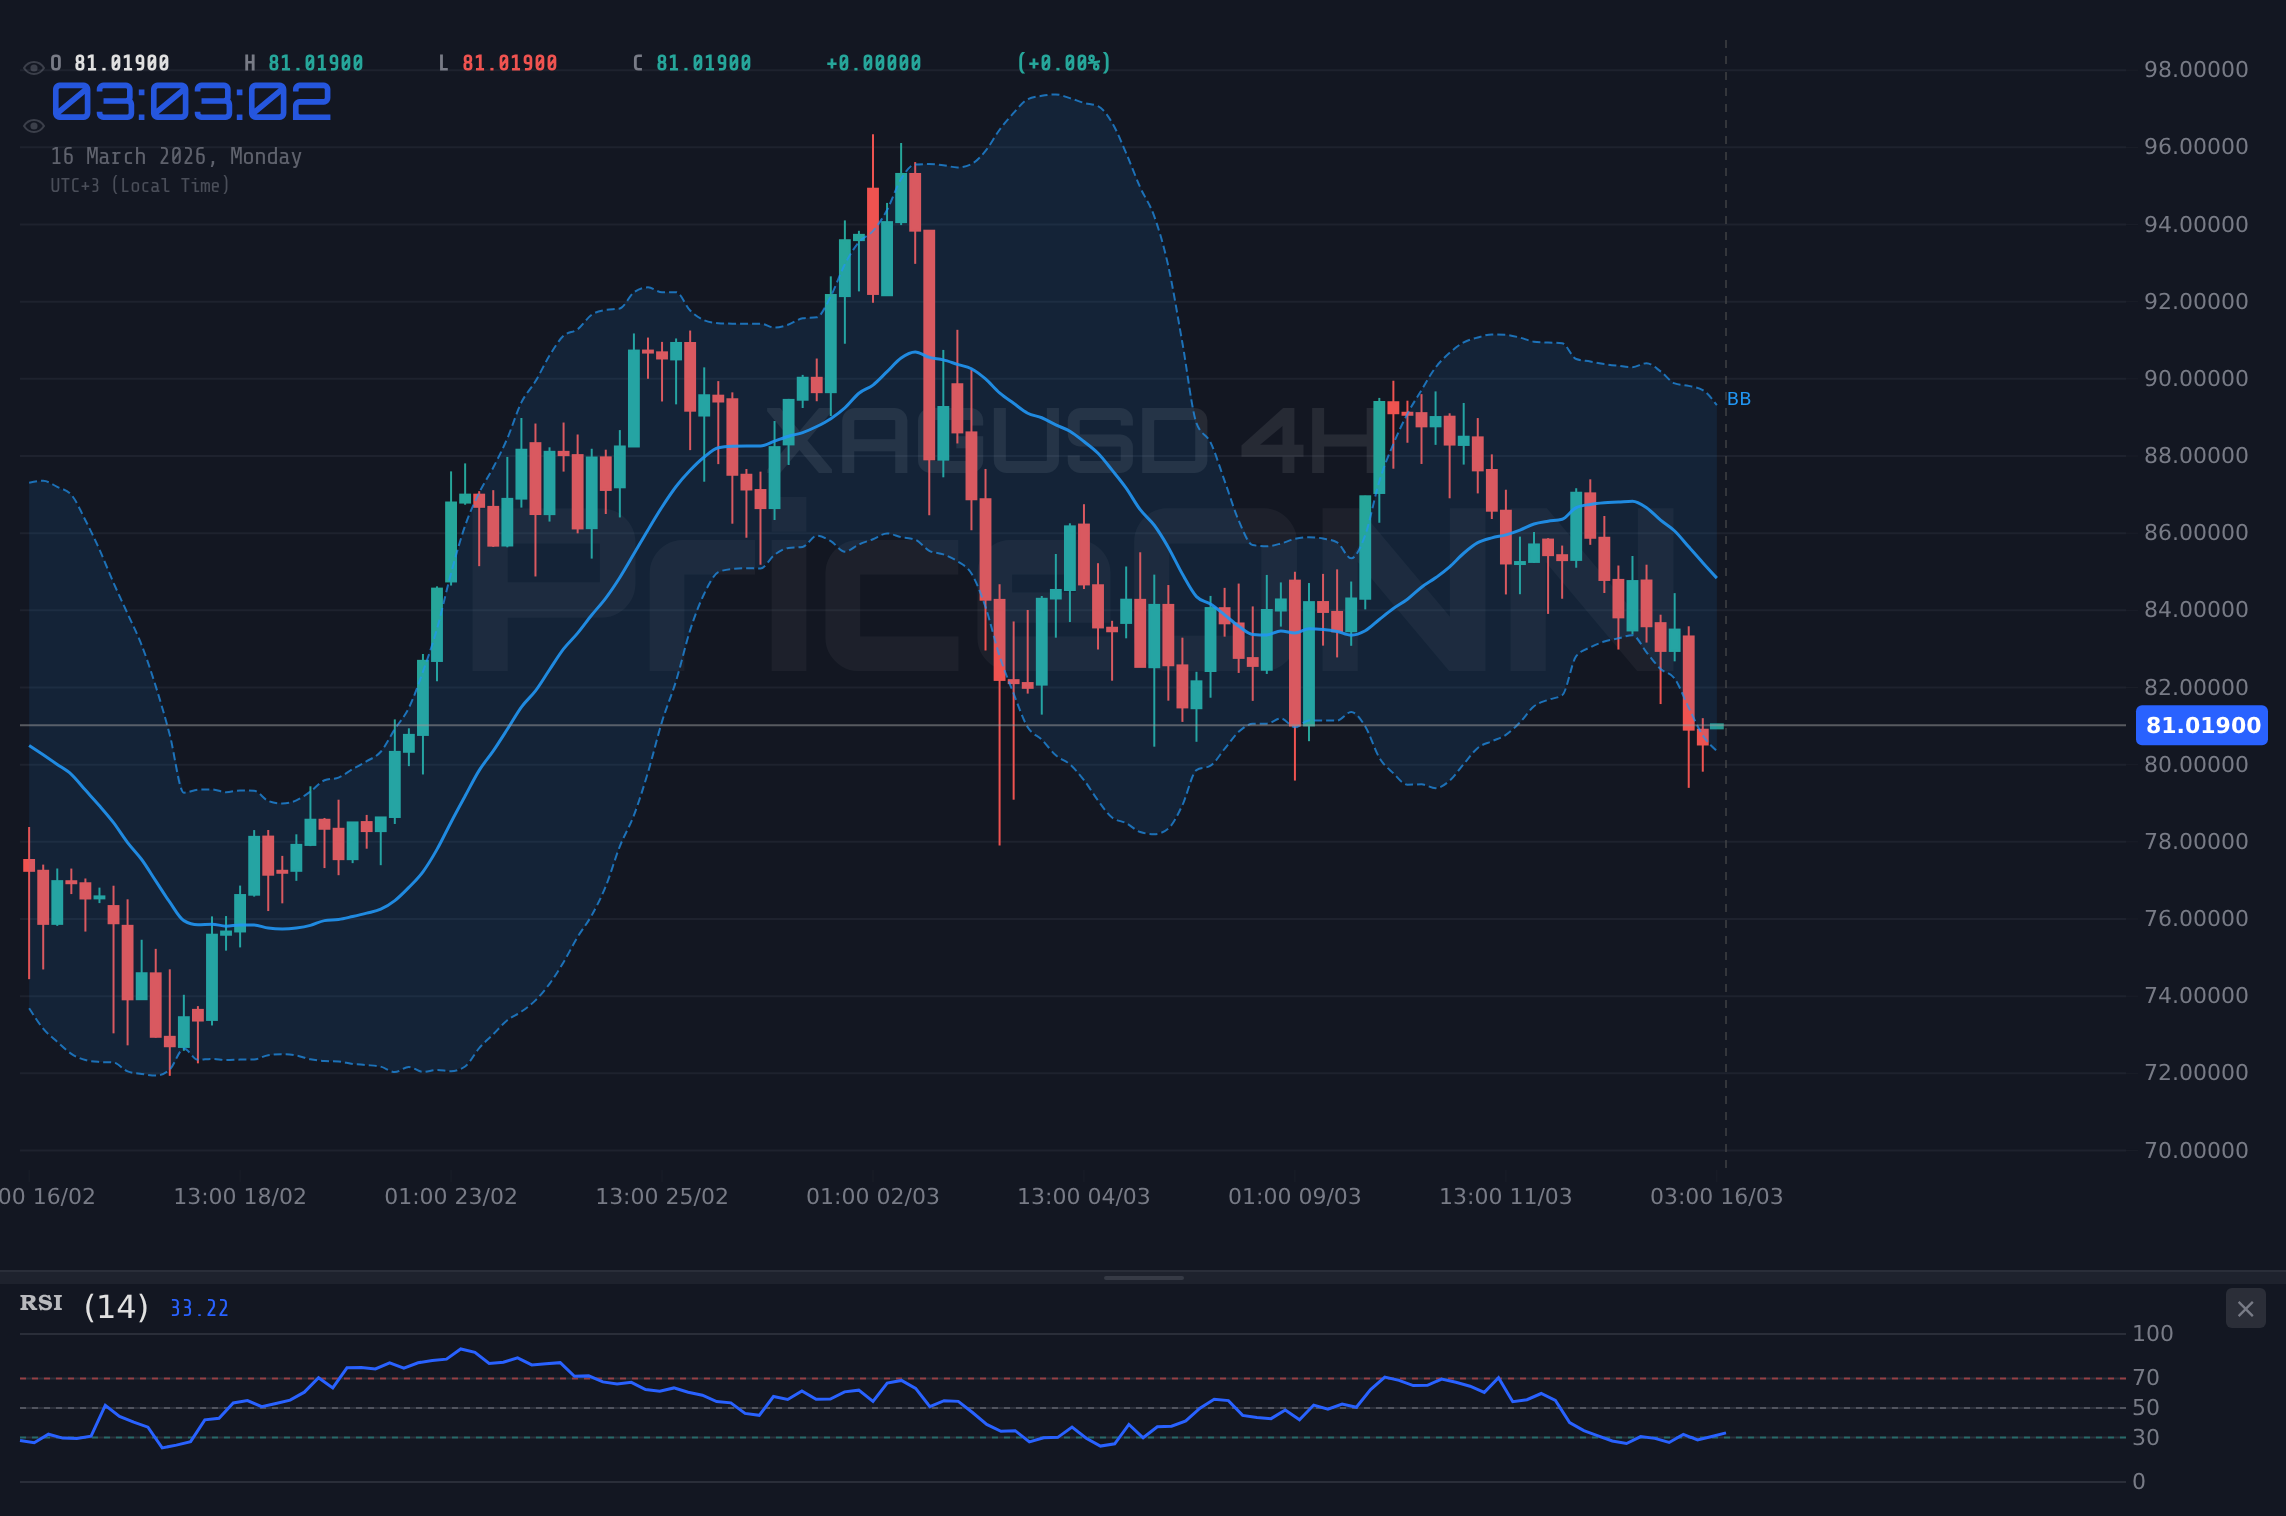
XAGUSD is currently trading at $80.68, a significant drop that has put key support levels in the spotlight. The precious metal faces headwinds from a strengthening dollar and risk-off sentiment in the broader market. The key question now is whether the current level will hold, or if further declines are on the horizon.
- XAGUSD at $80.68 is testing critical support after a 3.75% daily decline.
- Immediate support lies at $79.7, a break below which could trigger further losses.
- A strong dollar, with DXY at 100.01, is weighing on silver prices.
- Watch upcoming economic data for potential catalysts that could reverse the current trend.
Why $79.7 is the Line in the Sand
The immediate support level to watch is $79.7, as indicated by the 1H timeframe data. This level has acted as a floor in the past, and a break below it could signal further downside momentum. A decisive close below $79.7 could open the door for a test of the next support level at $78.96. Failure to hold this level could see XAGUSD test $78.53. The hourly RSI is at 36.18, indicating that the market is not yet oversold, suggesting further room for decline. The ADX, at 42.28, points to a strong downtrend, reinforcing the bearish outlook.
A break below $79.7 could trigger a cascade of stop-loss orders, accelerating the decline. Traders should exercise caution and manage their risk accordingly.
Click to expand
The Bull's Roadmap: A Reversal Scenario
For the bulls to regain control, XAGUSD needs to establish a foothold above the immediate resistance at $80.88. If price action can convincingly break above this level, it could pave the way for a test of $81.31. Sustained momentum above $81.31 could then target the $82.05 resistance level. The bullish scenario hinges on a weakening dollar and a return of risk appetite to the market. However, given the current technical picture, this scenario appears less likely in the short term.
Where Bears Take Control: The Downside Scenario
The bearish scenario gains traction if XAGUSD fails to hold the $79.7 support. A decisive break below this level could trigger a swift move towards the next support at $78.96. If selling pressure intensifies, the $78.53 level could be tested. The 4H chart reinforces this bearish view, with the RSI at 34.03 and the ADX at 30.67, both indicating a continuation of the downtrend. The Stochastic oscillator, with %K at 22.66 and %D at 24.72, also suggests further downside potential.
The Waiting Game: Consolidation and Range Trading
A neutral scenario would involve XAGUSD consolidating within a range between the $79.7 support and the $80.88 resistance. This could occur if market participants are awaiting further catalysts before committing to a directional move. In this scenario, range-bound traders could look to buy near the support and sell near the resistance. However, it's important to note that the overall technical picture favors the bears, making this scenario less probable than the downside scenario. The 1D ADX at 15.12 confirms that the overall trend is weak, making a strong breakout less likely in the short term.
Assessing the Probabilities: What's Most Likely?
Given the current technical and fundamental backdrop, the bearish scenario appears most likely. The strong dollar, coupled with the weak technical indicators, suggests that XAGUSD is likely to test lower support levels in the coming days. While a bullish reversal is possible, it would require a significant shift in market sentiment. A consolidation scenario is also possible, but less probable than the downside scenario.
| Scenario | Trigger | Target | Probability |
|---|---|---|---|
| Bullish | Break above $80.88 | $82.05 | 30% |
| Bearish | Break below $79.7 | $78.53 | 50% |
| Neutral | Consolidation between $79.7 and $80.88 | Range-bound trading | 20% |
What I'm Watching This Week
I'm closely monitoring the $79.7 support level. A decisive break below this level would confirm the bearish outlook and open the door for further declines. I'm also watching the DXY (Dollar Index), currently at 100.01. Further strength in the dollar would likely put additional pressure on XAGUSD. Lastly, the upcoming economic data releases could act as catalysts for a directional move. The GBP High Impact News on 2026-03-13 (Friday) could inject volatility into the market.
If XAGUSD breaks above the $80.88 resistance, it could target $81.31. Sustained momentum above $81.31 could then target the $82.05 resistance level. This scenario requires a weakening dollar and a return of risk appetite.
If XAGUSD fails to hold the $79.7 support, it could trigger a move towards $78.96. Continued selling pressure could then test the $78.53 level. This scenario is supported by the strong dollar and weak technical indicators.
Key Levels
Support Levels
Resistance Levels
Technical Outlook Summary
| Indicator | Value | Signal |
|---|---|---|
| RSI (14) - 1H | 36.18 | Neutral |
| MACD - 1H | Negative | Bearish |
| Stochastic - 1H | K=25.45, D=22.74 | Potential Reversal |
| ADX - 1H | 42.28 | Strong Downtrend |
| Bollinger Bands - 1H | Below Middle Band | Bearish |
Frequently Asked Questions: XAGUSD Analysis
What happens if XAGUSD breaks below $79.7 support?
A break below the $79.7 support level could trigger a swift move towards the next support level at $78.96. Increased selling pressure may test the $78.53 level, leading to further downside.
Should I sell XAGUSD at current levels of $80.68 given the ADX at 42.28?
With the ADX at 42.28 indicating a strong downtrend, selling XAGUSD at $80.68 could be considered. However, traders should manage risk and set stop-loss orders to protect against unexpected reversals, particularly given high volatility.
Is the Stochastic at K=25.45, D=22.74 a buy signal for XAGUSD right now?
While the Stochastic oscillator indicates a potential bullish reversal with %K > %D, it should not be considered in isolation. Traders should look for confluence with other indicators and price action to confirm the signal before entering a long position.
How will the GBP High Impact News on 2026-03-13 affect XAGUSD this week?
The GBP High Impact News on 2026-03-13 could indirectly affect XAGUSD by influencing the strength of the US dollar. A weaker dollar could provide some support for silver prices, while a stronger dollar could exert further downward pressure.
Track markets in real-time
Empower your investment decisions with AI-powered analysis, technical indicators and real-time price data.
Join Our Telegram Channel
Get breaking market news, AI analysis and trading signals delivered instantly to your Telegram.
Join Channel