EURUSD Tumbles to $1.14: Is a Reversal on the Horizon?
EURUSD slides to $1.14 amid DXY strength. Key levels to watch as oversold conditions emerge and a potential rebound forms.
EURUSD is currently trading at $1.14, a significant dip that has caught the attention of traders worldwide. Is this a temporary setback or the beginning of a deeper correction? The technical picture is complex, with oversold conditions suggesting a potential bounce, while a strengthening dollar index (DXY) continues to exert downward pressure.
- EURUSD reached $1.14, testing key support levels amid a strong downtrend.
- RSI at 23.59 signals oversold conditions on the daily timeframe, potentially hinting at a reversal.
- Strong dollar index (DXY) at 99.96 continues to weigh on EURUSD, creating selling pressure.
- A break above the 1.14369 resistance on the 1H chart could signal a short-term bullish correction.
Having tracked EURUSD through the volatile rate cycles of recent years, I can say that current price action is reminiscent of periods where macroeconomic forces clash with technical extremes. The blend of fundamental pressures and technical signals makes this a particularly interesting moment for the pair. The dollar index (DXY) is currently at 99.96, continuing its strong upward trajectory. This DXY strength is a primary driver of EURUSD's recent weakness. Considering that the Eurozone economic data has been mixed, the strong dollar narrative is holding firm, putting EURUSD under pressure.
Examining the 1-hour chart, EURUSD is currently trading below its middle Bollinger Band, which suggests a bearish trend. The RSI(14) is at 34.3, indicating that while the pair is not yet in oversold territory on this shorter timeframe, the selling pressure is significant. However, the Stochastic indicator shows a potential bullish crossover, with %K at 21.84 and %D at 12.76, signaling a possible short-term bounce. A decisive break above the 1.14369 resistance level on the 1-hour chart could confirm this bullish reversal.
Click to expand
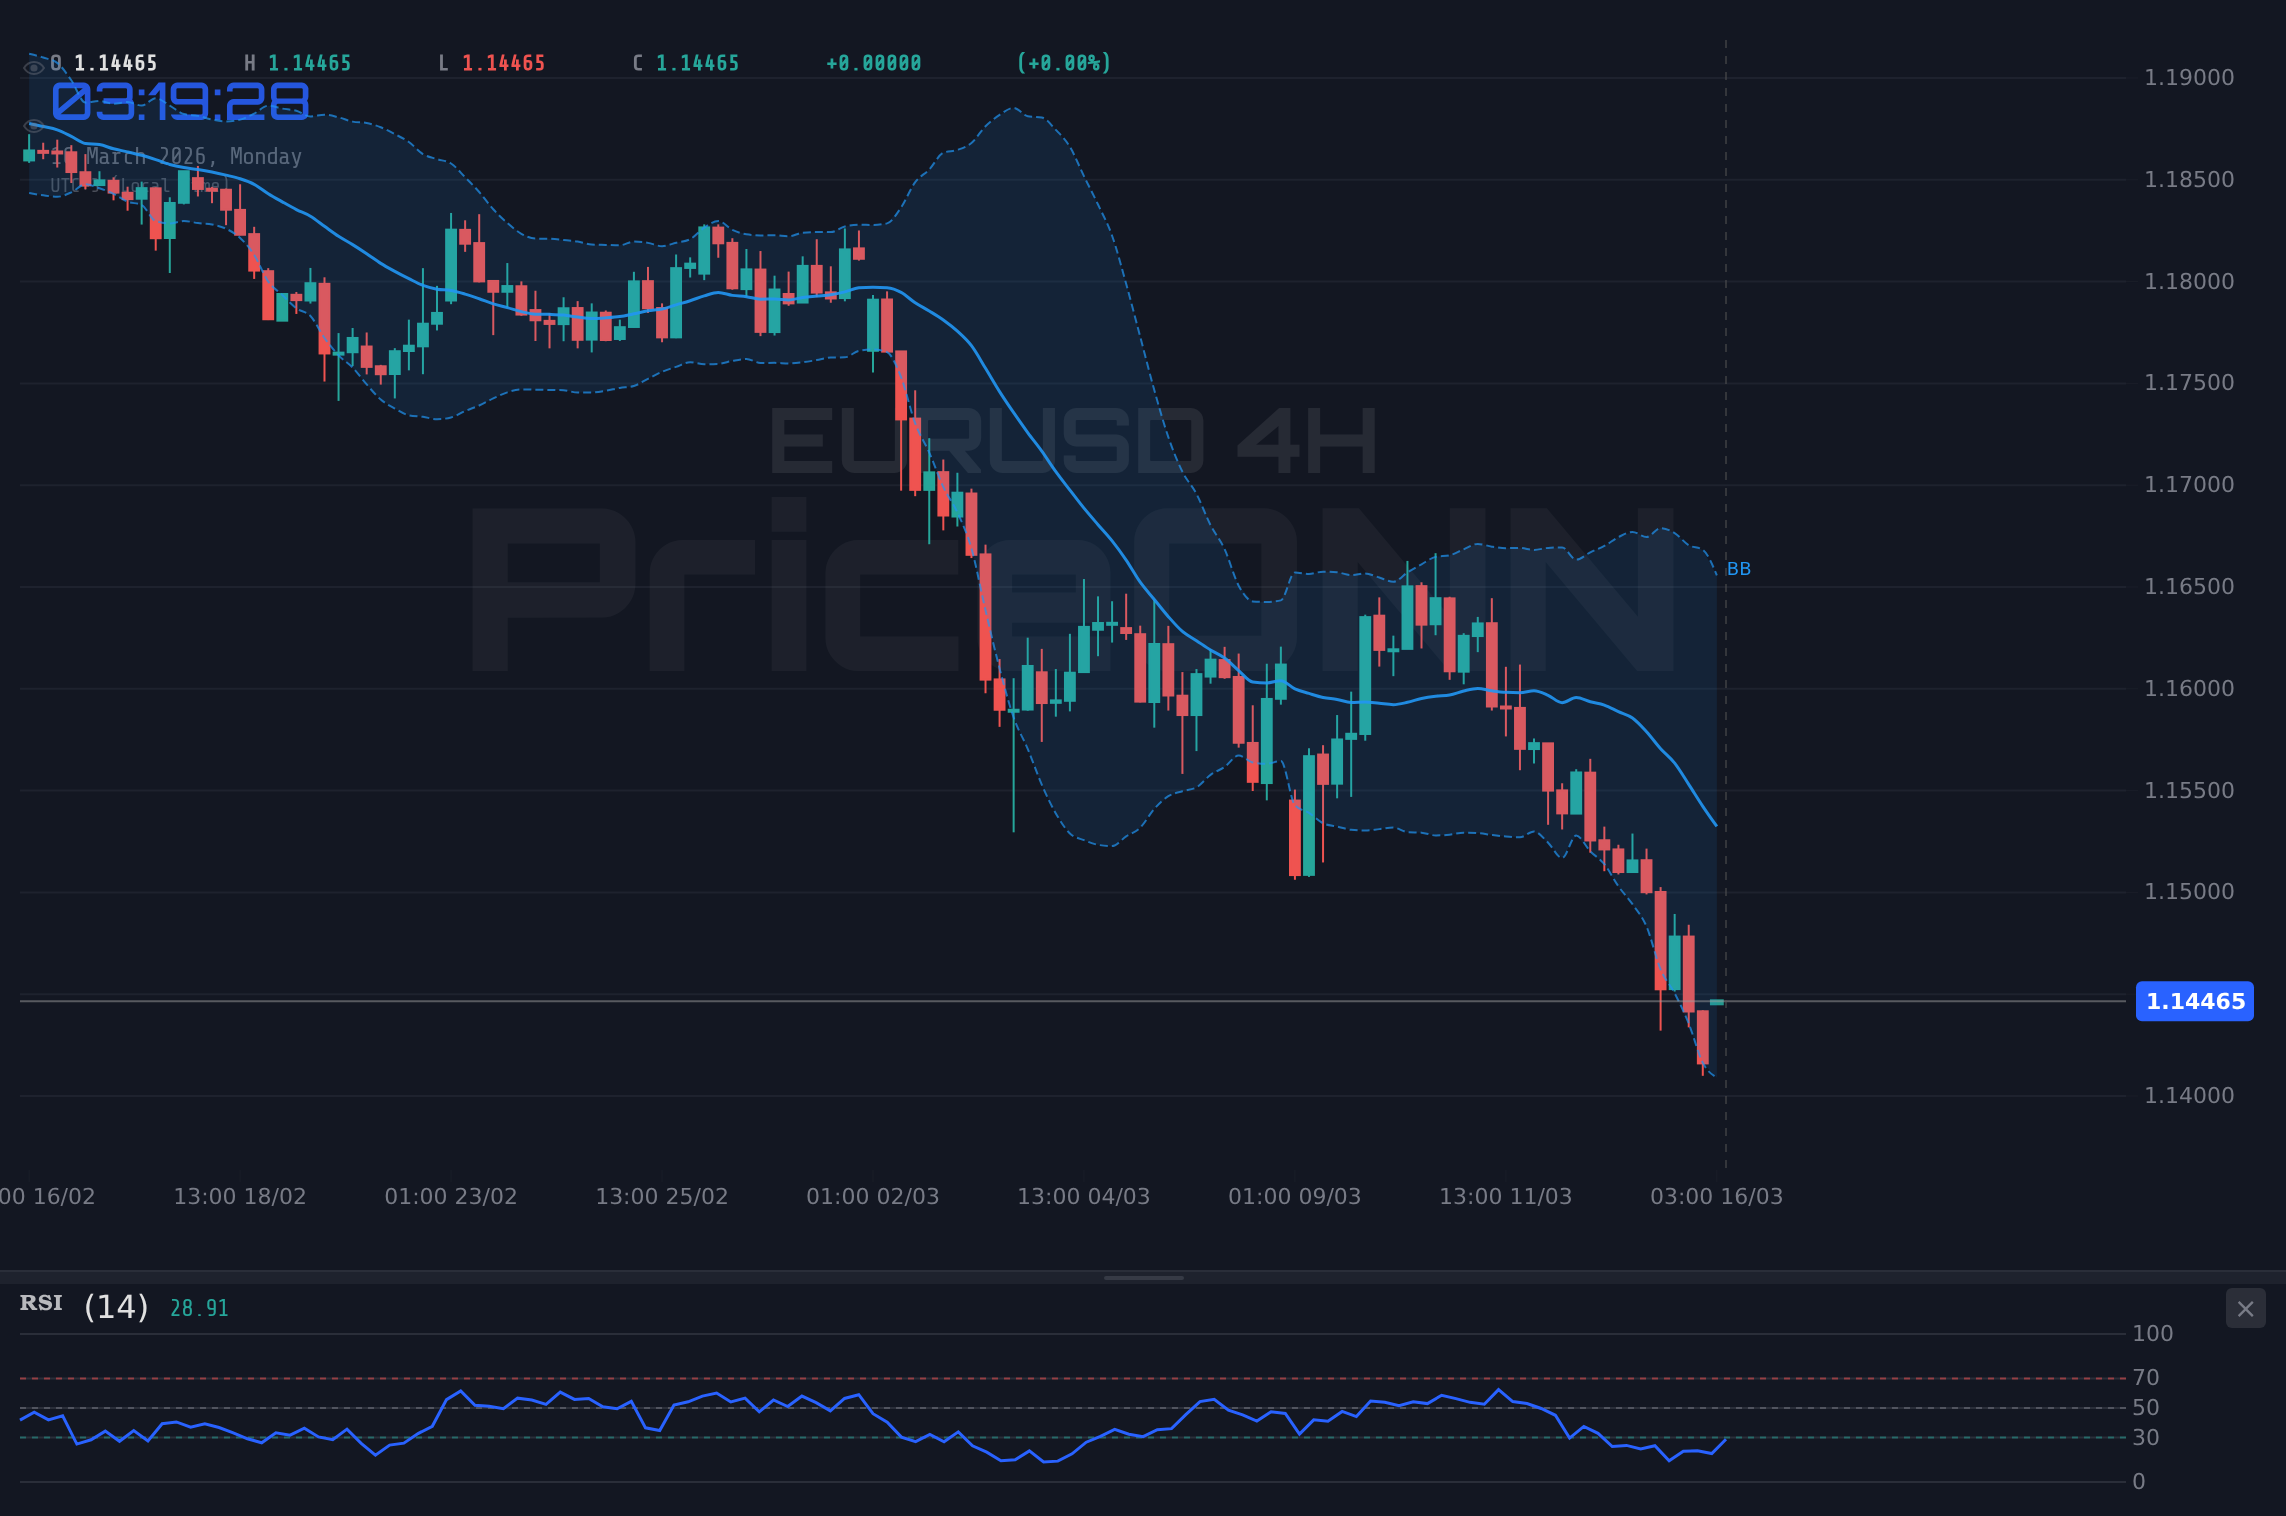
Stepping back to the 4-hour timeframe, the bearish picture becomes clearer. The ADX is at 34.34, confirming a strong downtrend. Notice that the RSI(14) is at 28.51, dipping into oversold territory and indicating that the selling pressure is intense. The MACD histogram displays negative momentum, further supporting the bearish outlook. However, with the Stochastic in the oversold zone (%K at 15.19, %D at 11.09), a potential mean reversion trade could be setting up. Traders should watch for a break above the 1.14725 resistance, which could trigger a more substantial correction.
The daily chart provides a broader perspective. The RSI(14) is at 23.59, deeply oversold, suggesting that the bears may be overextended. The MACD is showing negative momentum, but the Stochastic oscillator is signaling a potential bottom, with %K at 8.12 and %D at 25.05. Key support levels to watch are 1.14237, 1.14663 and 1.14881. A break below these levels could lead to further declines, while a sustained move above the 1.15525 resistance would signal a more significant bullish reversal.
The confluence of oversold conditions and strong downtrends across multiple timeframes presents a complex trading scenario. Scalpers might look for short-term bounces, while swing traders may wait for a confirmed reversal before entering long positions. Long-term investors might see this as an opportunity to accumulate EURUSD at discounted prices, provided they have a high tolerance for risk and a belief in the long-term strength of the Eurozone economy.
Given the technical picture, the economic calendar also plays a crucial role. Traders are anticipating key data releases in the coming days, including upcoming GDP figures. Any positive surprises in these data releases could trigger a bullish reaction in EURUSD, while disappointing results could exacerbate the selling pressure. This Friday, the GBP is set to release, previous at 0.1.
Amid the current market environment, there are fresh concerns about Saudi Arabia scaling back its ambitious NEOM project due to rising costs, according to recent news reports. While this may seem unrelated, any shifts in global investment priorities can indirectly impact currency valuations, especially if they alter risk sentiment. Furthermore, the oil price spike threatens gold miners. This shows that energy and commodity dynamics are interconnected and can influence broader market trends.
With all these factors considered, the key level to watch is 1.142. If EURUSD can sustain a move above this level, it could trigger a short-covering rally towards the 1.147 resistance. However, failure to hold above 1.142 could lead to a retest of the 1.14 support, and potentially further declines towards the 1.137 level. Traders should also keep a close eye on the DXY, as further dollar strength will likely amplify the downward pressure on EURUSD.
If EURUSD breaks above 1.14369 resistance, it could trigger a short-covering rally towards 1.14725 and potentially 1.15035. Confirmation would require a sustained move above the 50-day moving average and a weakening of the dollar index.
If EURUSD fails to hold above 1.142, it could lead to a retest of the 1.14 support. A break below this level could trigger further declines towards 1.13717 and potentially lower, driven by continued dollar strength and negative Eurozone economic data.
Frequently Asked Questions: EURUSD Analysis
What happens if EURUSD breaks above 1.14369 resistance?
A break above the 1.14369 resistance level could trigger a short-covering rally, potentially pushing EURUSD towards 1.14725 and even 1.15035. This bullish scenario would require confirmation from a weakening dollar index and positive Eurozone economic data.
Should I buy EURUSD at current levels of $1.14 given the oversold RSI?
While the oversold RSI on the daily chart suggests a potential bounce, it's prudent to wait for confirmation before entering long positions. A sustained move above 1.14369 resistance, combined with a bullish crossover on the Stochastic oscillator, could provide a more reliable entry signal.
Is RSI at 23.59 a sell signal for EURUSD right now?
An RSI of 23.59 indicates deeply oversold conditions, which typically suggests that the selling pressure is exhausted and a reversal is possible. However, it's important to note that oversold conditions can persist for extended periods during strong downtrends, so additional confirmation is needed before initiating a short position.
How will the upcoming GBP data affect EURUSD this week?
The upcoming GBP data could indirectly influence EURUSD, as any significant deviation from expectations could trigger broader market volatility and impact risk sentiment. A strong GBP data could weaken the DXY, providing some relief for EURUSD, while disappointing data could further strengthen the dollar and amplify the downward pressure on the pair.
Technical Outlook Summary
| Indicator | Value | Signal |
|---|---|---|
| RSI (14) | 23.59 | Oversold |
| MACD Histogram | Negative | Bearish |
| Stochastic | K=8.12, D=25.05 | Potential Bottom |
| ADX | 34.34 | Strong Downtrend |
| Bollinger | Lower Band | Watch |
Key Levels
Support Levels
Resistance Levels
Track markets in real-time
AI-powered analysis, technical indicators and real-time price data.
Join Our Telegram Channel
Breaking market news, AI analysis and trading signals instantly.
Join Channel