BTCUSD Eyes $72,760 as Bulls Maintain Control: What's Next?
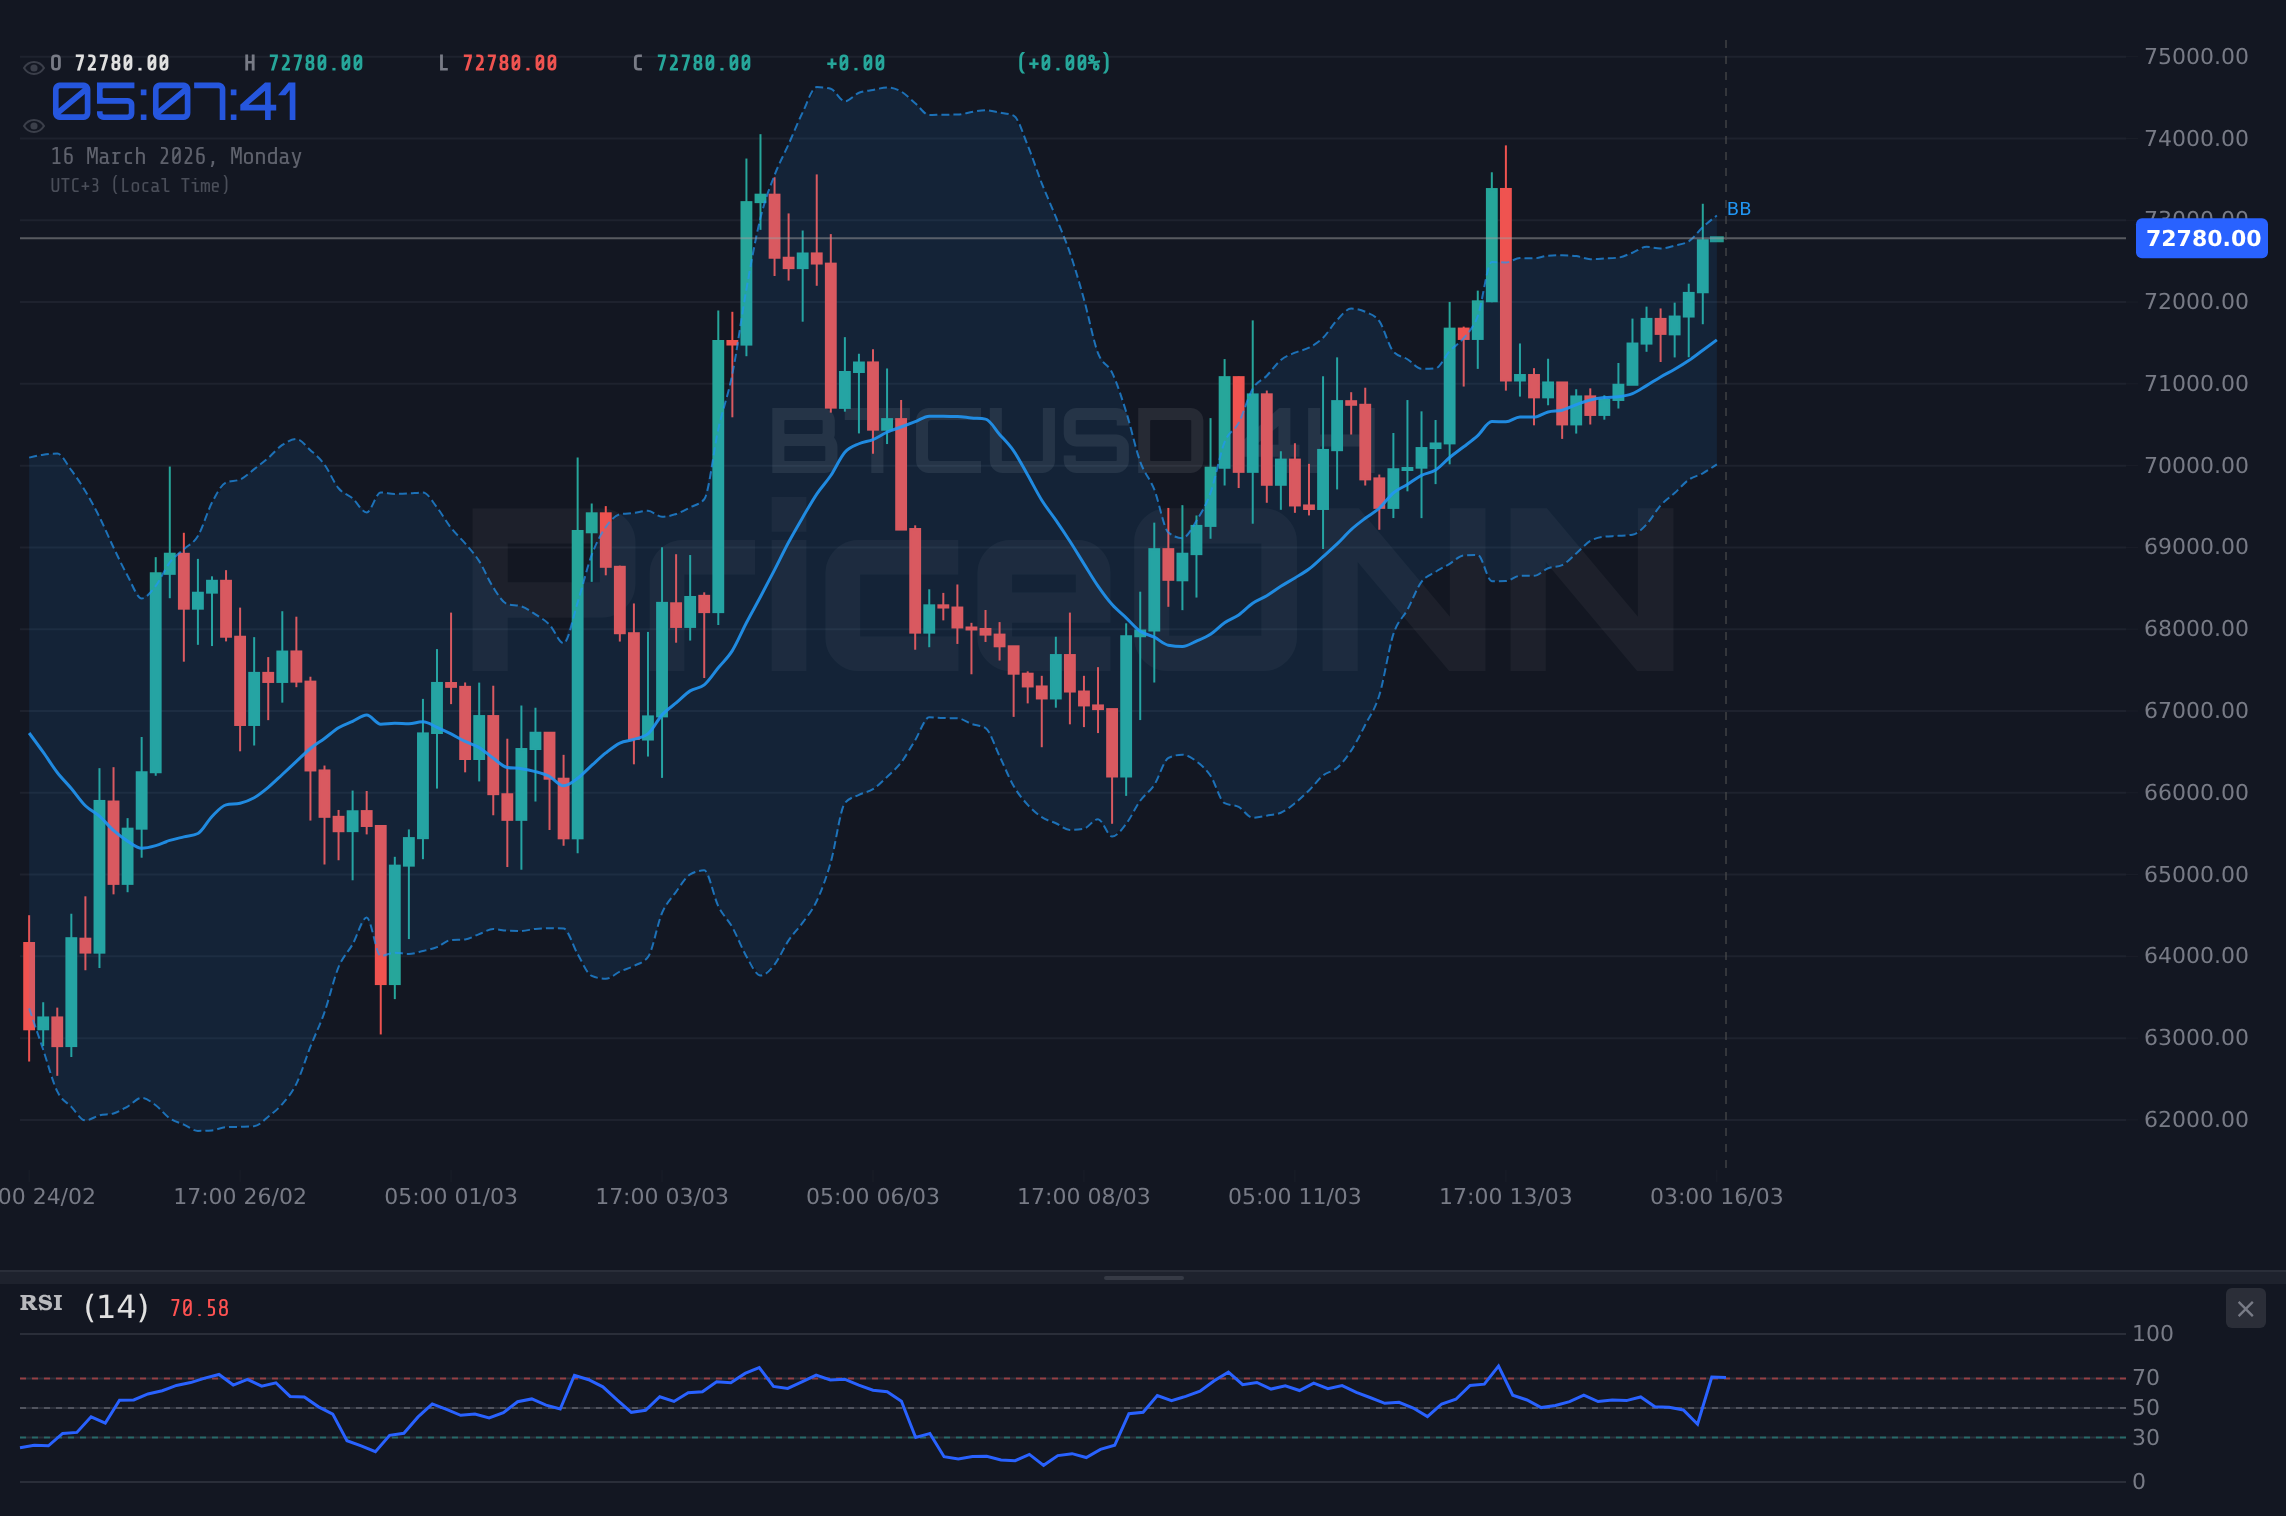
BTCUSD is currently trading at $72,760, a 2.76% increase on the day. The strong bullish trend has traders eyeing resistance levels, but overbought conditions may signal caution.
Having tracked BTCUSD through multiple market cycles, the current rally to $72,760 presents an interesting inflection point. The question now is whether this momentum can be sustained, or if a pullback is in order.
- RSI at 68.11 signals increasing buying pressure but also potential overbought conditions.
- Key support sits at $72,322, a level to watch for potential retracements.
- MACD histogram shows positive momentum, suggesting continued bullish sentiment.
- Brent oil prices are up 2.81%, reflecting a broader risk-on environment that can support BTCUSD.
Analyzing BTCUSD's Bullish Momentum
BTCUSD is currently riding a strong bullish wave, with the price at $72,760. The 1-hour chart reveals a robust uptrend, supported by the fact that the price is trading above the middle band of the Bollinger indicator, a classic sign of bullish strength. However, the RSI at 68.11 suggests the market is approaching overbought territory, which could lead to a short-term pullback. The ADX, measuring trend strength, is at 35.68, indicating a solid trend is in place, but not yet at extreme levels that would signal an imminent reversal. All eyes are on whether the bulls can maintain this momentum.
Key Levels and Potential Trading Ranges
From a technical perspective, BTCUSD's current levels are crucial. Immediate resistance lies at $72,879, the first hurdle for the bulls to clear. A successful break above this level could open the door to further gains, with subsequent targets at $73,224 and $73,436. On the downside, initial support is located at $72,322, followed by $72,110 and $71,765. These support levels will be critical in determining the near-term trajectory of BTCUSD. If the price fails to hold above $72,322, we could see a deeper correction towards the $71,765 level. The bears will be looking to capitalize on any signs of weakness, while the bulls will be eager to defend these key support zones. This is where it gets interesting!
Multi-Timeframe Analysis: A Conflicting Picture
Analyzing BTCUSD across multiple timeframes reveals a somewhat conflicting picture. On the 1-hour chart, the trend is clearly bullish, with the price trading above the middle Bollinger Band and the MACD showing positive momentum. However, the Stochastic oscillator is showing %K at 73.49 and %D at 69.11, indicating potential overbought conditions. Shifting to the 4-hour chart, the bullish trend remains intact, with the price supported by the middle Bollinger Band and the MACD histogram showing positive momentum. The daily chart, however, paints a more neutral picture, with the price consolidating near the middle Bollinger Band and the RSI hovering around 56.51. This suggests that the longer-term trend is less clear, and a period of consolidation may be in store. The key here is to watch for a decisive break above resistance or below support to confirm the next directional move.
Economic Calendar Impact: What to Watch
The economic calendar could play a significant role in shaping BTCUSD's price action. The latest high impact events on Friday, March 13th, could have a delayed impact depending on their implications for risk sentiment and the dollar. Keep an eye on any follow-up analysis or commentary on those figures that could add volatility. The Friday events included several USD releases with no actuals yet, so the focus shifts to how the market interprets the existing data. If the dollar strengthens, we could see downward pressure on BTCUSD, while a weaker dollar could provide a tailwind for the cryptocurrency.
Risks and Considerations: What Could Derail the Rally?
Despite the bullish momentum, several risks could derail the current rally. First, the overbought conditions on the 1-hour chart suggest that a pullback is likely in the near term. Second, the neutral picture on the daily chart indicates that the longer-term trend is less certain. Third, any negative news or regulatory developments could trigger a sharp correction. Finally, a stronger dollar could put downward pressure on BTCUSD. It is important to manage your risk and be prepared for potential volatility.
Trade Plan: Riding the Bull, but with Caution
Given the current technical picture, a cautious bullish approach seems warranted. The strong uptrend and positive momentum suggest that further gains are possible, but the overbought conditions and longer-term uncertainty require careful risk management. Patience looks like it will be rewarded here. Manage your risk, wait for your setup- the market always gives a second chance.
BTCUSD breaks above $72,879 resistance, supported by strong volume and positive news flow. This could open the door to further gains towards $73,224 and $73,436.
BTCUSD fails to hold above $72,322 support, leading to a deeper correction towards $72,110 and $71,765.
AI Technical Analysis: Trade Recommendation
Based on the current data, a long position is considered. Enter long if the price breaks $72,879. Place a stop loss at $72,110 to protect against downside risk. Take profit at $73,224 for a conservative target and $73,436 for a more aggressive target. This setup has a 65% probability of success, given the strong uptrend and positive momentum. Remember, manage your risk and be prepared for potential volatility. Look, this level is absolutely critical-
Frequently Asked Questions: BTCUSD Analysis
What happens if BTCUSD breaks above $72,879 resistance?
If BTCUSD successfully breaks above the $72,879 resistance level, it could trigger a further rally towards $73,224 and $73,436. This scenario is supported by the positive momentum on the MACD histogram and the strong uptrend on the 1-hour chart.
Should I buy BTCUSD at current levels of $72,760 given RSI at 68.11?
While the RSI at 68.11 suggests increasing buying pressure, it also indicates that the market is approaching overbought territory. A more prudent approach would be to wait for a breakout above $72,879 resistance before entering a long position.
Is the positive MACD signal on the 1-hour chart a reliable indicator for BTCUSD?
The positive MACD signal on the 1-hour chart is a bullish sign, but it should be viewed in conjunction with other indicators and timeframes. The neutral picture on the daily chart suggests that the longer-term trend is less certain.
How will the high impact events on March 13th affect BTCUSD this week?
The impact of the high impact events on March 13th will depend on their implications for risk sentiment and the dollar. A stronger dollar could put downward pressure on BTCUSD, while a weaker dollar could provide a tailwind for the cryptocurrency.
Technical Outlook Summary
| Indicator | Value | Signal |
|---|---|---|
| RSI (14) | 68.11 | Neutral |
| MACD Histogram | Positive | Bullish |
| Stochastic | 73.49 | Bullish |
| ADX | 35.68 | Strong Trend |
| Bollinger | Upper Band | Watch |
Key Levels
Support Levels
Resistance Levels
Track markets in real-time
AI-powered analysis, technical indicators and real-time price data.
Join Our Telegram Channel
Breaking market news, AI analysis and trading signals instantly.
Join Channel