AUDUSD Tests Resistance at $0.70089 Amid Middle East Tensions
AUDUSD hovers around $0.70089 as Middle East tensions escalate, impacting risk appetite and potentially influencing safe-haven flows.
Now this is where it gets interesting! The Australian Dollar against the US Dollar (AUDUSD) is currently dancing around the critical $0.70089 mark, and the charts are telling a compelling story. We're seeing a tug-of-war between the immediate technical signals and the broader geopolitical undercurrents. As traders, we need to dissect this intricate picture to understand where the smart money might be heading.
- AUDUSD is trading at $0.70089, with the 1-Day RSI at 47.39, signaling a neutral but slightly bearish lean.
- Critical resistance looms at $0.70149, while support is holding at $0.70017 on the 1-hour chart.
- Geopolitical tensions in the Middle East are increasing, potentially boosting safe-haven demand for the US Dollar.
- The ADX reading of 24.8 on the daily chart suggests a weak trend, indicating potential for range-bound trading or a breakout.
The AUDUSD pair is currently navigating a complex landscape. On the surface, the 1-hour chart presents a mixed bag: the trend is neutral with 50% strength, but the ADX at 39.53 indicates a strong downward trend on that timeframe, creating a short-term conflict. However, the overall picture across multiple timeframes paints a more consistent, albeit challenging, scenario for the Aussie. The daily chart shows a neutral trend with 50% strength and an ADX of 24.8, suggesting that a strong directional move might be building, but the market hasn't committed yet. This is precisely the kind of environment where careful analysis of price action and underlying drivers becomes paramount.
Let's dive into the technicals. On the 1-hour chart, AUDUSD is currently priced at $0.70089. The RSI(14) is sitting at 40.89, indicating a neutral but leaning towards bearish sentiment, suggesting that the bulls might be losing some steam. The MACD indicator is positive, with its signal line above, hinting at potential upward momentum, but this is juxtaposed by the Bollinger Bands which are above the middle band, suggesting an upward trend on this shorter timeframe. However, the Stochastic indicator is flashing a strong buy signal (%K at 78.19, %D at 48.32), indicating it's entering overbought territory. This conflict between the RSI and Stochastic is a classic sign of indecision or a potential turning point.
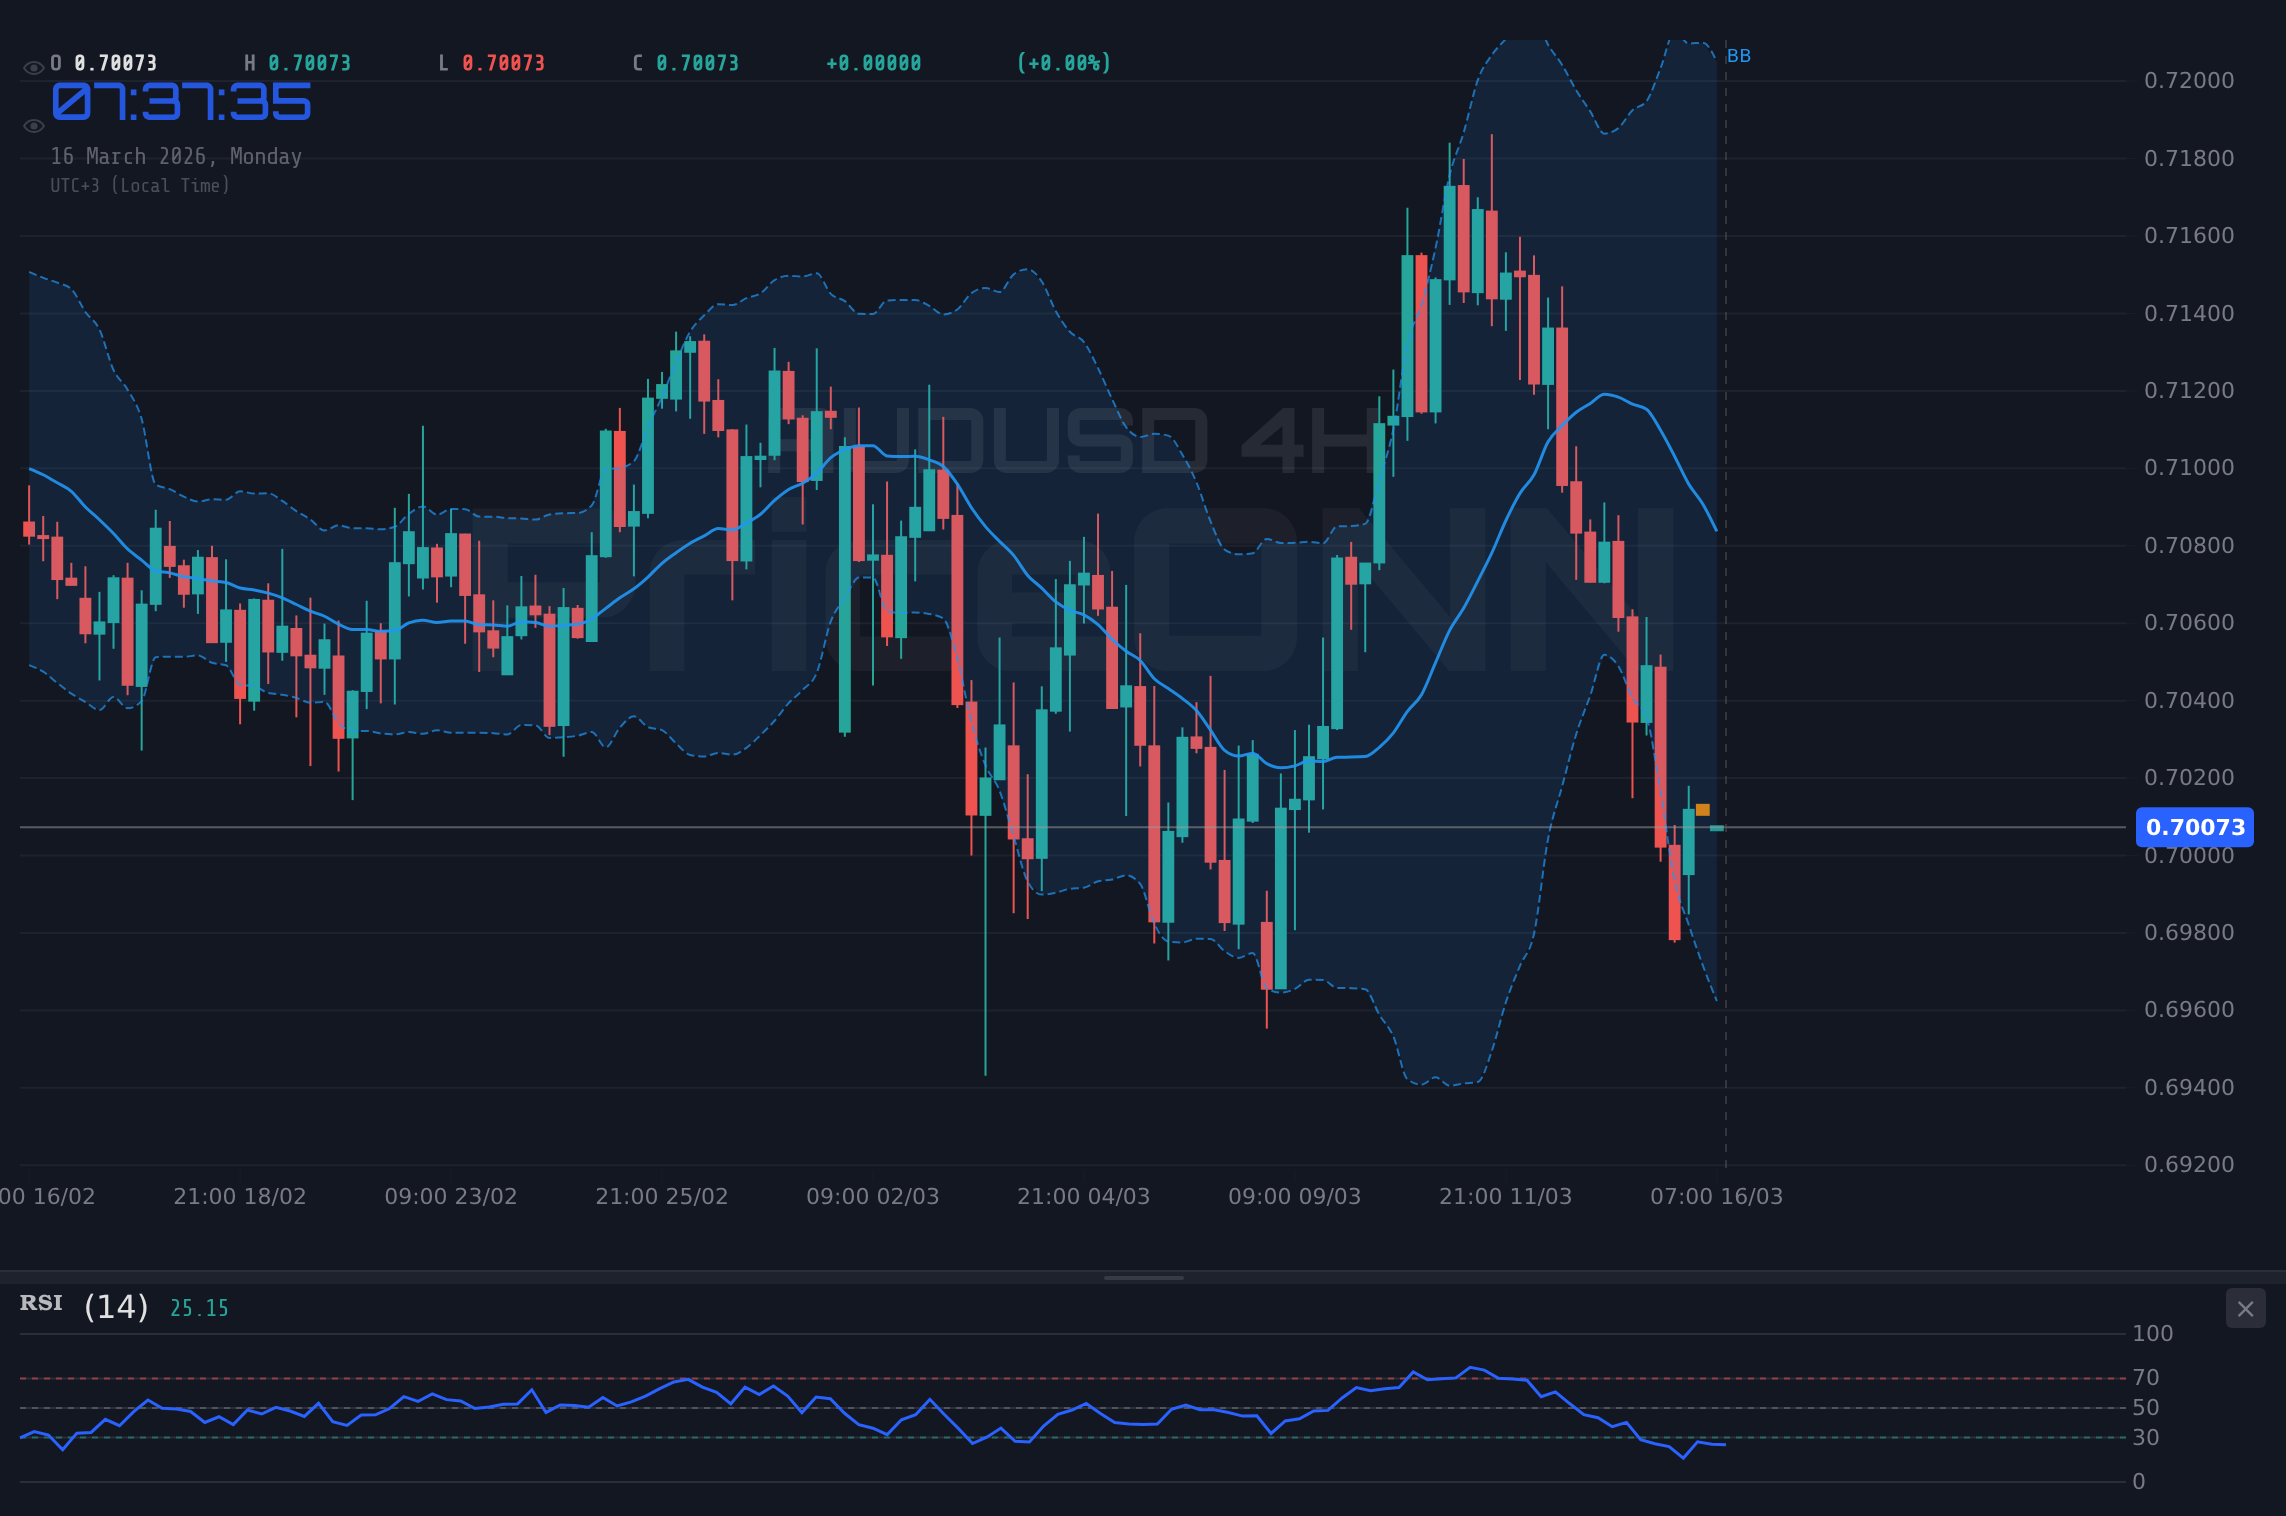
Zooming out to the 4-hour timeframe, the picture becomes clearer, and frankly, a bit more concerning for the bulls. The trend is neutral with 50% strength, but the ADX at 24.69 signifies a moderately strong downward trend. The RSI(14) is at 40.31, continuing the bearish lean. The MACD is negative, sitting below its signal line, reinforcing the idea of selling pressure. The Bollinger Bands are hugging the lower band, a bearish sign. Most notably, the Stochastic indicator (%K at 9.97, %D at 9.95) is deep in oversold territory, suggesting a potential for a bounce, but the overall trend strength here is concerning. The overall signal for this timeframe is SELL, with only 1 buy and 7 sell signals across the indicators.
The daily chart provides the broadest perspective, and it reinforces the bearish undertones. The trend is neutral (50% strength), but the ADX at 24.8 indicates a weak trend, meaning we might be in for a period of consolidation or a significant breakout. The RSI is at 47.39, still in neutral territory but leaning bearishly. The MACD is negative, and the Bollinger Bands are below the middle band, confirming the bearish inclination. The Stochastic (%K at 29.59, %D at 56.72) is showing a clear sell signal, indicating further downside potential. The confluence of these indicators on the daily chart, combined with the strong sell signals on the 4-hour, suggests that while short-term fluctuations might occur, the path of least resistance for AUDUSD appears to be downwards unless key resistance levels are decisively breached.
Now, let's talk about the elephant in the room: the escalating geopolitical tensions in the Middle East. This is not just background noise; it's a significant driver of market sentiment. Reports of Saudi Arabia scaling back its ambitious Neom project due to rising costs and economic pressures, while seemingly a regional issue, have ripple effects. More critically, disruptions to LNG supply from Qatar and potential Strait of Hormuz issues directly impact energy prices. This creates a dual effect: higher oil prices can fuel inflation, which might make central banks more hawkish, and simultaneously, heightened geopolitical risk drives demand for safe-haven assets. The US Dollar, as the world's primary reserve currency, often benefits immensely from such uncertainty. This external factor is a significant headwind for risk-sensitive currencies like the AUD, meaning that even if technicals suggest a minor bounce, the geopolitical backdrop could cap upside potential.
Considering the correlation with the US Dollar Index (DXY), the picture becomes even more nuanced. The DXY is currently at 99.96, showing a strong 97% upward trend on the 4-hour chart and a 96% upward trend on the daily. This strength in the dollar, driven partly by safe-haven flows amid Middle East concerns, directly correlates with weakness in pairs like AUDUSD. When the DXY rallies, AUDUSD tends to fall, and vice-versa. The current DXY price of 99.96, nearing the psychological 100 level, suggests continued dollar strength, which would naturally put pressure on AUDUSD. This macro correlation is a powerful force that traders cannot afford to ignore. The fact that the DXY is in a strong uptrend across multiple timeframes while AUDUSD shows bearish leanings on its daily and 4-hour charts is a significant warning sign for Aussie bulls.
The market sentiment is further complicated by the performance of global equities. The S&P 500 is currently trading at 6667.1, showing a strong 100% downward trend on its daily chart, while the Nasdaq 100 is at 24515.51, also exhibiting a strong 91% downward trend daily. This risk-off sentiment in major equity indices typically leads to a reduction in risk appetite globally. Currencies like the Australian Dollar, which are often perceived as higher-risk assets, tend to suffer when equities fall. Investors often move capital away from these perceived riskier assets and into safer havens like the US Dollar or even gold. This broader market dynamic reinforces the bearish outlook for AUDUSD, suggesting that any rallies might be short-lived unless there's a significant shift in global risk sentiment or a clear break of key technical resistance levels.
Looking at the specific support and resistance levels provided, we can map out potential trading scenarios. On the 1-hour chart, immediate support is at $0.70017 and resistance at $0.70149. A break below $0.70017 could see a move towards $0.69973. Conversely, a sustained push above $0.70149 might target $0.70171. However, the 4-hour chart presents more significant levels: support at $0.6983, $0.6913, and $0.6844, with resistance at $0.7121, $0.7190, and $0.7260. The daily levels are even more critical, with support at $0.69402, $0.6902, and $0.68265, and crucial resistance at $0.70539, $0.71294, and $0.71676. For the bulls to regain control, a decisive move and close above the daily resistance at $0.70539 would be necessary, potentially targeting $0.71294. Failure to do so, and a break below the 1-hour support at $0.70017, could quickly lead to testing the 4-hour support at $0.6983.
Scenario A: Bearish Continuation
70% ProbabilityScenario B: Limited Bounce/Range Play
25% ProbabilityScenario C: Bullish Reversal (Unlikely)
5% ProbabilityOn the economic calendar front, the past few days saw the release of USD data, including employment figures. While the actual numbers were not provided in the market data, the context of such releases is always crucial. Stronger-than-expected US data would typically bolster the dollar (DXY), reinforcing the bearish case for AUDUSD. Conversely, weaker data could offer temporary relief for the Aussie. Looking ahead, any significant economic events impacting the US or Australian economies could provide the catalyst for AUDUSD to break out of its current range. Investors will be keenly watching for any pronouncements from the Fed or RBA that might shift monetary policy expectations, though no such events are immediately listed in the provided calendar for the next 7 days.
The ADX on the daily chart at 24.8 is particularly interesting. It sits in a zone that signifies a weak trend, often preceding a significant move. This means that while we're seeing current price action around $0.70089, the market is likely coiling for a larger move. The question is, which direction? The confluence of the bearish technical signals across the 4-hour and daily charts, the strength in the DXY, and the risk-off sentiment in global equities all point towards a potential downside break. However, the oversold Stochastic on the 4-hour chart and the neutral RSI on the daily suggest that a short-term bounce is not entirely out of the question before any significant downward move. This creates a high-probability setup for a bearish continuation once key support levels are breached.
Geopolitical events in the Middle East are highly unpredictable and can cause sudden, sharp market movements. Any news regarding escalating conflicts or de-escalation efforts could drastically alter the sentiment and price action for AUDUSD. Traders should exercise extreme caution and ensure their risk management is robust.
The key takeaway from this analysis is that while AUDUSD is currently trading at $0.70089, the technical indicators, particularly on the 4-hour and daily charts, are leaning bearish. The ADX reading of 24.8 suggests a potential breakout is brewing, and given the broader market context – a strengthening DXY, risk-off sentiment in equities, and heightened Middle East tensions – the path of least resistance appears to be downwards. A decisive break below the $0.70017 support level on the 1-hour chart could trigger a move towards $0.6983 and potentially lower. Bulls would need to see a strong, sustained push above daily resistance at $0.70539 to invalidate this bearish outlook, a scenario that currently seems less probable given the prevailing conditions.
Frequently Asked Questions: AUDUSD Analysis
What happens if AUDUSD breaks below the $0.70017 support level?
If AUDUSD closes below the 1-hour support at $0.70017, it signals a bearish continuation. The next targets would likely be the 4-hour support at $0.6983, followed by the daily support at $0.69402. This move would be supported by the bearish signals from the MACD and RSI on the daily timeframe.
Should I buy AUDUSD at current levels around $0.70089 given the Stochastic is oversold on the 4H chart?
Buying solely based on the oversold Stochastic on the 4-hour chart at $0.70089 is risky. While a short-term bounce is possible, the stronger bearish signals on the daily chart and the weak trend indicated by the ADX (24.8) suggest caution. A more prudent approach would be to wait for confirmation of a bullish reversal, such as a close above $0.70539, or to look for short opportunities on pullbacks towards resistance levels.
Is the RSI at 47.39 a sell signal for AUDUSD on the daily chart?
An RSI of 47.39 is technically in the neutral zone but leans bearishly. It suggests that while selling pressure is present, it's not yet extreme. It doesn't provide a direct sell signal on its own but contributes to the overall bearish sentiment when viewed alongside other indicators like the MACD and the ADX.
How will escalating Middle East tensions affect AUDUSD this week?
Escalating Middle East tensions typically increase demand for safe-haven assets like the US Dollar, putting downward pressure on risk-sensitive currencies like the AUD. This geopolitical factor reinforces the bearish technical outlook for AUDUSD around $0.70089, potentially capping any upside attempts and increasing the likelihood of a break below key support levels.
| Indicator | Value | Signal | Interpretation |
|---|---|---|---|
| RSI (14) Daily | 47.39 | Neutral | Approaching oversold territory, suggesting potential for a bounce. |
| MACD 1D | -0.0007 | Bearish | Negative momentum indicates selling pressure is dominant. |
| Stochastic Daily | K:29.59, D:56.72 | Bearish | %K < %D suggests further downside potential. |
| ADX Daily | 24.8 | Weak Trend | Indicates a lack of strong directional momentum, potential for consolidation or breakout. |
| Bollinger Bands 1D | Price below Mid Band | Bearish | Price trading below the middle band suggests a downward bias. |
Patience looks like it will be rewarded here. While the current price action around $0.70089 might offer short-term trading opportunities, the broader technical and geopolitical landscape suggests a cautious approach is warranted. The market is signaling a potential downside break, and the risk/reward for short positions appears more favorable if key support levels give way. Always manage your risk, wait for your setup - the market always gives a second chance.
“The biggest risk is not taking any risk… In a world that is changing really quickly, the only strategy that is guaranteed to fail is not taking risks.” – Mark Zuckerberg. Applied to trading: identify your risk, size it appropriately, and let the market play out.
Track markets in real-time
AI-powered analysis, technical indicators and real-time price data.
Join Our Telegram Channel
Breaking market news, AI analysis and trading signals instantly.
Join Channel