USDJPY Tests $159.23 Support: What the ADX of 21.07 Means
USDJPY hovers near $159.23 support. With a weak ADX at 21.07 and mixed signals, a breakout awaits confirmation.
USDJPY is currently navigating critical levels around $159.60, a price point that demands immediate attention from traders focused on the yen's trajectory against the dollar. This pair has been in a persistent uptrend on higher timeframes, but recent choppiness, evidenced by a weak ADX reading of 21.07 on the 4-hour chart, suggests that momentum is waning, and the market is seeking direction. The question on every trader's mind is whether this consolidation near the $159.23 support level is a precursor to a continued ascent or a prelude to a significant pullback. Understanding the interplay between the dollar's broader strength, particularly as indicated by the DXY index currently at 99.97, and the Bank of Japan's monetary policy stance is crucial in deciphering USDJPY's next move.
- USDJPY is trading near the $159.23 support level, with the current price at $159.60.
- The ADX on the 4-hour chart is a weak 21.07, indicating a lack of strong trend conviction despite the daily uptrend.
- RSI at 65.12 on the 4H chart suggests room for further upside, but the Stochastic %K (90.53) is nearing overbought territory.
- The DXY at 99.97 shows a strong daily uptrend, potentially capping further USDJPY gains unless the Bank of Japan intervenes or signals a policy shift.
- Key resistance is at $159.97, while support is observed at $159.46.
The daily chart for USDJPY paints a picture of resilience, showcasing a clear uptrend with the price holding above the 159.23 support and pushing towards resistance levels. The overall trend strength is pegged at 86%, a figure that typically signals a healthy upward bias. However, a closer examination of the shorter timeframes reveals a more nuanced, and perhaps cautionary, narrative. The 1-hour chart, for instance, shows a trend strength of 77%, which is still positive but notably lower than the daily timeframe. More critically, the ADX on this 1-hour chart is a mere 14.25, signaling a period of consolidation or sideways movement. This divergence between the longer-term bullish trend and the shorter-term lack of directional conviction is precisely where savvy traders look for opportunities, but also where they must exercise heightened caution.
The technical indicators on the 1-hour chart offer a mixed bag. While the RSI(14) stands at a neutral 56.63, suggesting room for upward movement before hitting overbought territory, the Stochastic oscillator presents a conflicting signal. Its %K line at 59.57 is just above the %D line at 59.78, hinting at a potential bearish crossover or a stall in momentum. This is further complicated by the MACD, which, despite being in positive territory, shows negative momentum, indicating that the upward pressure might be weakening. The Bollinger Bands on this timeframe are also hugging the middle band, reinforcing the idea of a market in equilibrium, or more likely, a coiled spring awaiting a catalyst.
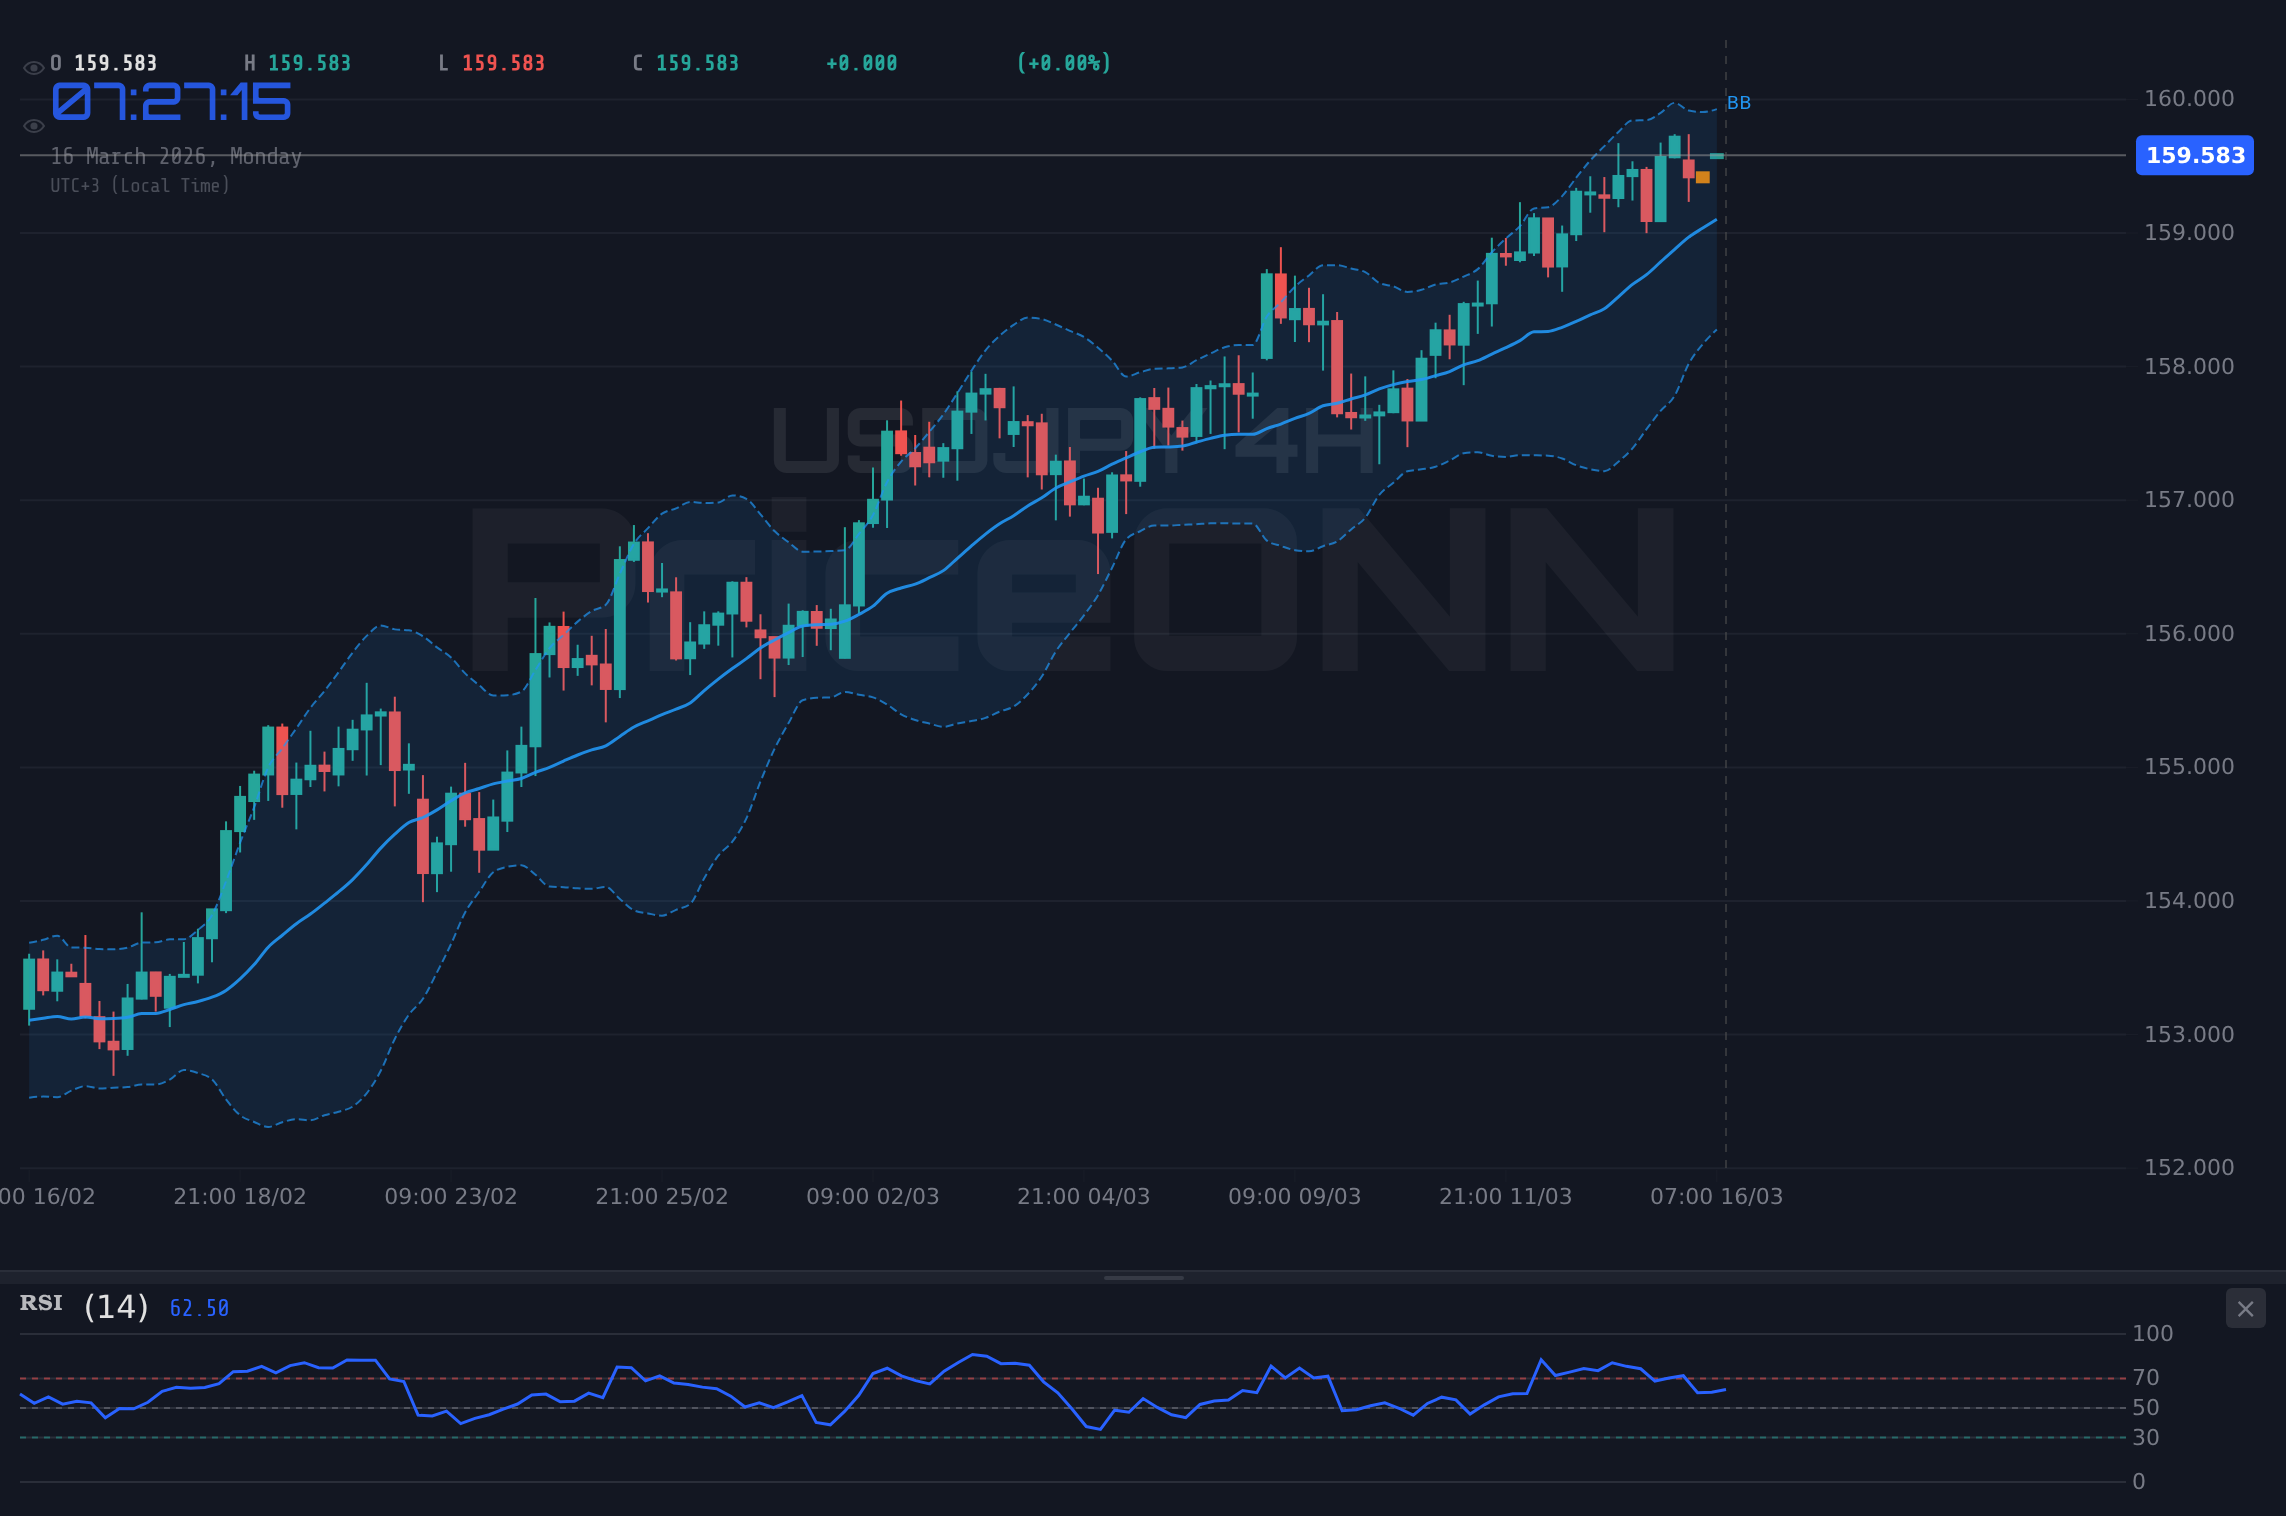
Shifting to the 4-hour timeframe, the picture becomes clearer, yet more complex. The trend strength remains robust at 86%, and the RSI(14) at 65.12 still offers room for upside before entering the overbought zone. However, the Stochastic oscillator here is a different story: %K at 90.53 and %D at 79.67 suggest the pair is entering, or has just entered, overbought conditions. This divergence between the RSI's potential and the Stochastic's overbought warning is a classic sign of market indecision. The MACD histogram is positive, but its bars are shortening, again pointing to waning bullish momentum. Crucially, the ADX at 21.07 on this timeframe is significantly lower than on the daily chart, confirming that while the long-term trend is up, the medium-term trend is losing steam. This is the sweet spot for traders who understand that not all uptrends are linear and that pullbacks are often necessary for healthy price discovery.
The daily chart for USDJPY, currently showing a strong uptrend with an ADX of 22.02, is the anchor for the bullish case. The RSI(14) at 68.86 is comfortably within the neutral zone, not yet signaling overbought conditions, and the MACD is firmly in positive territory, supporting the continuation of the uptrend. The Stochastic oscillator, however, is flashing a strong warning with %K at 97.3 and %D at 87.04, firmly in overbought territory. This is a significant divergence from the RSI and MACD, suggesting that while the trend is strong, the pace might become unsustainable without a correction. The price action has been consistently making higher highs and higher lows, a hallmark of a healthy bullish trend, but the increasing stochastic divergence is a signal to watch closely for potential exhaustion.
The current price action around $159.60 is particularly interesting when viewed against the provided support and resistance levels. On the 1-hour chart, immediate support lies at $159.461, followed by $159.336. Resistance is seen at $159.654 and $159.722. A break above $159.722 could signal a continuation of the intraday rally. However, the 4-hour chart presents a more significant battleground. Support is identified at $159.607, very close to the current price, and then at $159.492. Resistance looms at $159.788 and $159.854. A decisive close above $159.854 on the 4-hour chart would be a strong bullish signal, potentially paving the way for a retest of the daily resistance levels.
On the daily chart, the key support levels are $159.233 and $158.746. These are substantial levels that, if broken, would signal a significant shift in the market's sentiment. The immediate daily resistance is at $159.974, with further resistance at $160.228. A sustained move above $160.228 would confirm the continuation of the bullish trend and open up further upside potential. The current price of $159.60 sits precariously between the immediate 1-hour resistance of $159.654 and the 4-hour support at $159.607. This tight range highlights the current indecision in the market and the importance of watching for a clear breakout or breakdown.
The broader market context, particularly the performance of the US Dollar Index (DXY), cannot be ignored. With the DXY currently at 99.97 and showing a strong daily uptrend (ADX 31.72, RSI 72.05), the dollar is exhibiting strength. Typically, a strong dollar exerts downward pressure on USDJPY. However, in this case, USDJPY has been resiliently trending upwards, suggesting that other factors, such as the Bank of Japan's ultra-loose monetary policy and yield differentials, are currently outweighing dollar strength. The fact that USDJPY can maintain its upward trajectory despite a strong DXY is a testament to the underlying bullish momentum, but it also means that any shift in the DXY's trend or a change in the BoJ's stance could have a magnified impact on USDJPY.
Geopolitical tensions, while not directly cited in the provided data for USDJPY, always provide a backdrop for currency markets. Recent news about Middle East tensions potentially impacting EUR/USD and energy prices, alongside Saudi Arabia's scaling back of its Neom project, highlights a general undercurrent of global uncertainty. While these events might not have an immediate, direct impact on USDJPY compared to, say, US interest rate expectations or BoJ policy, they contribute to overall risk sentiment. In such an environment, the JPY often benefits from safe-haven flows, which could, in theory, put pressure on USDJPY. However, the current strong bullish trend suggests that these safe-haven considerations are currently being overshadowed by the yield differential narrative.
From a trading perspective, the confluence of a daily uptrend, mixed short-term signals, and a weak ADX on the 4-hour chart presents a challenging but potentially rewarding scenario. The ADX of 21.07 on the 4-hour chart is particularly telling; it signifies a lack of strong trend conviction, which often precedes a significant move. The Stochastic oscillator nearing overbought levels on the 4H chart, combined with the RSI at 65.12, suggests that while upside is possible, a pullback is also a strong probability. The immediate support at $159.607 on the 4H chart is the key level to watch. A failure to hold this level could trigger a move towards the next support at $159.492.
Given the data, a cautious bullish approach seems warranted, prioritizing trades that align with the daily trend but acknowledge the short-term weakness. The 1-hour chart's resistance at $159.654 and $159.722, and the 4-hour resistance at $159.788 and $159.854, represent the immediate hurdles. A breakout above $159.854 on a 4-hour closing basis, especially with increasing volume, would be a strong buy signal, confirming the continuation of the uptrend and targeting higher levels. Conversely, a decisive break and close below $159.607 on the 4-hour chart would invalidate the immediate bullish setup and could lead to a deeper correction towards $159.492 and potentially $159.233.
The Bank of Japan's stance on monetary policy remains a significant wildcard for USDJPY. While the market has largely priced in the current yield differentials and the yen's weakness, any hint of policy normalization from the BoJ could dramatically alter the pair's trajectory. Traders are constantly monitoring Japanese economic data and BoJ statements for clues. Until then, the prevailing narrative of higher US interest rates compared to Japan's ultra-low rates is likely to continue supporting USDJPY, albeit with periods of consolidation and potential pullbacks as seen in the current technical setup. The price action around $159.60 is a critical juncture, demanding vigilance.
The current technical picture for USDJPY is one of a mature uptrend facing headwinds from waning short-term momentum and potential overbought conditions on some oscillators. The daily trend remains robust, but the shorter timeframes are painting a picture of consolidation. This creates a scenario where traders must be patient, waiting for a clear breakout above immediate resistance or a confirmed rejection and pullback to support levels. The weak ADX reading on the 4-hour chart is a key indicator that the prevailing trend is losing steam, making the current price levels around $159.60 particularly sensitive. The market is at a crossroads, and the next few hours of trading will likely dictate the immediate direction.
Frequently Asked Questions: USDJPY Analysis
What happens if USDJPY breaks below the $159.60 support level?
If USDJPY closes below the 4-hour support at $159.607, it would invalidate the immediate bullish outlook. This could trigger a move towards the next support at $159.492, and potentially test the daily support at $159.233.
Should I buy USDJPY at current levels near $159.60 given the daily uptrend?
A cautious approach is recommended. While the daily trend is bullish, the 4-hour chart shows waning momentum with a weak ADX of 21.07 and overbought Stochastic. A confirmed break above $159.854 resistance is a better entry trigger, targeting $160.228. Otherwise, waiting for a pullback to $159.492 support with bullish confirmation could offer a better risk/reward.
Is the RSI at 65.12 on the 4H chart a sell signal for USDJPY?
No, an RSI of 65.12 is not a direct sell signal; it remains in the neutral zone, indicating room for further upside. However, it's approaching the overbought threshold, and when combined with the overbought Stochastic (%K: 90.53), it suggests that the bullish momentum might be nearing exhaustion, making further gains potentially limited without a correction.
How will the strong DXY at 99.97 affect USDJPY's outlook this week?
The strong DXY at 99.97 typically exerts downward pressure on USDJPY. However, USDJPY's resilience suggests that yield differentials and BoJ policy are currently stronger drivers. While the DXY's strength might cap further rapid gains, it hasn't yet reversed the USDJPY uptrend, though a significant shift in DXY sentiment could challenge this.
Scenario A: Bullish Continuation
60% ProbabilityScenario B: Bearish Pullback
40% Probability| Indicator | Value | Signal | Interpretation |
|---|---|---|---|
| RSI (14) | 65.12 | Neutral | Room for upside, but nearing overbought zone |
| MACD Histogram | +0.09 | Bullish | Positive momentum, but bars shortening |
| Stochastic (%K/%D) | 90.53/79.67 | Bearish (Overbought) | Entering overbought territory, potential reversal signal |
| ADX | 21.07 | Weak Trend | Confirms lack of strong directional conviction on 4H |
| Trend Strength (4H) | 86% | Bullish | Overall trend remains up, despite short-term weakness |
Track markets in real-time
AI-powered analysis, technical indicators and real-time price data.
Join Our Telegram Channel
Breaking market news, AI analysis and trading signals instantly.
Join Channel