GBPUSD Tests 1.3168 Support Amid Bearish RSI; What's Next?
GBPUSD hovers near $1.33 as a bearish RSI at 34.1 signals caution. With key support at $1.3168, traders eye potential bounces or further downside.
The British Pound is treading water against the US Dollar, hovering precariously around the $1.33 mark. This delicate balance comes as a bearish Relative Strength Index (RSI) reading on the daily chart, currently sitting at 34.1, signals a weakening upward momentum and hints at potential further downside. The market is keenly observing the critical support level at $1.3168; a break below this could unleash significant selling pressure, while a hold and subsequent bounce might offer a reprieve for GBP bulls. This technical picture is unfolding against a backdrop of shifting central bank expectations and ongoing geopolitical uncertainties, making the current price action for GBPUSD a crucial point of observation for traders across all timeframes.
- RSI at 34.1 signals bearish momentum, indicating potential for further downside pressure on GBPUSD.
- Critical support sits at $1.3168; a break below this level could trigger significant selling.
- The ADX at 30.41 indicates a strong downtrend, suggesting that current price action is part of a larger bearish move.
- DXY's strength, currently at 99.96, continues to exert pressure on GBPUSD, reflecting broader US Dollar resilience.
The current technical landscape for GBPUSD paints a picture of cautious pessimism, largely driven by the stark readings from key momentum indicators. On the daily timeframe, the RSI is firmly entrenched in bearish territory at 34.1. While not yet in the oversold region below 30, this level suggests that the recent upward attempts have lacked conviction and that sellers are regaining control of the narrative. This is further corroborated by the MACD, which continues to trade below its signal line, indicating negative momentum. The Stochastic Oscillator, with its %K line at 17.25 and %D line at 41.53, also reinforces this bearish outlook, showing a clear downward trajectory and suggesting that further declines are probable before any significant oversold conditions are met. The ADX, a measure of trend strength, stands at a robust 30.41 on the daily chart, confirming that a strong downtrend is indeed in play, making any counter-trend rallies susceptible to failure.
Looking at the shorter timeframes, the 1-hour chart presents a slightly mixed, albeit still cautious, signal. While the overall trend strength indicated by the ADX is strong (36.35), the RSI at 44.46 hovers in neutral territory, showing a slight bearish lean but not yet confirming a strong downward push. The MACD is positive, suggesting some short-term buying pressure, and the Stochastic Oscillator is in overbought territory (K=85.1, D=57.05), hinting at a potential pullback or consolidation. However, the Bollinger Bands on the 1-hour chart are positioned below the middle band, indicating a bearish bias in the immediate term. This short-term noise needs to be viewed within the context of the larger daily and 4-hour downtrends, which are far more dominant and likely to dictate the pair's direction over the coming sessions. Traders looking for immediate opportunities might be tempted by the short-term Stochastic signal, but the overarching bearish signals from higher timeframes suggest that such moves are likely to be counter-trend retracements rather than sustainable reversals.
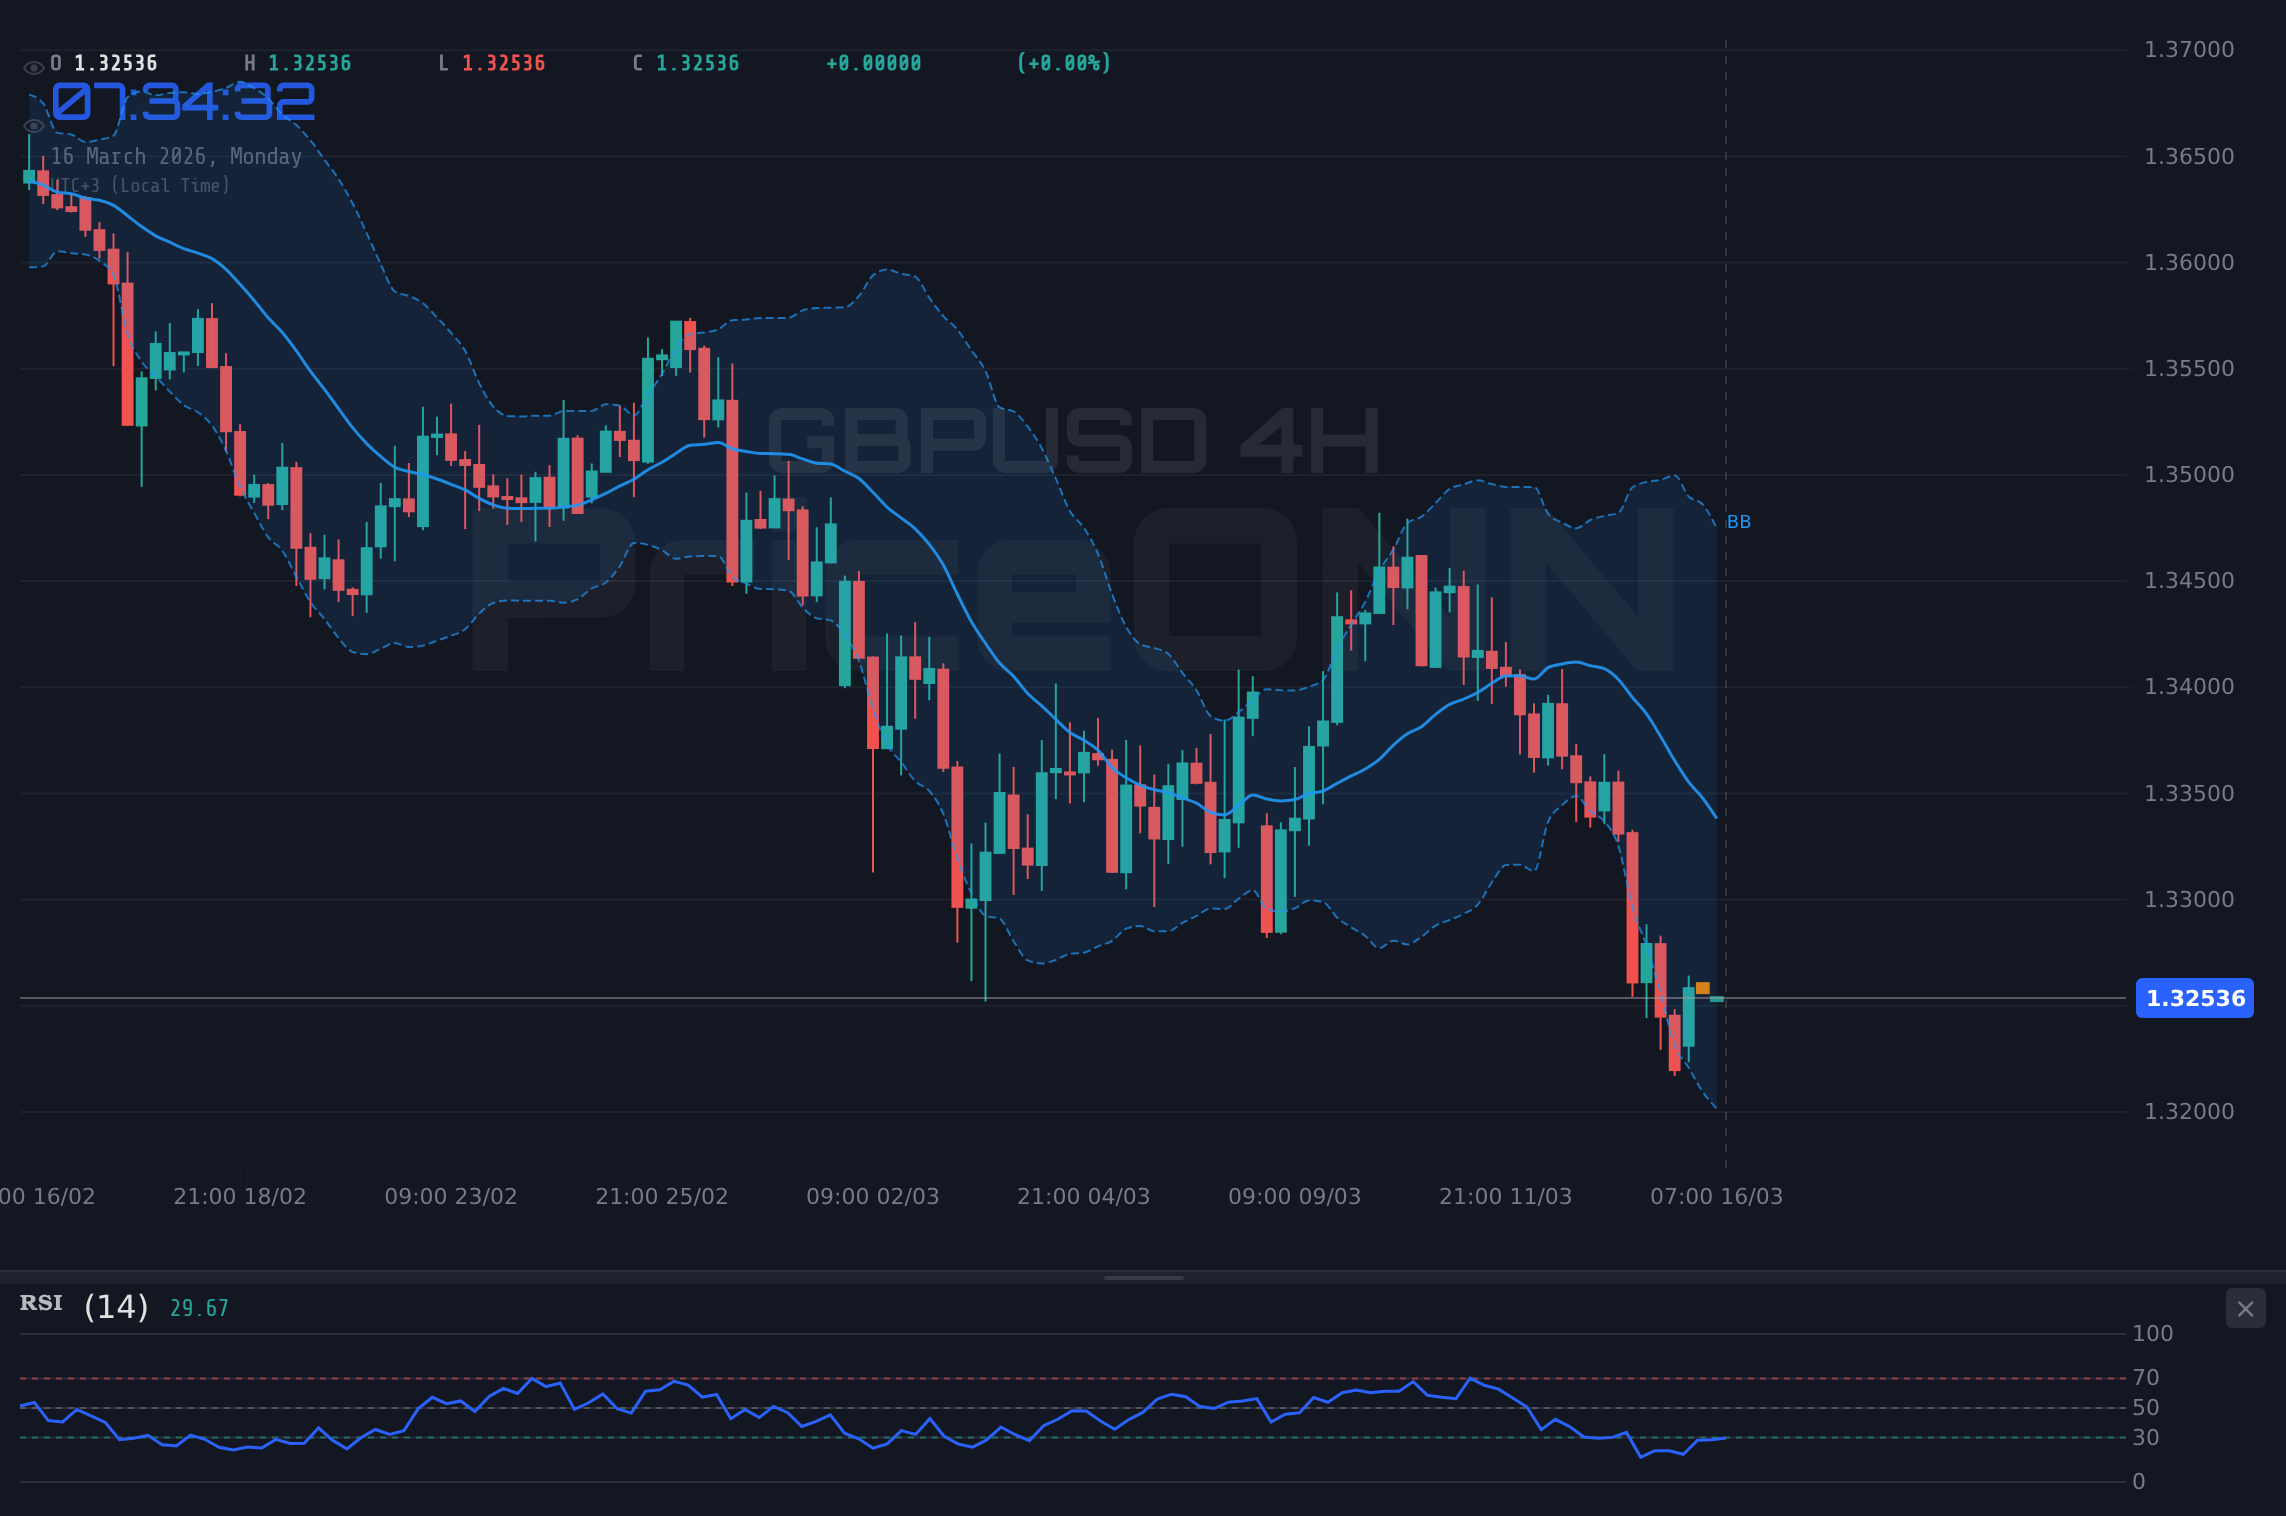
The 4-hour chart offers a clearer, more aligned bearish perspective. Here, the trend is decisively downward, with an ADX reading of 28.95 indicating a strong trend in play. The RSI at 37.12 continues to corroborate the daily bearish sentiment, staying well below the 50 mark and suggesting limited buying interest. The MACD is firmly negative, trading below its signal line, and the Stochastic Oscillator (%K=12.19, %D=10.46) is deep in oversold territory, but this can often persist in strong downtrends, meaning it's not yet a buy signal. The Bollinger Bands are hugging the lower band, a classic sign of bearish pressure. This confluence of indicators on the 4-hour timeframe suggests that the prevailing sentiment is bearish, and any rallies are likely to be met with selling pressure as the market attempts to push towards lower support levels. The fact that the Stochastic is oversold here, while still in a strong downtrend, is a critical observation; it implies that the selling momentum is intense, and a reversal would likely require a significant shift in market dynamics or a clear break of key resistance.
Navigating the Dollar's Strength and Sterling's Weakness
The persistent strength of the US Dollar, as indicated by the Dollar Index (DXY) currently trading at 99.96, is a significant factor weighing on GBPUSD. The DXY exhibits a strong upward trend across all observed timeframes (1H, 4H, 1D), with daily RSI readings in the overbought zone (71.96) and a robust ADX of 31.72. This dollar strength typically correlates inversely with pairs like GBPUSD, meaning as the dollar strengthens, the pound tends to weaken against it. The current DXY price action suggests that market participants are favoring the greenback, potentially due to perceived stability, higher interest rate differentials, or a general risk-off sentiment in global markets. This macro backdrop is crucial for understanding the underlying pressure on GBPUSD. Even if short-term technicals on GBPUSD show minor bounces, the overarching strength of the dollar provides a persistent headwind that limits the upside potential and increases the probability of further declines.
The correlation analysis extends beyond just the DXY. We observe that major US indices like the S&P 500 (6667.45) and Nasdaq 100 (24516.39) are showing signs of weakness on the daily charts, with bearish ADX readings and RSI below 45. This risk-off sentiment in equities often fuels demand for safe-haven assets, including the US Dollar, further amplifying the pressure on riskier currencies or currencies tied to global growth prospects, such as the British Pound. While Brent crude oil (105.01) and WTI (99.53) are showing strong upward momentum, suggesting potential inflationary pressures or geopolitical supply concerns, their impact on GBPUSD is less direct compared to the dollar's own strength and the sentiment in global equity markets. The general theme is one of dollar dominance and caution in risk assets, creating a challenging environment for GBP.
For scalpers looking for quick in-and-out trades, the 1-hour chart's Stochastic Oscillator showing overbought conditions (K=85.1) might present a fleeting opportunity for short-term trades against the prevailing trend. However, the strong ADX (36.35) on this timeframe suggests trend continuation is more likely. A scalper might look to fade rallies towards the 1.3260-1.3270 resistance zone, aiming for a quick few pips profit before the downtrend reasserts itself. The key here is extremely tight risk management and quick exits, as the higher timeframe trends could quickly overwhelm any short-term gains. The risk of being caught in a sudden move against their position is high, especially if the market reacts to news or a break of a micro-support level.
Swing traders, who typically hold positions for a few days to a week, will be closely watching the $1.3168 support level. A confirmed break and hold below this level on the 4-hour or daily chart would be a significant bearish signal, potentially opening the door for a move towards the next support at $1.3117. The ADX at 28.95 on the 4-hour chart supports the idea of a strong trend developing, making a break of this key support a high-probability setup for a swing short. Entry might be sought on a retest of $1.3168 as resistance, or on a decisive break with increased volume confirming the bearish conviction. The target would be the $1.3117 level, with a stop-loss placed slightly above the broken support, perhaps around $1.3200, to account for minor volatility.
Long-term investors, however, might view the current price action as a potential accumulation phase or a period of strategic waiting. The daily RSI at 34.1, while bearish, is approaching levels that have historically provided support and led to reversals in the past. The key for long-term players is to monitor the confluence of factors: a sustained break above the daily middle Bollinger Band (currently near $1.3280), a bullish MACD crossover on the daily chart, and a clear divergence on the RSI suggesting momentum is shifting. Furthermore, a significant change in the DXY trend or a dovish pivot from the Federal Reserve would be necessary catalysts. For now, the long-term outlook remains bearish, but observant investors might be looking for signs of a bottoming process, potentially near the $1.3017 support level, which represents a more significant psychological and historical floor.
Trade Scenarios and Risk Management
Given the current technical confluence pointing towards bearishness, the primary trade setup favors short positions. The key trigger for entering a short trade would be a decisive close below the $1.3168 support level on the daily chart, confirmed by increased trading volume and bearish momentum indicators. An ideal entry point could be on a subsequent retest of $1.3168 as resistance. The immediate target would be the next support level at $1.3117. A more ambitious target could be placed around $1.3017, a historically significant level that has acted as a floor in the past. The stop-loss for such a trade would be placed above the invalidated support level, perhaps around $1.3200, ensuring that a move back above this point invalidates the bearish thesis.
Scenario A: Bearish Breakdown
65% ProbabilityConversely, a bullish scenario would require a significant shift in market dynamics. For a bullish trade to be considered, GBPUSD would need to decisively break and hold above the resistance level at $1.3265, followed by a sustained move above $1.3300. Confirmation would come from the RSI moving back above 50, the MACD showing a bullish crossover, and the DXY showing signs of weakness or reversal. The immediate target in a bullish scenario would be the $1.3320 resistance, with a secondary target at $1.3420 if momentum continues. The invalidation level for this trade would be a close back below $1.3250, indicating that the bullish attempt failed. This scenario currently carries a lower probability (around 35%) given the overwhelming bearish signals across multiple timeframes.
Scenario B: Bullish Reversal
35% ProbabilityRisk management is paramount in this environment. Given the strong ADX readings indicating trending conditions, stop-losses should be respected strictly. The potential for sharp moves, especially around key economic data releases or geopolitical news, cannot be underestimated. Traders should consider position sizing carefully to ensure that any potential loss remains within their risk tolerance. The current market conditions, characterized by dollar strength and bearish technicals on GBPUSD, demand a cautious approach. Patience is key; waiting for a clear setup that aligns with the dominant trend or a confirmed reversal pattern is often more rewarding than forcing trades in choppy or uncertain market conditions.
Historically, periods of strong dollar appreciation have often led to significant declines in GBPUSD, sometimes resulting in multi-year lows. For instance, following the 2008 financial crisis and again during the taper tantrum in 2013, a strengthening dollar, fueled by different macroeconomic drivers, exerted immense downward pressure on the Sterling. While the specific catalysts differ today, the pattern of dollar dominance often plays out similarly. The current bearish RSI and strong ADX readings echo some of the conditions seen in those prior downtrends, suggesting that the market may be entering a phase where the US Dollar's influence is paramount. This historical perspective underscores the importance of respecting the current trend and the key support levels that are being tested.
Upcoming economic data releases, particularly from the US and UK, could introduce significant volatility. Traders should remain vigilant for any surprises in inflation reports, employment figures, or central bank commentary that could alter the current market sentiment and price action for GBPUSD. Ensure your risk management strategies are robust.
Frequently Asked Questions: GBPUSD Analysis
What happens if GBPUSD breaks below the $1.3168 support level?
A decisive break below $1.3168 on the daily chart, especially with increased volume, would confirm the bearish trend. This could lead to a rapid decline towards the next significant support at $1.3117, and potentially even $1.3017, as selling pressure intensifies and stops are triggered.
Should I consider buying GBPUSD at current levels near $1.33 given the oversold Stochastic on the 4-hour chart?
While the 4-hour Stochastic is oversold (K=12.19, D=10.46), the strong daily downtrend (ADX 30.41) and bearish RSI (34.1) suggest this is not yet a reliable buy signal. A contrarian trade might be attempted with very tight stops above $1.3200, but the higher probability remains for further downside. Wait for confirmation of a trend reversal on higher timeframes.
Is the RSI at 34.1 a sell signal for GBPUSD right now?
An RSI of 34.1 on the daily chart indicates bearish momentum but is not yet in the oversold territory below 30. It signals that sellers are in control and further downside is possible. While it doesn't trigger an immediate sell order, it strongly supports a bearish bias and suggests that any rallies are likely to face selling pressure.
How will the current DXY strength at 99.96 affect GBPUSD this week?
The DXY's strong upward trend and RSI in the overbought zone at 71.96 suggest continued dollar strength. This typically exerts downward pressure on GBPUSD. Unless the DXY shows a clear reversal or significant bearish divergence, this dollar strength will likely act as a headwind for any potential Sterling rallies, reinforcing the bearish outlook for GBPUSD.
| Indicator | Value | Signal | Interpretation |
|---|---|---|---|
| RSI (14) | 34.1 | Bearish | Approaching oversold, but trend remains bearish. |
| MACD Histogram | -0.003 | Bearish | Negative momentum persists. |
| Stochastic (%K/%D) | 17.25 / 41.53 | Bearish | Further downside potential before oversold conditions. |
| ADX | 30.41 | Strong Trend | Confirms a strong downtrend is in play. |
| Bollinger Bands | Middle Band | Bearish | Price below middle band, confirming bearish bias. |
Track markets in real-time
AI-powered analysis, technical indicators and real-time price data.
Join Our Telegram Channel
Breaking market news, AI analysis and trading signals instantly.
Join Channel