XAGUSD Wobbles Near $80.58: Bull vs. Bear Showdown at Key Levels
Silver prices are testing crucial support around $80.58. We analyze the bull and bear cases, weighing technical indicators and market sentiment to predict the next move.
Is the current pause in silver's advance a mere breather before the next leg higher, or are the bears finally gaining the upper hand? As XAGUSD hovers around the critical $80.58 mark, a fierce battle is unfolding between bullish conviction and bearish pressure. This isn't just about a few dollars; it's about the underlying sentiment driving precious metals and what it signals for broader market risk appetite. Today, we delve deep into the technical tapestry and fundamental undercurrents to dissect the competing narratives shaping the silver market.
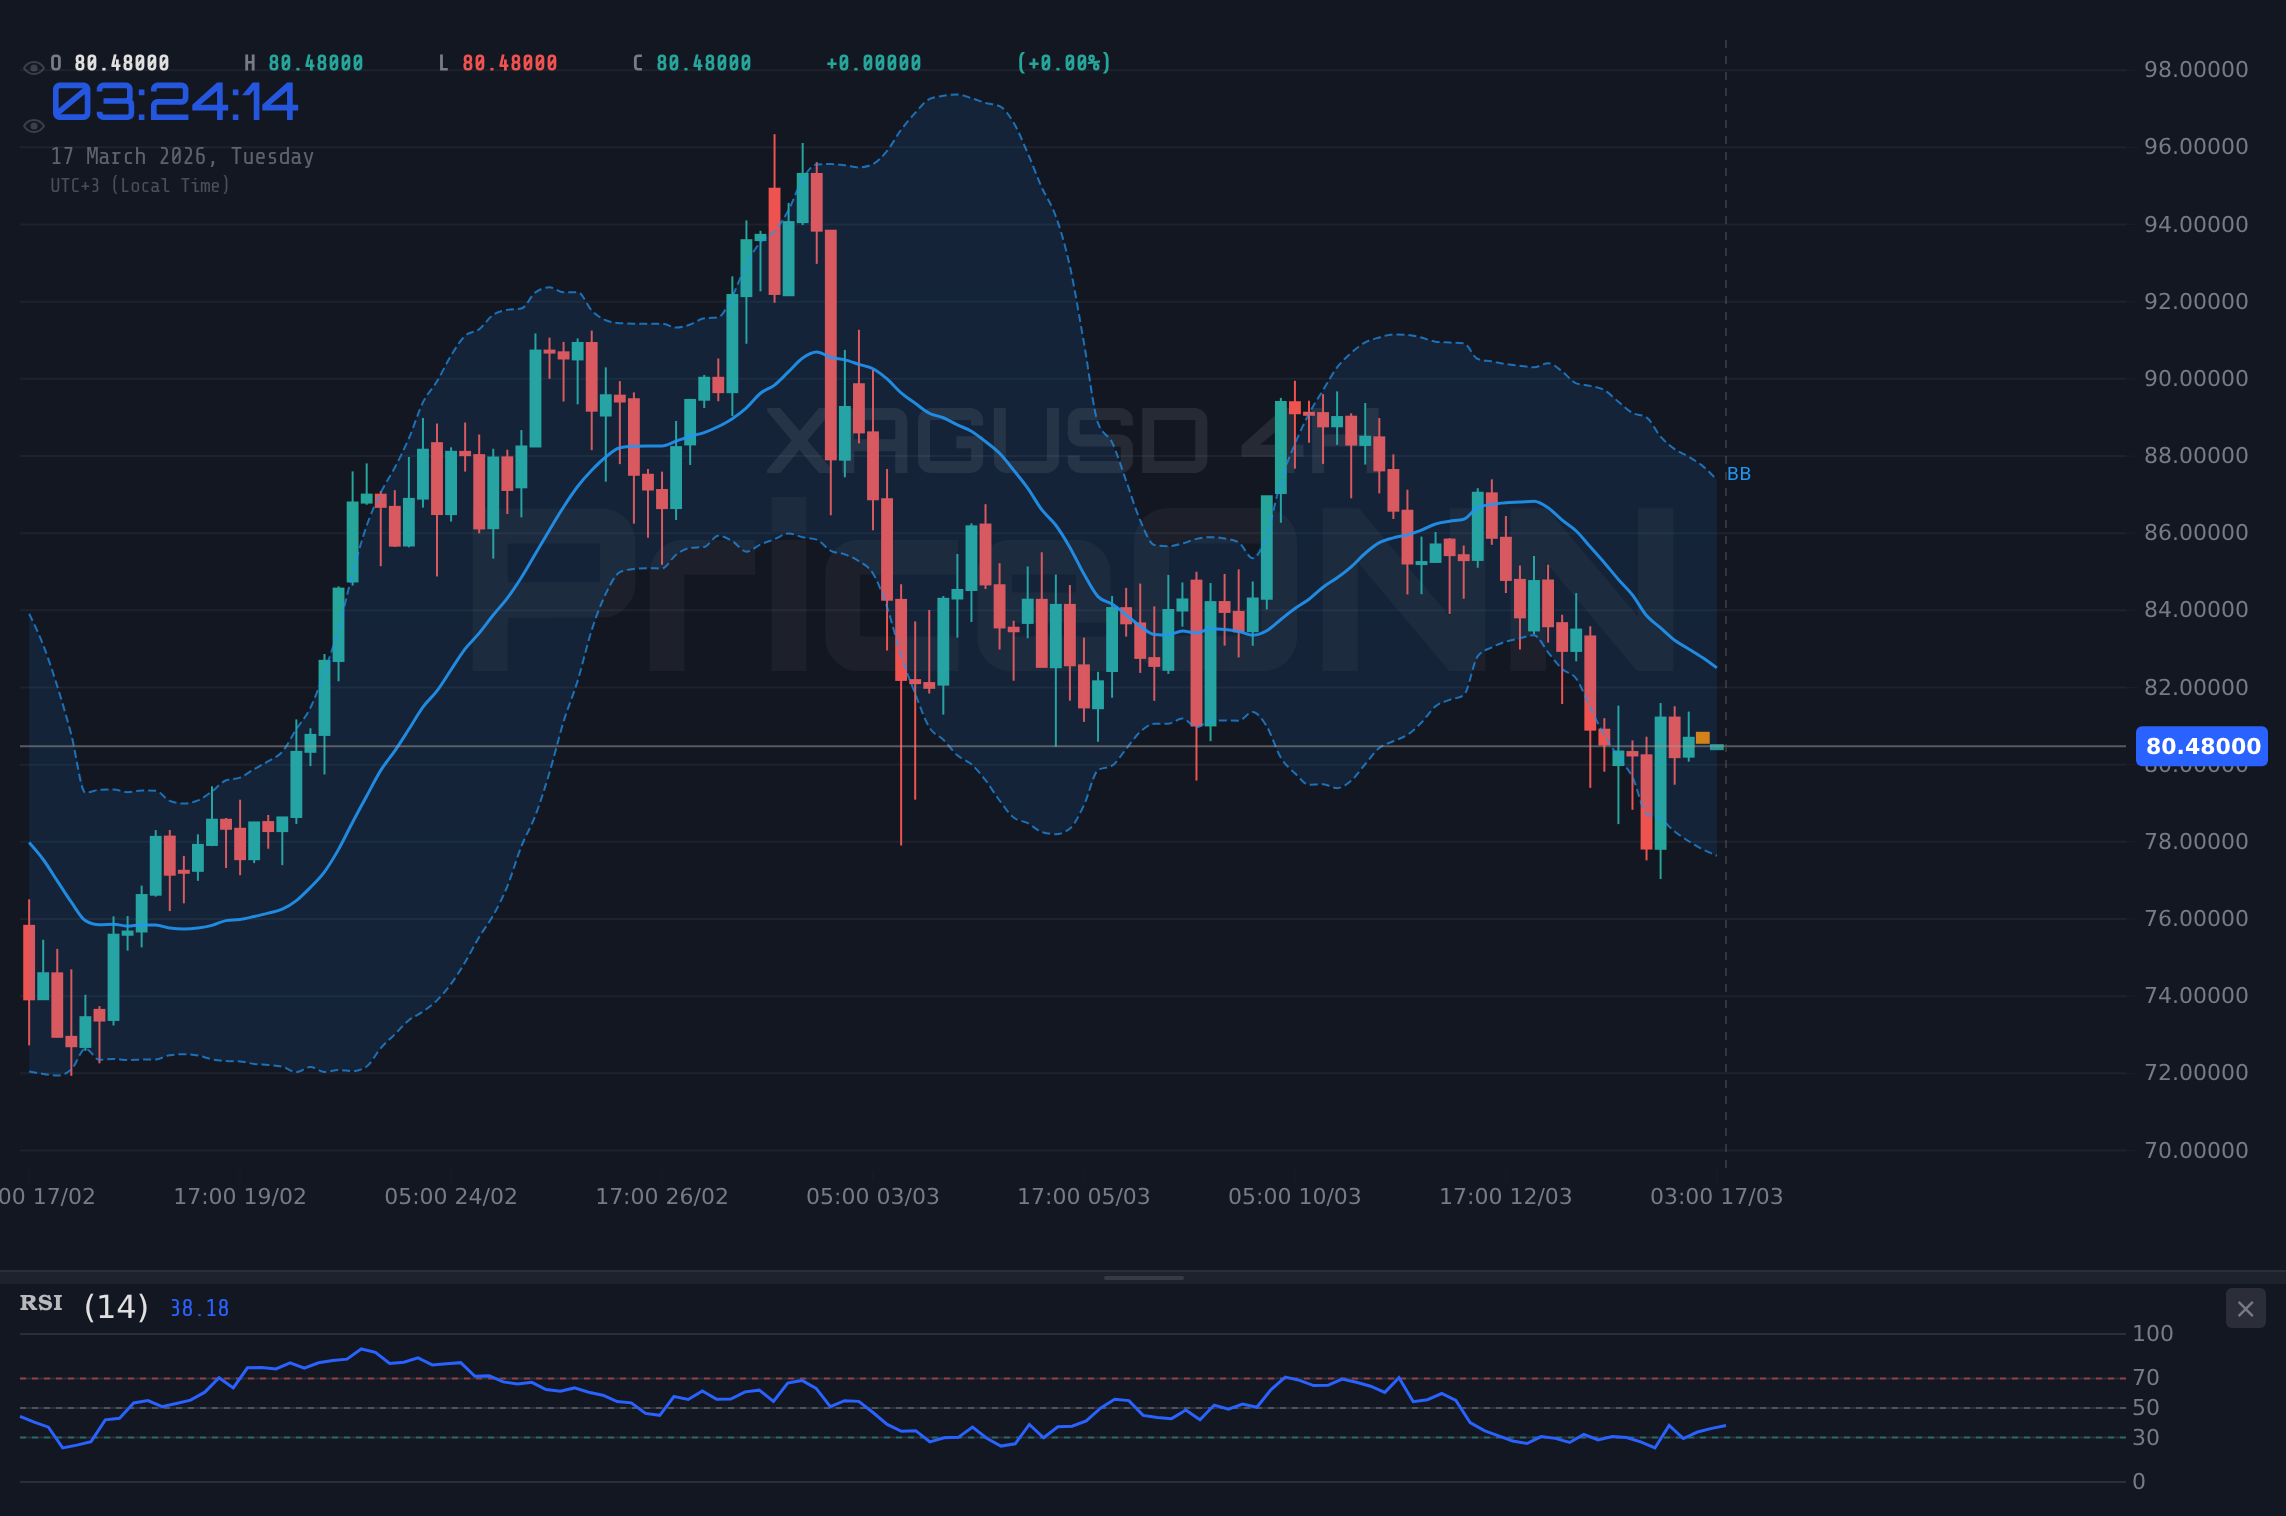
- XAGUSD is trading near $80.58, with the 4-hour chart showing a strong bearish trend (ADX 42.42) while the 1-hour chart signals neutrality.
- Key support for XAGUSD is identified at $80.51, and resistance is seen at $81.01, according to 1H data.
- RSI readings across timeframes are below 50, indicating a bearish lean, though Stochastic shows conflicting signals, particularly on the 1H and 4H charts.
- Geopolitical tensions and inflation concerns remain background factors, but current price action is dominated by technical levels and momentum indicators.
The Bullish Case: Searching for Higher Ground Above $81.01
A Consolidation Before the Next Surge?
The bulls are looking at the recent price action not as a failure, but as a necessary consolidation phase after a period of significant gains. While the current price of $80.58 might seem like a slight retreat, the underlying strength suggested by some indicators, particularly on shorter timeframes, offers a glimmer of hope. The 1-hour Stochastic, for instance, is showing a bullish signal (%K > %D) at 60.33/71.11, suggesting that the recent dip might be an opportunity for buyers to step in. Furthermore, the MACD on the 1-hour chart is positive, indicating that momentum is still favoring the upside in the immediate term. For the bulls, the $80.51 support level is paramount. Holding this level, and ideally pushing back above the immediate resistance at $81.01, would be the first step in validating the continuation of an upward trend. They argue that any dip below $81.01 is simply a chance to accumulate at better prices before the inevitable next leg higher, fueled by persistent inflation concerns and potential safe-haven demand.
Inflationary Tailwinds and Safe-Haven Appeal
The broader economic landscape continues to provide a supportive backdrop for precious metals. Even with some energy prices experiencing pullbacks, the underlying inflationary pressures haven't dissipated. Central banks globally are walking a tightrope, attempting to curb inflation without stifling economic growth. This environment often leads investors to seek assets that can act as a hedge against currency devaluation and economic uncertainty. Silver, often considered the 'poor man's gold,' benefits from this sentiment. While gold prices have seen some fluctuation, the overall demand for tangible assets remains robust. The bulls believe that any significant geopolitical escalation or unexpected inflation spike would immediately draw capital back into silver, pushing prices decisively above the $81.01 resistance. The recent news mentioning Brent crude falling below $95 amid easing Middle East tensions might temporarily temper inflation fears, but the underlying supply chain vulnerabilities and geopolitical risks haven't vanished. This persistent uncertainty is a bedrock for silver's safe-haven appeal, a factor the bulls are counting on.
The Bearish Case: Pressure Mounting Below $80.58
Dominant Downtrend and Fading Momentum
On the flip side, the bears are pointing to the overwhelming technical signals, particularly on the medium-term charts, as evidence that the upward momentum is faltering. The 4-hour chart paints a starkly different picture than the 1-hour. Here, the trend is firmly bearish with an ADX reading of 42.42, signifying a strong trend. The RSI is comfortably below 50 at 38.76, and the MACD is showing negative momentum, with the MACD line below its signal line. The price is also trading below the middle Bollinger Band, reinforcing the bearish bias. The daily chart further solidifies this view, with an ADX of 12.68 indicating a weak trend, but the overall signal leans towards 'Sell' (Al: 2, Sat: 6, Nötr: 0). The Stochastic on the daily chart is also bearish (%K < %D at 13.31/30.74), suggesting further downside potential. For the bears, the current price of $80.58 is a precarious position. A break below the immediate support at $80.51 could trigger a cascade towards the next significant level at $80.29, and potentially even $80.01. They see the current price action as a failed attempt to break higher, leading to a reassignment of capital to short positions.
Conflicting Indicators and Macro Headwinds
While the bulls might latch onto short-term bullish signals from indicators like the 1-hour Stochastic, the bears argue these are fleeting and likely to be overwhelmed by the dominant bearish signals on longer timeframes. The conflict between the 1-hour Stochastic's bullish signal and the daily's bearish signal is a classic sign of indecision, but in a downtrending context, it often precedes a continuation of the primary trend. The recent news highlighting silver prices tumbling to a three-week low below $80, with the $78.00 level under scrutiny, directly supports the bearish narrative. This suggests that the market is indeed testing lower ground. Furthermore, while inflation remains a concern, the narrative around central bank policy is crucial. If central banks signal a more aggressive stance on inflation, or if growth concerns intensify, it could lead to a broader risk-off sentiment that might see investors liquidate positions across the board, including in precious metals, to seek the safety of cash or government bonds. The news about WTI crude oil falling below $95 also suggests that immediate inflationary pressures might be easing, reducing some of the urgency for a strong silver rally.
Navigating the Crosscurrents: Technicals as the Compass
The 1H vs. 4H Divergence
The most compelling aspect of the current XAGUSD chart is the divergence in signals across different timeframes. The 1-hour chart, often favored by short-term traders and scalpers, shows a relatively neutral-to-bullish bias, with RSI at 49.58 and a positive MACD. However, this picture is sharply contrasted by the 4-hour and daily charts. The 4-hour timeframe clearly indicates a bearish trend (ADX 42.42, RSI 38.76), while the daily chart, despite a weaker ADX (12.68), also leans bearish with RSI at 47.14. This conflict suggests that while short-term traders might find tactical opportunities to the upside, the medium-term trend is decidedly down. For a sustained rally, bulls need to overcome the bearish signals on the 4-hour and daily charts, which requires breaking through significant resistance levels. The immediate resistance cluster at $81.01, $81.30, and $81.52 on the 1H chart represents a formidable barrier. Conversely, a break below $80.51 on the 1H chart would align with the broader bearish trend, potentially accelerating declines towards $80.29 and $80.01.
The ADX Story: Trend Strength Matters
The Average Directional Index (ADX) provides critical insight into the strength of the prevailing trend. On the 1-hour chart, the ADX is at 26.91, suggesting a strong trend, though the direction is mixed with the overall signal being 'Sell'. However, the 4-hour ADX jumps to 38.63, confirming a strong bearish trend. This is a significant observation. A strong ADX reading above 25 generally indicates a trending market, and in this case, the trend is confirmed as bearish on the 4-hour timeframe. The daily ADX at 12.68 suggests a weak trend, which might imply a period of consolidation or a potential reversal is possible. However, given the strong bearish signals on the 4-hour chart, the weak daily trend might simply be a pause before the next directional move. The bulls would need to see the ADX on the 4-hour chart consistently drop below 25 and the daily ADX pick up strength in an upward direction to confirm a sustained trend change. Until then, the strong bearish ADX on the 4-hour chart is a significant impediment to any bullish aspirations.
The Verdict: A Bearish Wobble Demands Caution
The Path Forward: Levels to Watch
Considering the conflicting signals, the most prudent approach for traders is to acknowledge the bearish dominance on the 4-hour and daily charts, while remaining aware of potential short-term bounces. The current price of $80.58 sits precariously close to the 1-hour support at $80.51. A decisive break below this level would likely trigger a move towards $80.29 and $80.01, aligning with the broader bearish sentiment. On the upside, reclaiming the 1-hour resistance at $81.01 is the first hurdle. However, for a true bullish reversal, price needs to decisively break above the 4-hour resistance at $81.30 and ideally challenge the $81.52 level. The daily resistance at $81.60 also looms large. The ADX readings strongly suggest that the prevailing trend on the 4-hour chart is bearish, and this often dictates the market's direction for swing traders.
Trade Recommendation: A Bearish Bias with Defined Risk
Given the technical picture, a bearish bias seems more probable, but with a clear understanding of the risks involved. The strength of the bearish trend on the 4-hour chart, supported by RSI and MACD readings, suggests that further downside is likely. However, the conflicting signals on shorter timeframes and the overall market uncertainty mean that a direct short position requires careful risk management.
Scenario A: Bearish Continuation
60-65% ProbabilityScenario B: Bullish Reversal Attempt
35-40% ProbabilityThe key is to wait for confirmation. A break below $80.51 on the 1-hour chart would be the trigger for a bearish trade, targeting $80.29 and then $80.01. The stop loss would be placed above the immediate resistance of $81.01. Conversely, if price manages to consolidate and break above $81.01, it could signal a short-term bullish reversal, targeting $81.30 and $81.52. However, given the stronger bearish signals on longer timeframes, this bullish scenario appears less probable at this juncture. Traders should remain vigilant, manage risk tightly, and wait for clear signals before committing capital. The market always provides another opportunity.
The Broader Context: DXY and Equities
To fully appreciate the movements in XAGUSD, we must consider its correlation with broader market forces. The Dollar Index (DXY) is currently trading around 99.66, showing a slight decline on the day. However, the 4-hour and daily charts indicate a strong upward trend for the dollar. A strengthening dollar typically exerts downward pressure on silver, as it becomes more expensive for holders of other currencies. The current DXY pullback might be offering some temporary relief to silver, but the underlying bullish trend for the dollar is a significant headwind for the metal. On the equity front, the SP500 is showing a daily bearish trend (ADX 39.23) despite a recent uptick, while the Nasdaq 100 also displays a bearish daily trend (ADX 31.61). This risk-off sentiment in equities could, in theory, boost demand for safe-haven assets like silver. However, the conflicting signals - a strong dollar trend versus bearish equities potentially supporting safe havens - create a complex environment. The bears might argue that even if equities fall, the stronger dollar could negate any safe-haven benefit for silver, especially if inflation fears recede temporarily due to falling oil prices, as suggested by the WTI pullback below $95.
Traders should be aware of potential volatility surrounding economic data releases. While no major high-impact events are scheduled in the immediate 24-hour window for major currencies directly impacting XAGUSD, shifts in geopolitical narratives or unexpected inflation data could rapidly alter the market's direction. Always maintain strict risk management protocols.
The Role of Inflation and Geopolitics
The narrative around inflation remains a key driver for silver. As long as inflation remains elevated or shows signs of resurgence, silver's appeal as an inflation hedge will persist. The recent news about Brent crude falling 5% today, and WTI crude oil falling below $95 after hitting $101, might temporarily dampen inflation expectations. However, the underlying geopolitical tensions, particularly in the Middle East, continue to pose a risk to energy supplies and could reignite inflationary pressures. Japan tapping strategic reserves adds another layer to the energy market complexity. The bulls will be watching for any signs of renewed escalation in the Strait of Hormuz or other critical regions, which would likely send oil prices soaring again and bolster the case for silver. Conversely, a sustained de-escalation of geopolitical tensions could ease inflation concerns, potentially reducing the demand for silver as a hedge and allowing the bearish technicals to take full effect. The market is currently caught between these competing forces, leading to the indecisive price action around $80.58.
Frequently Asked Questions: XAGUSD Analysis
What happens if XAGUSD breaks below the $80.51 support level, as suggested by the 4H chart?
A break below $80.51 would align with the dominant bearish trend indicated by the 4-hour chart's ADX of 42.42. This could trigger a move towards the next support at $80.29, and potentially test the $80.01 level. The bears would see this as confirmation of further downside potential.
Should I consider buying XAGUSD at current levels near $80.58 given the mixed signals?
Caution is advised. While the 1-hour chart shows some bullish potential, the stronger bearish signals on the 4-hour and daily charts suggest waiting for a clearer confirmation. A confirmed break above $81.01 resistance would be a more reliable bullish entry trigger, whereas a break below $80.51 would favor short positions.
Is the RSI at 46.12 on the 1H chart a sell signal for XAGUSD?
An RSI of 46.12 on the 1-hour chart is in the neutral zone but shows a slight downward eğilim, which aligns with the bearish bias. While not yet oversold, it suggests that momentum is not strongly bullish. Bears would prefer to see it dip further towards 30, while bulls need it to climb and break above 50 to signal a shift.
How will the current DXY trend around 99.66 affect XAGUSD this week?
The DXY's strong upward trend on the 4H and daily charts (ADX 32.04 and 31.72 respectively) presents a headwind for XAGUSD. A persistently strong dollar typically makes silver more expensive, potentially capping any upside moves. Bulls need to see the DXY falter significantly for silver to gain substantial upward traction.
Track markets in real-time
AI-powered analysis, technical indicators and real-time price data.
Join Our Telegram Channel
Breaking market news, AI analysis and trading signals instantly.
Join Channel