EURUSD Tests $1.14933 Resistance: Bull vs. Bear Battle Intensifies
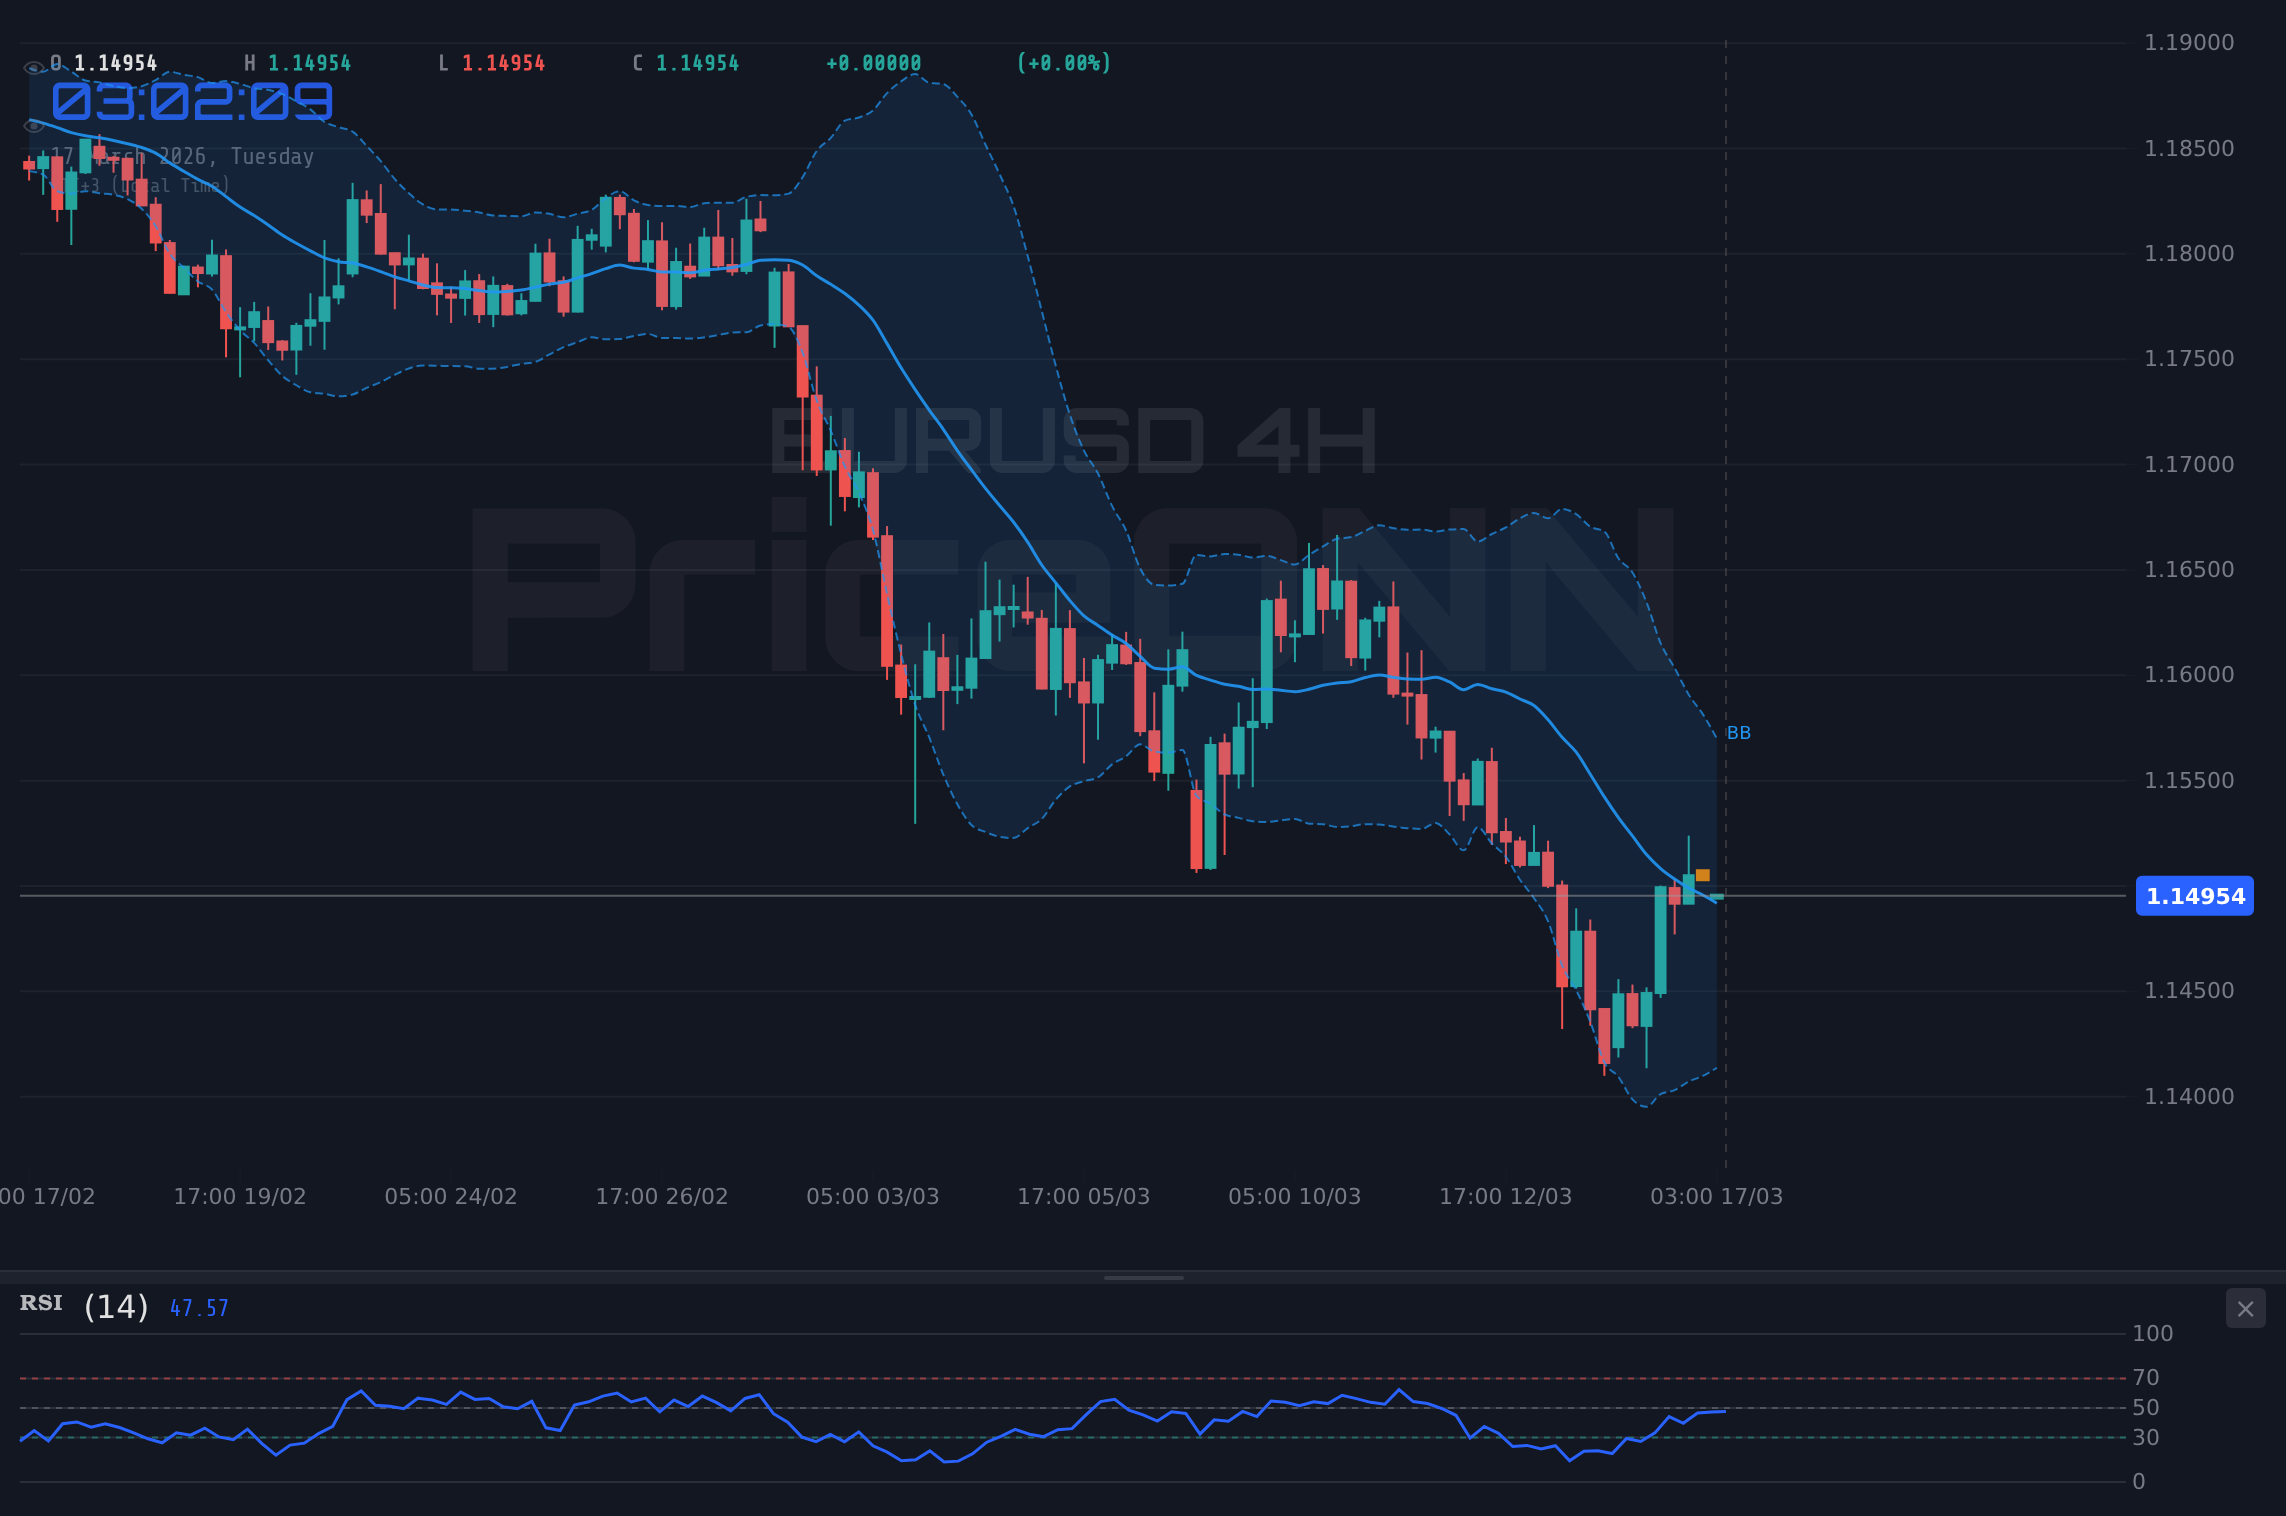
EURUSD hovers near $1.14933, caught between bullish momentum and bearish signals. Technicals show a critical juncture as traders await economic catalysts.
Is the recent upward push in EURUSD a genuine recovery, or just a temporary reprieve before the bears reassert control? The pair is currently dancing around the key resistance level of $1.14933, a price point that has historically acted as a battleground for bulls and bears. This critical juncture demands a closer look at the conflicting signals flashing across multiple timeframes, as traders weigh the potential for a sustained rally against the ever-present risk of a renewed downturn. The macroeconomic landscape, painted with broad strokes of geopolitical uncertainty and diverging central bank policies, adds another layer of complexity to an already tense technical picture. Understanding the interplay between these forces is paramount for anyone looking to navigate the choppy waters of the EURUSD market in the coming days.
- EURUSD is testing resistance at $1.14933, with the 1-hour RSI at 57.68 indicating upward momentum but not yet overbought territory.
- On the 4-hour chart, the ADX at 34.8 signals a strong trend, but conflicting signals from Stochastic and RSI suggest caution.
- The daily chart shows a bearish trend (ADX 34.84), with support identified at $1.13743 and resistance at $1.14933, highlighting a tight range.
- The US Dollar Index (DXY) is showing mixed signals on shorter timeframes but a strong bullish trend on the daily (65.74 RSI), potentially capping EURUSD upside.
The Bull Case: A Tentative Rebound or a Trap?
The bulls are certainly trying to make their presence felt, evidenced by the recent upward price action that has brought EURUSD to the doorstep of the $1.14933 resistance. On the 1-hour chart, the picture offers some encouragement. The Relative Strength Index (RSI) sits at 57.68, comfortably within the neutral zone but trending upwards, suggesting that buyers are gaining some traction without triggering immediate overbought warnings. Furthermore, the Moving Average Convergence Divergence (MACD) on this timeframe shows positive momentum, with the MACD line holding above its signal line. This technical configuration, combined with a Stochastic oscillator that has recently crossed bullishly (%K above %D), paints a picture of a market that is attempting to shake off recent lows. The Average Directional Index (ADX) on the 1-hour chart, while not indicating a raging bull market, shows a trend strength of 28.59, suggesting that the current move has some legs. This could be interpreted as an early sign that the downward pressure might be easing, paving the way for a more sustained recovery, especially if key economic data releases provide a boost to the Euro.
The strength of the US Dollar, as measured by the DXY, also presents a mixed bag that bulls can exploit. While the DXY shows a robust bullish trend on the daily chart (RSI 65.74), its shorter-term timeframes (1H and 4H) display more neutral to bearish tendencies. This divergence suggests that the dollar's upward momentum might be pausing, creating a window of opportunity for EURUSD to push higher. If the European Central Bank (ECB) manages to project a more hawkish stance in upcoming communications, or if key economic indicators from the Eurozone surprise to the upside, it could provide the necessary catalyst for EURUSD to break through the $1.14933 resistance. The 1-hour overall signal of BUY (6, Sat: 2, Nötr: 0) further bolsters the argument that short-term momentum is leaning positive, offering a potential entry point for traders anticipating a move towards higher resistance levels. The critical resistance at $1.15027 and subsequent levels at $1.15072 and $1.15100 become the next logical targets if the bulls can successfully breach the initial barrier.
Looking at the 4-hour timeframe, the bulls find some solace in the Stochastic oscillator, which is showing a bullish signal with %K at 83.79 and %D at 42.71, indicating a potential upward move from oversold conditions, although it is nearing overbought territory. While the MACD is still showing negative momentum, the fact that the price is trading above the middle Bollinger Band on the 1-hour chart suggests that the immediate pressure might be easing. The key is to watch for confirmation. A decisive break above $1.14933, ideally with increasing volume, would be the signal bulls are waiting for. Such a move could target the next resistance at $1.15027, and potentially extend towards $1.15167 if momentum carries through. The underlying strength of the trend, indicated by the ADX on the 4-hour chart at 34.8, suggests that if a breakout occurs, it could be significant. However, the daily chart's overall bearish signal (Al: 0, Sat: 8, Nötr: 0) serves as a stark reminder that this bullish push might be against a stronger prevailing trend, making a sustained breakout a challenging prospect.
The Bear Case: Prevailing Downtrend and Macro Headwinds
Despite the short-term flickers of life, the bears have a compelling argument rooted in the broader technical picture and significant macroeconomic headwinds. The daily chart paints a rather bleak scenario for the Euro. The trend is decidedly bearish, with an ADX reading of 34.84 signaling a strong downward move. The RSI(14) at 34.98 is firmly in the oversold territory, suggesting ample room for further downside before any significant oversold bounce might occur. The MACD is also firmly below its signal line, confirming negative momentum. Crucially, the price action is consistently trading below the middle Bollinger Band on the daily chart, indicating a bearish bias. The Stochastic oscillator is also giving a bearish signal (%K at 13.49, %D at 22.47), reinforcing the idea that the path of least resistance is downwards. The immediate support level to watch is $1.13743, followed by $1.13326. A break below these levels would likely trigger further selling pressure.
The 4-hour chart, while showing some mixed signals, ultimately leans bearish. The overall signal is SELL (Al: 3, Sat: 5, Nötr: 0). Although the Stochastic is showing a bullish signal, the RSI is at 48.1, indicating a lack of conviction from buyers, and the MACD remains in negative territory. The ADX at 34.8 confirms a strong trend, and the price is hugging the lower Bollinger Band, which often precedes further declines. The proximity of the current price to the significant daily resistance at $1.14933 is also a major concern for bulls. This level has already been tested multiple times, and the failure to decisively break above it on the daily chart suggests strong selling interest resides there. The current upward move could simply be a 'dead cat bounce' within a larger downtrend, a common pattern before a steeper decline.
Geopolitical tensions, particularly those stemming from the Middle East and impacting energy prices, continue to cast a long shadow. Recent news reports highlight escalating tensions and their effect on oil prices, with WTI crude experiencing significant pullbacks despite earlier spikes. This volatility in energy markets often translates into broader market uncertainty, which typically favors the US Dollar as a safe-haven asset. The DXY, despite short-term wobbles, shows a strong daily uptrend. A strengthening dollar makes it more expensive for holders of other currencies, including the Euro, to purchase dollar-denominated assets, thereby pressuring EURUSD. The breaking news regarding the EU grappling with an energy crisis further amplifies these concerns, suggesting potential economic weakness within the Eurozone that could undermine the single currency. The Forex macroeconomic factors for March 2026 data suggest that global economic uncertainty is a key driver, and the Euro is particularly vulnerable to such conditions.
Furthermore, the economic calendar presents potential risks for the Euro in the coming days. While specific data releases are not detailed here, the general sentiment points towards caution. Any signs of persistent inflation in the Eurozone could lead to expectations of further ECB tightening, but this could also stifle economic growth. Conversely, weaker-than-expected economic data from the Eurozone could quickly extinguish any bullish sentiment and send EURUSD lower. The 'eurusd forecast australian financial review march 2026' keyword intelligence suggests that global economic data and its interpretation by major financial publications are crucial factors influencing the pair's direction. The current setup, with EURUSD hovering at resistance and facing significant macro headwinds, presents a high-risk environment for bulls. The prevailing bearish trend on the daily chart, coupled with the strength of the DXY, makes a downside move the more probable scenario in the medium term.
The Technical Verdict: A Precarious Resistance Test
Analyzing the confluence of indicators across different timeframes provides a clearer, albeit complex, picture. The 1-hour chart offers the most bullish signals, with a BUY consensus and positive momentum in RSI and MACD. However, this is often the timeframe where short-term noise and volatility can be most misleading. The Stochastic oscillator showing a bearish crossover is a crucial counter-signal here. The 4-hour chart presents a more balanced, yet leaning bearish, view. The ADX at 34.8 indicates a strong trend, but the conflicting signals from RSI (neutral/down) and Stochastic (bullish) create ambiguity. The fact that the price is trading below the middle Bollinger Band on this timeframe is a red flag for bulls.
The daily timeframe is where the bears seem to hold the upper hand. The strong bearish trend (ADX 34.84), oversold RSI, negative MACD, and price action below the daily middle Bollinger Band all point towards further downside potential. The Stochastic is also bearish. This daily picture is significant; it represents the longer-term sentiment and is harder to overcome than short-term fluctuations. The strength of the DXY on the daily chart further supports the bearish outlook for EURUSD. While the Euro might find temporary strength due to short-term dollar weakness or positive intraday momentum, the overarching daily trend and the macroeconomic environment suggest that upside may be capped.
The critical level remains $1.14933. A sustained close above this on the daily chart, confirmed by bullish divergence on indicators and a weakening DXY, would be needed to invalidate the bearish thesis. Until then, the risk remains skewed to the downside. The market is essentially at a crossroads. The bulls need to prove that the current momentum can overcome the established daily downtrend and the strong overhead resistance. The bears, conversely, are looking for confirmation that the previous resistance level will hold firm, leading to a rejection and a move towards the established support levels, particularly the daily support at $1.13743.
Trade Setup: Navigating the EURUSD Resistance
Given the current technical landscape, the EURUSD presents a challenging but potentially rewarding trading opportunity. The proximity to significant daily resistance at $1.14933, coupled with conflicting signals across timeframes, suggests a high-risk, high-reward scenario. The prevailing daily downtrend and the strength of the DXY on longer timeframes lend weight to the bearish case, while intraday momentum offers a glimmer of hope for the bulls. The key is to align trades with the dominant trend while respecting crucial price levels.
For traders looking to capitalize on the bearish sentiment, a short entry could be considered on a clear rejection of the $1.14933 resistance. The trigger would be a daily close below this level, or a decisive break below the 1-hour support at $1.14926. The invalidation level would be a strong daily close above $1.15100, suggesting the bulls have taken control. The primary target for a bearish trade would be the daily support at $1.13743, with a secondary target at $1.13326. This setup offers a favorable risk-to-reward ratio if the bears successfully defend the resistance. The probability of this scenario playing out, given the daily technicals and macro headwinds, is estimated at 60-65%.
Alternatively, for the more aggressive bulls, a long position could be initiated on a confirmed breakout above $1.14933. The trigger would be a 4-hour or daily close decisively above $1.15041 (the 4-hour resistance). The invalidation level would be a close back below the 1-hour support at $1.14881. The primary target for a bullish trade would be the 4-hour resistance at $1.15167, with a secondary target at $1.15302. This trade carries higher risk due to the prevailing daily downtrend, and its success hinges on significant positive catalysts. The probability for a sustained bullish breakout is currently estimated at 35-40%, making it the less probable scenario based on the current data.
Scenario A: Bearish Rejection at $1.14933
60-65% ProbabilityScenario B: Bullish Breakout Above $1.15041
35-40% ProbabilityTraders should be aware of potential volatility around key economic data releases, particularly those impacting US Dollar strength or Eurozone economic outlook. Geopolitical developments in the Middle East also remain a significant wildcard, potentially driving safe-haven flows and impacting currency pairs like EURUSD.
Frequently Asked Questions: EURUSD Analysis
What happens if EURUSD breaks decisively above the $1.14933 resistance level?
A confirmed break above $1.14933, especially with a 4-hour or daily close above $1.15041, would invalidate the bearish thesis. This would likely trigger a move towards the 4-hour resistance at $1.15167, with a secondary target at $1.15302. Bulls would need to see sustained momentum and potentially a weaker DXY to confirm this upward move.
Should I consider shorting EURUSD at current levels near $1.14933 given the daily bearish trend?
Shorting EURUSD at current levels near $1.14933 is a high-risk strategy but aligns with the prevailing daily downtrend. A high-probability entry would be on a confirmed rejection of this resistance, ideally with a daily close below $1.14926. Invalidation would occur on a close above $1.15100, with targets at $1.13743 and $1.13326. This strategy has an estimated 60-65% probability.
Is the RSI at 57.68 on the 1-hour chart a buy signal for EURUSD?
An RSI of 57.68 on the 1-hour chart indicates upward momentum but is not yet considered overbought. While it supports the short-term bullish argument, it's crucial to consider it alongside other indicators and timeframes. The daily chart's bearish trend and the resistance at $1.14933 temper the bullish implications of this RSI reading. Confirmation of a sustained move higher would be needed.
How might upcoming economic data impact EURUSD around the $1.14933 level?
Upcoming economic data, particularly from the Eurozone or US, could be the catalyst for a decisive move. Stronger-than-expected Eurozone data could fuel a breakout above $1.14933, targeting higher levels. Conversely, weak data or hawkish signals from the Fed (potentially reflected in DXY strength) could lead to a rejection of resistance and a move towards daily support near $1.13743. Traders should monitor releases closely for volatility.
The battle lines are clearly drawn around the $1.14933 mark for EURUSD. While short-term momentum may offer enticing opportunities for bulls, the longer-term technical picture and prevailing macroeconomic headwinds lean towards a bearish bias. Patience and disciplined risk management will be key. Waiting for clear confirmation of either a sustained breakout above resistance or a definitive rejection and continuation of the downtrend will be crucial for navigating this complex market environment. The market always offers a second chance, and waiting for the right setup is paramount.
Track markets in real-time
AI-powered analysis, technical indicators and real-time price data.
Join Our Telegram Channel
Breaking market news, AI analysis and trading signals instantly.
Join Channel