USDJPY Tests $159.36 Resistance: Bullish Trend Holds Firm
USDJPY hovers near $159.36 resistance. Analysis shows a strong bullish trend despite mixed short-term signals, with key levels to watch.
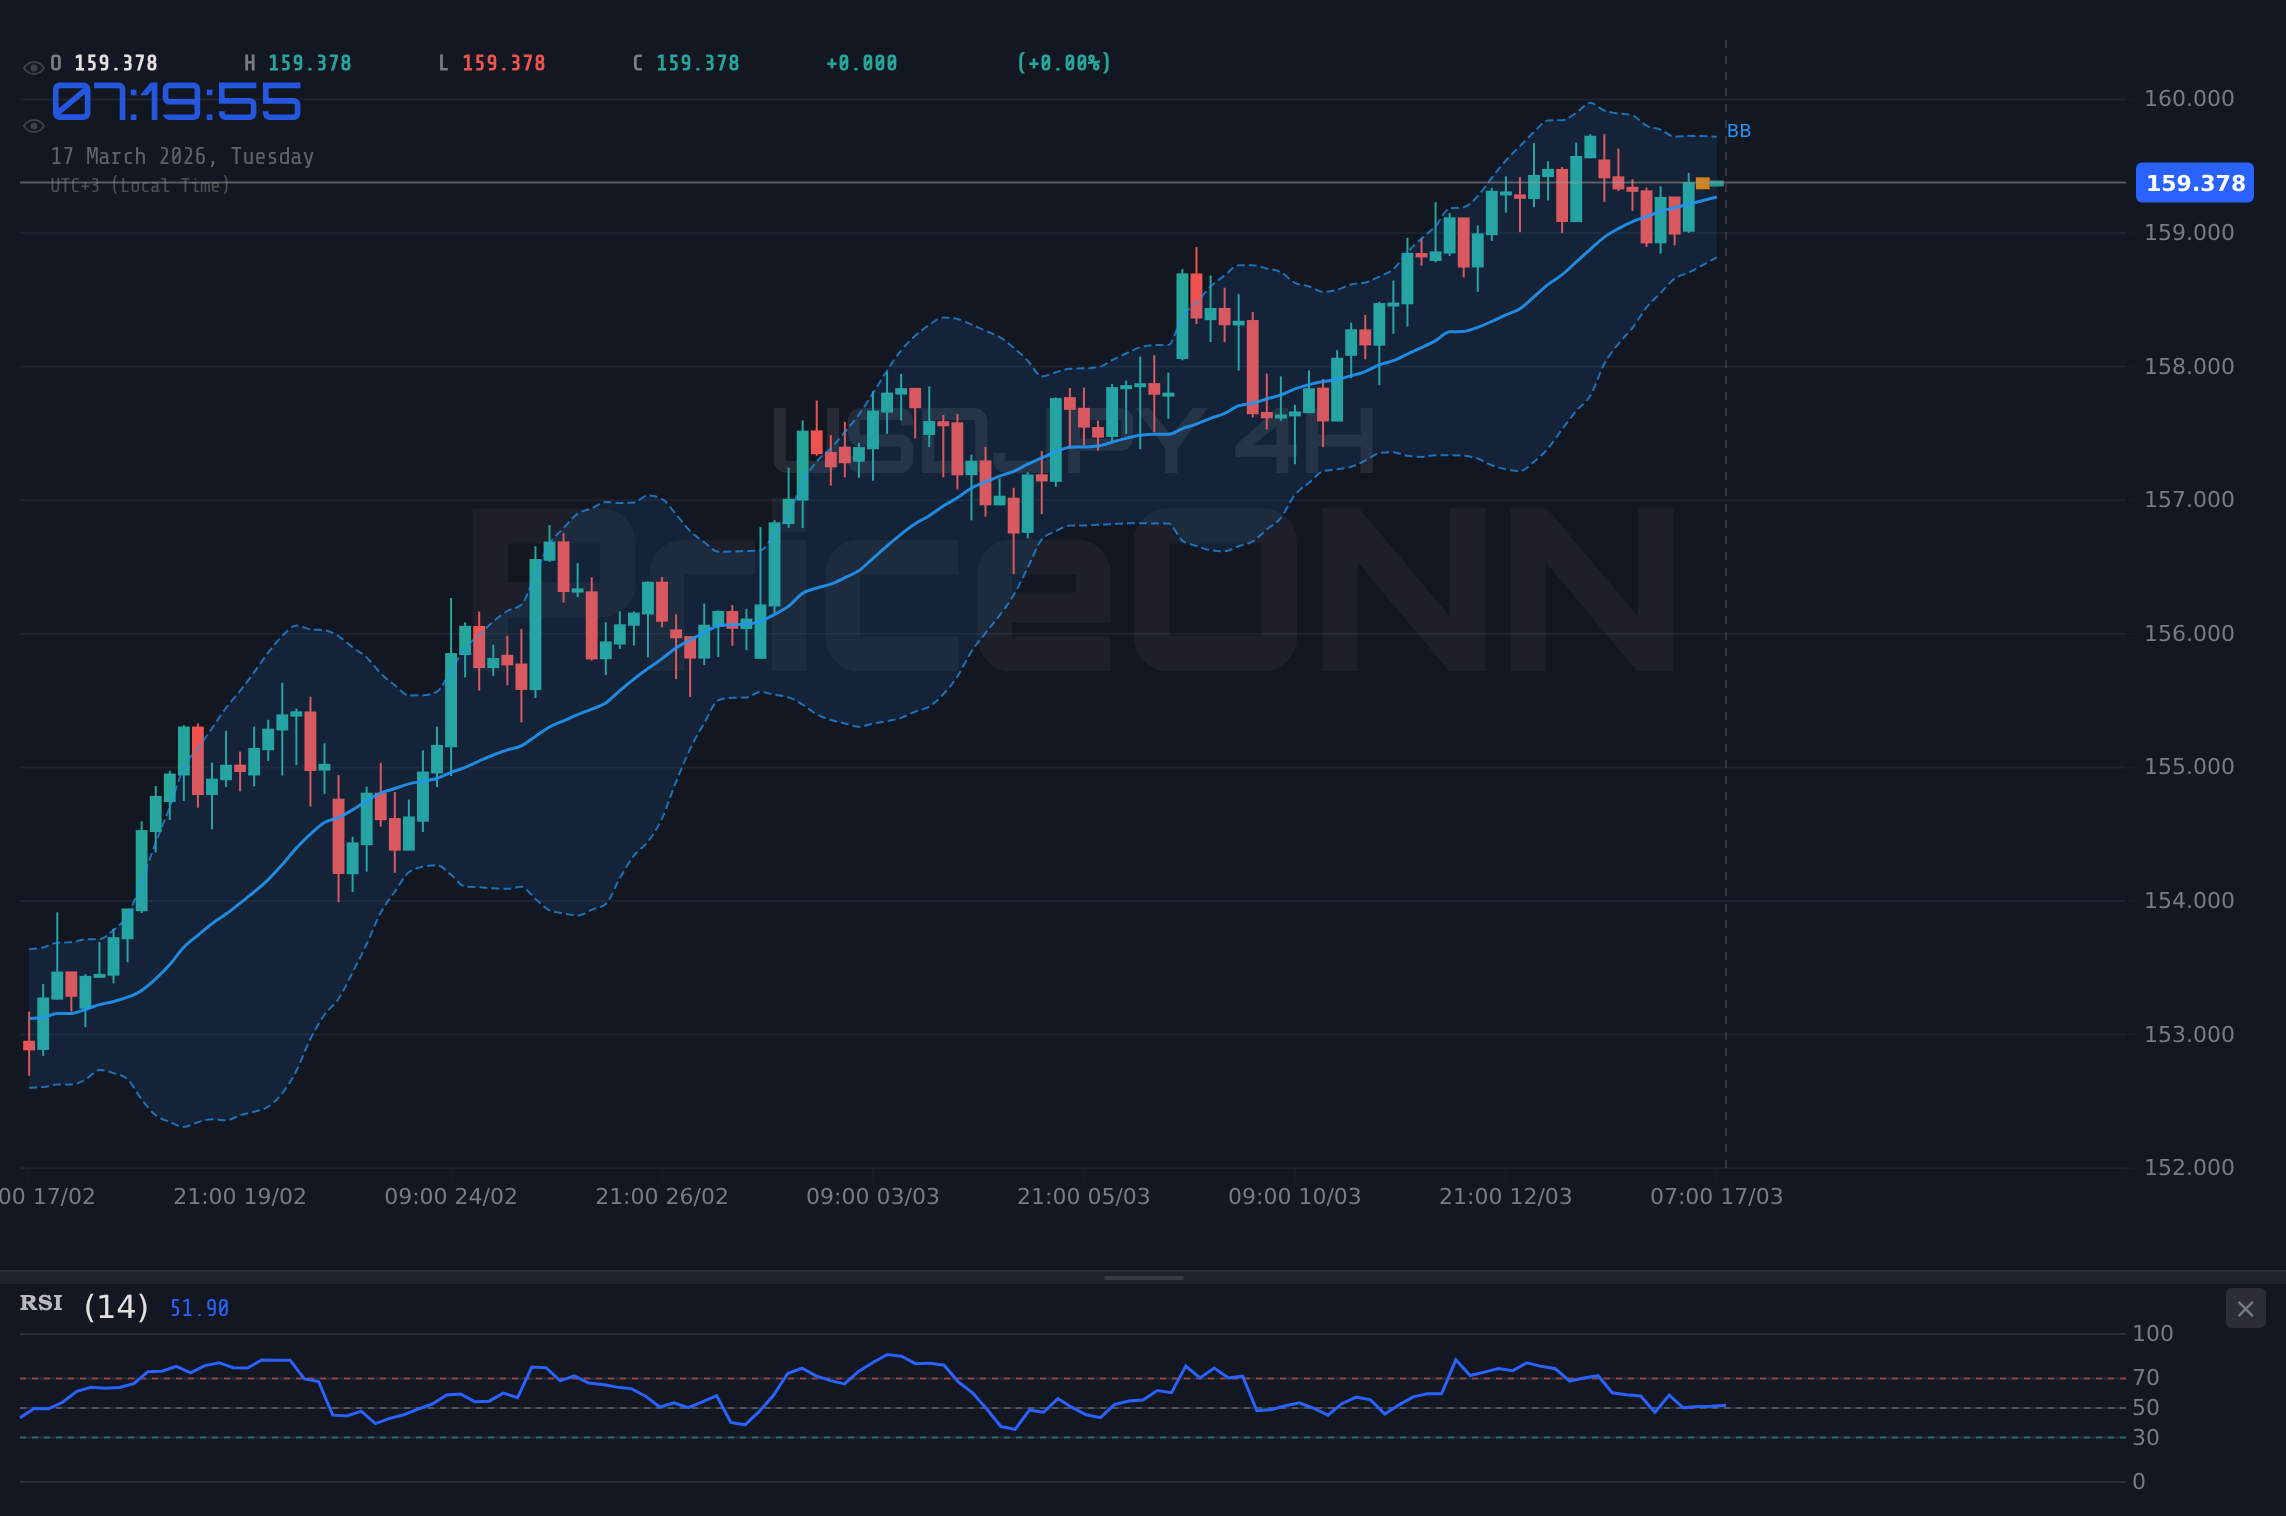
The USDJPY pair is currently navigating a critical juncture, trading at precisely $159.36. This level represents a significant resistance point that has been tested, and the market is now watching closely to see if the established bullish trend can maintain its momentum or if a pullback is imminent. With the Dollar Index (DXY) showing strength at 99.68, the interplay between the yen and the dollar is under intense scrutiny. This dynamic is crucial for traders looking to understand the underlying forces driving USDJPY's recent price action and its potential future direction. The current trading environment demands a nuanced approach, balancing the persistent bullish undertones with the immediate overhead resistance.
- USDJPY is currently trading at $159.36, testing a key resistance level.
- The 1-Day chart shows a strong bullish trend (97% power) with RSI at 65.29, indicating upward momentum.
- Immediate resistance is identified at $159.417 (1H), while support lies at $159.306.
- The Dollar Index (DXY) is strong at 99.68, supporting USDJPY's upward bias.
- Despite short-term mixed signals, the overall trend remains bullish, suggesting potential for further upside if resistance breaks.
Navigating the $159.417 Hurdle: A Technical Perspective
Looking at the 1-hour chart, USDJPY is showing signs of consolidation as it approaches the immediate resistance at $159.417. The RSI(14) is hovering at 54.74, suggesting a neutral stance but with a slight upward bias, implying that buyers are still present but not overwhelming. The MACD indicator on this timeframe is showing positive momentum, with the MACD line above its signal line, which typically signals potential for further upward movement. However, the Stochastic Oscillator, with K at 83.96 and D at 65.51, is deep in overbought territory, indicating that a short-term pullback or consolidation is possible before any significant move. This divergence between MACD's positive momentum and Stochastic's overbought condition creates a degree of uncertainty in the immediate outlook. The ADX at 26.07 suggests a moderately strong trend, but the overall signal mix on the 1-hour chart leans towards caution, with a general Buy signal from the technical indicators.
The Bollinger Bands on the 1-hour chart are positioned above the middle band, reinforcing the bullish inclination. However, the Stochastic's extreme readings are a classic warning sign that the market might be due for a pause or a minor correction. This scenario is further complicated by the fact that the 4-hour chart presents a slightly different picture. While the overall trend is still considered neutral (50% power), the RSI(14) at 56.96 suggests continued upward momentum. The MACD here is showing negative momentum, which contradicts the 1-hour signal, and the Stochastic oscillator (K=40.35, D=40.28) is in neutral territory, just above the crossover point. The ADX on the 4-hour timeframe is lower at 16.52, indicating a weaker trend, which aligns with the neutral trend power.
This conflict in signals between the shorter timeframes highlights the importance of the daily chart for a clearer directional bias. The daily timeframe for USDJPY paints a decisively bullish picture. The trend is classified as 'Yükseliş' (Bullish) with a formidable 86% power. The RSI(14) is at a healthy 65.29, firmly in the bullish zone and indicating sustained buying pressure without being excessively overbought. The MACD is also showing positive momentum, with the MACD line comfortably above its signal line. Bollinger Bands are trading above the middle band, confirming the upward trajectory. The Stochastic oscillator, with K at 88.42 and D at 87.05, is indeed in the overbought zone, but in a strong uptrend, this can persist for extended periods. The ADX at 22.57 suggests a moderately strong uptrend, further solidifying the bullish case. The confluence of these daily indicators strongly suggests that the prevailing trend is upwards, and any short-term pullbacks might be opportunities to enter the market on the long side.
The Dollar's Ascent and Yen's Weakness: A Tale of Two Currencies
The strength of the US Dollar Index (DXY) at 99.68 is a significant tailwind for USDJPY. As the DXY strengthens, it typically exerts downward pressure on currencies like the Japanese Yen, which is often seen as a safe-haven asset. The current DXY reading suggests a robust dollar, which aligns perfectly with the bullish outlook for USDJPY. This correlation is not merely coincidental; it's a fundamental driver of the pair's movement. When the US dollar gains strength across the board, as indicated by the DXY's upward move, pairs like USDJPY tend to follow suit, reflecting the broader market sentiment towards the greenback.
The geopolitical landscape also plays a subtle but important role. Recent news highlights escalating tensions in the Middle East, which historically can lead to increased demand for safe-haven assets. However, in this specific instance, the market seems to be prioritizing the strength of the US dollar, possibly driven by interest rate differentials or expectations. While oil prices have seen volatility, with WTI experiencing both spikes and dips due to geopolitical events, the overarching narrative for USDJPY seems to be dominated by the dollar's strength rather than a flight to safety that would typically benefit the Yen. The fact that USDJPY is pushing higher despite some safe-haven flows suggests that the bullish dollar sentiment is currently the dominant factor.
Furthermore, the economic calendar provides context for the dollar's resilience. While specific upcoming events like Fed decisions are always critical, the general market anticipation of monetary policy divergence between the US and Japan continues to support USDJPY. The Bank of Japan has maintained an ultra-loose monetary policy, while the Federal Reserve has shown a more hawkish stance, even if pauses are considered. This interest rate differential is a powerful engine for carry trades, where investors borrow in a low-interest-rate currency (like the JPY) to invest in a higher-interest-rate currency (like the USD). This structural demand for USDJPY can underpin its price even in the face of minor headwinds.
While the daily trend is strongly bullish, the mixed signals on the 1-hour chart, particularly the overbought Stochastic, suggest that traders should be wary of chasing price at current levels. A short-term pullback towards the $159.306 support level is a distinct possibility before the pair can decisively break the $159.417 resistance. Patience and disciplined risk management are key.
Analyzing Key Levels: Where Does USDJPY Go Next?
The immediate price action hinges on the battle at the $159.417 resistance level on the 1-hour chart. A decisive break and hold above this level could open the door for further upside, targeting the subsequent resistance at $159.528. On the other hand, failure to overcome this hurdle could lead to a retracement. The nearest support on the 1-hour chart is at $159.306, followed by $159.254. A break below these levels would signal a potential short-term shift in momentum, perhaps invalidating the immediate bullish setup and leading to a test of lower supports.
Zooming out to the 4-hour timeframe, the support levels are more pronounced, situated at $158.847, $158.697, and crucially, $158.488. These levels become more significant if the short-term bullish momentum falters. The resistance on the 4-hour chart is at $159.206, then $159.415, and a more substantial barrier at $159.565. Breaking above the $159.565 resistance on this timeframe would signal a more robust continuation of the bullish trend.
The daily chart provides the broader context, with key support identified at $158.647, followed by $158.299 and $157.752. These are significant levels that would need to be breached to challenge the overall bullish trend. On the upside, the daily resistance levels are at $159.542, then $160.089, and a psychological milestone at $160.437. A sustained move above $160.437 would signal a significant acceleration of the bullish momentum, potentially attracting more buyers and extending the trend further.
Considering the current price of $159.36, the immediate focus is on the 1-hour resistance at $159.417. A breakout here is the most bullish short-term signal. However, the overbought Stochastic on the 1-hour chart warrants caution. If price fails to break $159.417 and pulls back, the 1-hour support at $159.306 and $159.254 become critical short-term indicators of strength. A hold above these levels would keep the bullish bias intact. A decisive break below $159.195 (1H support) would start to question the immediate upside potential, bringing the 4-hour supports into play.
Market Sentiment and Correlation: DXY and Equities
The Dollar Index (DXY) is currently trading at 99.68, showing a strong upward trend on the daily chart with 97% power. This is a crucial factor supporting USDJPY's bullish outlook. A rising DXY often correlates inversely with the Japanese Yen, meaning as the dollar strengthens, the yen tends to weaken, pushing USDJPY higher. The RSI(14) on the DXY is at 65.81, indicating a healthy bullish momentum without being excessively overbought, and the MACD confirms positive momentum. This strong dollar environment provides a solid foundation for USDJPY's upward trajectory.
The performance of major equity indices also offers insights into market sentiment. The SP500 is currently trading at 6679.9, and the Nasdaq 100 is at 24568.26, both showing a daily trend classified as 'Düşüş' (Bearish) with 100% and 91% power respectively. This indicates a risk-off sentiment in the broader equity markets. Typically, a risk-off environment might lead to a flight to safety, which could benefit the Japanese Yen. However, the strong bullish trend in USDJPY, driven by dollar strength, seems to be overriding this safe-haven dynamic for the Yen. This divergence suggests that the currency-specific drivers for USDJPY are currently more potent than the general risk sentiment.
The correlation between USDJPY and the equity markets is complex. While a strong dollar can sometimes coincide with rising equity markets (risk-on), the current situation shows a strong dollar and a weakening equity market. This could be interpreted in a few ways: either the dollar's strength is driven by factors independent of equity market sentiment (like Fed policy expectations), or the Yen's weakness is more pronounced due to its specific economic conditions and monetary policy divergence from the US. The fact that oil prices have also been volatile, influenced by geopolitical tensions, adds another layer of complexity. However, the consistent bullish signals from the USDJPY daily chart, supported by the DXY's strength, remain the primary focus for this currency pair.
The current market environment, characterized by a strong dollar (DXY at 99.68) and a bearish trend in major equity indices like SP500 and Nasdaq, creates a unique dynamic. While risk-off sentiment might typically favor the Yen, the persistent strength of the USD against most major currencies, including JPY, suggests that interest rate differentials and Fed policy expectations are currently the dominant drivers for USDJPY.
The Path Forward: Scenarios and Considerations
Considering the technical indicators and market correlations, several scenarios can unfold for USDJPY. The most immediate scenario, driven by the daily bullish trend and the strong DXY, is a continuation of the upward move. If USDJPY can decisively break and hold above the 1-hour resistance at $159.417, the next target would be the 4-hour resistance at $159.565. A sustained move above this level would reinforce the bullish thesis and could pave the way for a test of the daily resistance at $159.542, and potentially higher towards $160.089.
However, the overbought conditions on the 1-hour Stochastic oscillator cannot be ignored. A bearish scenario would emerge if USDJPY fails to break the $159.417 resistance and pulls back. In this case, the 1-hour support at $159.306 and $159.254 would be the first levels to watch. A break below these could lead to a test of the 4-hour supports, starting with $158.847. If the bearish momentum gains traction and price breaks below the 4-hour support at $158.488, it would significantly challenge the bullish outlook and could signal a deeper correction towards the daily support at $158.647.
The role of upcoming economic data and central bank commentary cannot be overstated. Any unexpected shifts in Federal Reserve policy expectations or significant developments in Japanese monetary policy could alter the current trend. For instance, a more dovish tone from the Fed than anticipated could weaken the dollar and pressure USDJPY downwards, while any hint of a less accommodative stance from the Bank of Japan could provide support to the Yen. Traders must remain vigilant for these macroeconomic catalysts that could override the current technical picture.
The current ADX readings across timeframes present an interesting dynamic. The daily ADX at 22.57 suggests a moderately strong uptrend, while the 1-hour and 4-hour ADX values (26.07 and 16.52 respectively) indicate varying trend strengths. This variability suggests that while the overall direction is bullish, the conviction behind the move can fluctuate, leading to periods of consolidation or minor reversals. Therefore, confirmation of a sustained breakout above resistance, or a clear hold of support levels during a pullback, will be crucial for establishing higher-probability trades.
From a professional standpoint, the current setup on USDJPY requires a balanced approach. The daily chart's bullish signals are compelling, supported by dollar strength. However, the short-term overbought indicators and the critical resistance at $159.417 demand caution. A patient trader might wait for a confirmed breakout above $159.417 with strong volume, or for a pullback to a clearly defined support level like $159.306, before considering entries. Risk management remains paramount, ensuring that any position taken has a well-defined stop-loss.
Frequently Asked Questions: USDJPY Analysis
What happens if USDJPY breaks decisively above the $159.417 resistance level?
A sustained break above $159.417, especially with increased volume, would likely trigger further bullish momentum. The next key resistance targets would be $159.565 on the 4-hour chart and potentially the daily resistance at $159.542, opening the path towards $160.089.
Should I consider buying USDJPY at current levels of $159.36 given the overbought Stochastic on the 1H chart?
Entering at current levels carries risk due to the overbought Stochastic on the 1-hour chart. A more prudent approach might be to wait for a pullback to support around $159.306 or confirm a breakout above $159.417. This strategy aims for a higher probability entry with better risk-reward.
Is the RSI at 65.29 on the daily chart a strong buy signal for USDJPY?
An RSI of 65.29 on the daily chart is a strong bullish indicator, confirming upward momentum. While not yet in extreme overbought territory (typically above 70), it suggests sustained buying pressure. Combined with other daily indicators, it reinforces the bullish trend, but traders should still seek confirmation on shorter timeframes.
How will potential Fed policy shifts impact USDJPY around the $159.36 level?
Any deviation from expected Fed policy, such as a more hawkish stance, could strengthen the dollar and push USDJPY higher, potentially breaking resistance at $159.417. Conversely, a more dovish signal could weaken the dollar, leading to a pullback towards support levels like $159.306.
| Indicator | Value | Signal | Interpretation |
|---|---|---|---|
| RSI (14) | 65.29 | Bullish | Strong upward momentum on Daily |
| MACD | Positive | Bullish | Above signal line on Daily |
| Stochastic | K:88.42, D:87.05 | Bullish | Overbought on Daily, but trend can persist |
| ADX | 22.57 | Bullish | Moderately strong uptrend on Daily |
| Bollinger Bands | Mid Band Breakout | Bullish | Price above middle band on Daily |
Track markets in real-time
AI-powered analysis, technical indicators and real-time price data.
Join Our Telegram Channel
Breaking market news, AI analysis and trading signals instantly.
Join Channel