DXY Tests Resistance at $99.88: Dollar Holds Firm Amidst Mixed Signals
The DXY Dollar Index hovers near $99.88. With ADX at 31.05 suggesting a strong trend and RSI at 65.77, traders watch for a potential breakout or pullback. Read our analysis.
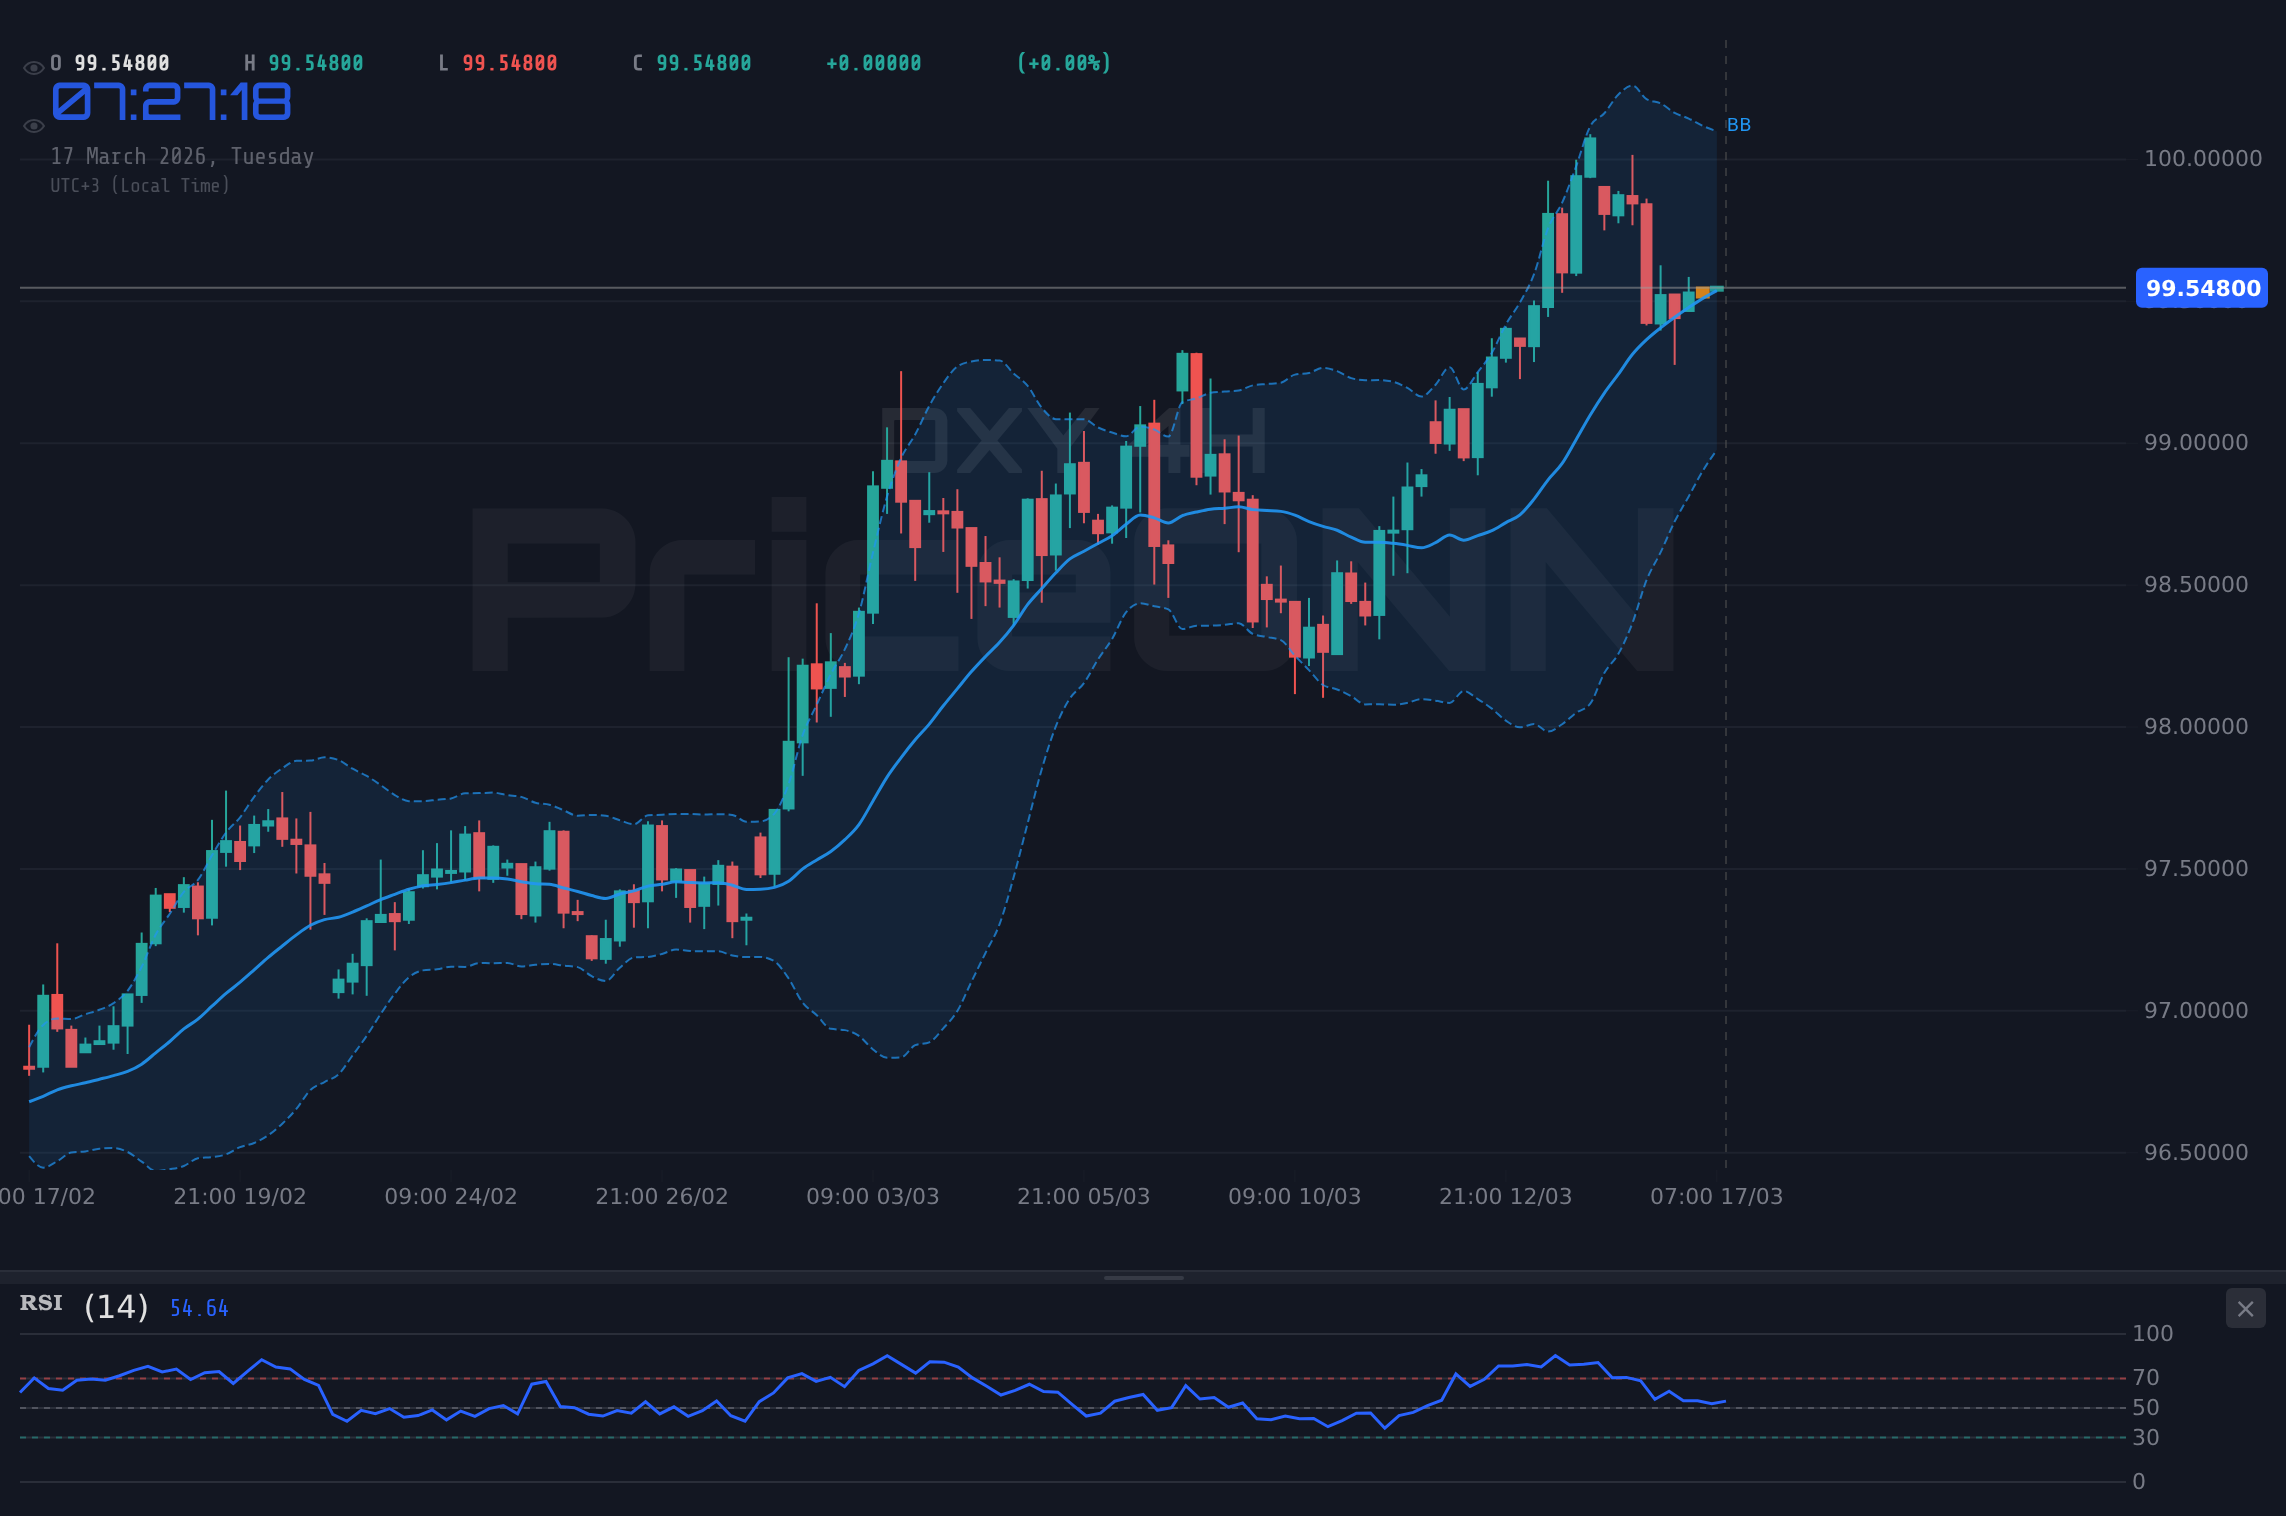
The US Dollar Index (DXY) is currently navigating a critical juncture, trading at precisely $99.67 as of the latest market data. This level, hovering just below the immediate resistance of $99.88, represents a pivotal point for the greenback. With the 1-hour trend showing a slight bearish bias despite a strong overall daily uptrend, and key indicators flashing mixed signals across different timeframes, the DXY is at a crossroads. This analysis delves into the intricate technical landscape, exploring what the current price action and indicator readings suggest for the dollar's immediate future, and outlines a potential trade setup for discerning market participants.
- The DXY Dollar Index is currently trading at $99.67, nearing the 4-hour resistance level of $99.88.
- On the daily chart, RSI stands at 65.77, indicating strong upward momentum but still within the neutral zone, suggesting room for further gains.
- The ADX at 31.05 on the daily timeframe signals a strong trend, while the 1-hour ADX at 23.16 suggests a more moderate trend in the shorter term.
- Conflicting signals from Stochastic oscillators across timeframes require careful entry timing, especially with the 1-hour showing an oversold condition while the daily indicates bullish momentum.
- Key support is identified at $99.51 on the 1-hour chart, while resistance looms at $99.88 and $100.32.
The narrative surrounding the DXY in the last 48 hours has been one of cautious consolidation following a period of strength. While the dollar index did experience a slight dip, as indicated by the recent news mentioning a potential sustainable decline if oil eases below $100, the price action at $99.67 suggests a firming of resolve. The daily chart shows a robust uptrend, with RSI at 65.77, a reading that, while not yet in overbought territory, certainly points towards sustained bullish momentum. This suggests that any short-term pullbacks might be temporary, especially if broader market sentiment shifts towards risk aversion, which historically favors the dollar as a safe-haven asset. The daily ADX at 31.05 further reinforces the idea of a strong underlying trend, giving bulls reason to hold their ground.
However, a closer look at the shorter timeframes reveals a more nuanced picture. On the 1-hour chart, the ADX reading drops to 23.16, indicating a less defined trend, and the Stochastic oscillator is flashing a strong bullish signal with %K at 81.77 and %D at 54.53, suggesting potential for a short-term rally. Yet, the MACD shows momentum is merely balancing, not strongly trending upwards. This divergence between the daily's strong trend signals and the 1-hour's more mixed indicators creates a zone of uncertainty. Traders are thus left in a delicate position, needing to balance the prevailing daily uptrend against the immediate intraday fluctuations and the potential for a short-term reversal or consolidation.
Navigating the Technical Indicators: A Multi-Timeframe Perspective
Delving deeper into the technical indicators provides crucial context for understanding the DXY's current predicament. On the daily chart, the RSI at 65.77 is a key observation. It's comfortably above the 50-midpoint, signaling bullish sentiment, but it's not yet screaming 'overbought,' which could imply there's still room for the dollar to appreciate further. The MACD on the daily timeframe is also in positive territory, with the MACD line above the signal line, reinforcing this upward bias. This alignment suggests that the longer-term trend remains intact and favors buyers.
Contrast this with the 4-hour timeframe, where the picture becomes more complex. The RSI here is at 57.51, still bullish but showing a slight pullback from higher levels, and the MACD is showing negative momentum with the MACD line below the signal line. This could indicate a temporary pause or a minor correction within the larger daily uptrend. The Stochastic oscillator on this timeframe, however, is dipping with %K at 29.02 and %D at 48.53, signaling a potential bearish move or oversold conditions. This conflicting information across daily and 4-hour charts highlights the importance of not relying on a single indicator or timeframe.
The 1-hour chart presents yet another layer of complexity. Here, the RSI sits at 54.13, which is neutral and slightly trending upwards, suggesting intraday buying interest. The Stochastic oscillator is notably in the overbought zone, with %K at 81.77 and %D at 54.53, indicating that the short-term upward momentum might be reaching exhaustion. This is further supported by the ADX, which, at 23.16 on the 1-hour, is in the moderate trend strength territory, a stark contrast to the strong trend indicated by the daily ADX of 31.05. This discrepancy underscores the intraday choppiness and the need for traders to be vigilant about short-term reversals.
Key Levels: The Battleground for the Dollar
The current price of $99.67 is nestled between significant technical levels that are dictating the immediate price action. On the 1-hour chart, immediate support is found at $99.51, followed by $99.48 and $99.46. A break below these levels could signal further intraday weakness. Conversely, resistance on the 1-hour chart is forming around $99.88, with subsequent levels at $100.32 and $100.62. The 4-hour resistance at $99.88 is particularly noteworthy, as it aligns with the 1-hour resistance and represents a key hurdle that the bulls must overcome to maintain upward momentum.
Looking at the daily timeframe, the picture becomes clearer regarding the broader trend. Support lies at $99.14, $98.84, and $98.40. These levels are crucial for defining the longer-term bullish outlook. Should the price decisively break below $99.14, it would negate the immediate bullish sentiment and could trigger a larger correction. The daily resistance is more significant, with the first major hurdle at $99.88, and then a more substantial target at $100.32. Breaking through $100.32 would confirm a continuation of the bullish trend, potentially opening the door for a move towards $100.62 and beyond. The interplay between these intraday and daily levels creates a dynamic trading environment, demanding constant vigilance.
Trade Setup: A Probabilistic Approach to the DXY
Entry Trigger: A confirmed daily close above $99.88, ideally with increased volume. This would signal the overcoming of immediate resistance and validate the daily uptrend.
Target 1: $100.32. This is the next significant resistance level on the daily chart. A break above $99.88 should see price gravitate towards this level.
Target 2: $100.62. This is a more ambitious target, representing a higher high on the daily chart, and would confirm a strong bullish continuation.
Stop/Invalidation: A close below $99.14 on the daily chart. This level represents crucial daily support, and a break below it would invalidate this bullish thesis.
Entry Trigger: Price failing to break above $99.88 on the 4-hour or daily chart, potentially accompanied by bearish divergence on the RSI or MACD.
Target 1: $99.51. This is the immediate 1-hour support level, which would likely be tested if $99.88 holds as resistance.
Target 2: $99.14. This is the more significant daily support level. A break below $99.51 could lead to a test of this crucial floor.
Stop/Invalidation: A decisive break and close above $100.32 would invalidate this bearish outlook.
The current technical picture, with its conflicting signals between short-term and long-term timeframes, suggests a high-probability setup for a ranging market or a breakout scenario. The strong daily trend supported by RSI and MACD, coupled with the ADX suggesting a powerful trend, leans towards a bullish continuation. However, the immediate resistance at $99.88 and the mixed signals on the 1-hour and 4-hour charts introduce a significant probability for a pullback or consolidation. The Stochastic oscillator's extreme readings on the 1-hour chart also warrant caution regarding entry timing. Therefore, a confirmed break above $99.88 is the most attractive bullish setup, while a rejection and subsequent move below $99.51 would open the door for a bearish correction.
Correlation Analysis: The Dollar's Dance with Global Markets
Understanding the DXY's movement requires acknowledging its intricate relationship with other major markets. Currently, with the DXY trading at $99.67 and showing signs of firming up, we observe its ripple effect across other assets. The provided data shows Brent crude oil trading at $103.20 and WTI at $95.87, both on an upward trajectory. Typically, rising oil prices can fuel inflation concerns, which in turn can support a stronger dollar as markets anticipate tighter monetary policy. However, the news mentioning oil prices easing below $100 suggests a potential dampening of inflation expectations, which could, in theory, weigh on the dollar. This creates a complex correlation where the dollar might be supported more by its safe-haven status amidst geopolitical tensions rather than purely inflation expectations.
Furthermore, the performance of major equity indices like the S&P 500 (currently at 6680.5) and Nasdaq 100 (at 24575.25), both showing daily declines, points towards a risk-off sentiment. In such environments, the DXY often finds strength as investors flock to perceived safe-haven assets. This inverse correlation between equities and the dollar index is a well-established market dynamic. The fact that the DXY is attempting to hold its ground, and even rally slightly, while equities are down, reinforces this relationship. If the risk-off sentiment intensifies, we could see further demand for the dollar, pushing it towards its resistance levels.
The forex market also provides critical context. EUR/USD is trading at 1.14925, showing a slight downtrend, which aligns with a stronger DXY. Similarly, USD/JPY is at 159.345, exhibiting an uptrend that supports a stronger dollar. The correlation here is more direct: as the DXY strengthens, these pairs tend to move inversely. The data shows USD/JPY's daily trend as 'Uplift (Strength: 86%)', which is consistent with a robust dollar. Conversely, EUR/USD's daily trend is 'Düşüş (Strength: 98%)', also supporting the dollar's strength. This consistent correlation across major currency pairs reinforces the DXY's current upward bias, despite some intraday choppiness.
The Geopolitical Undercurrent: Fueling Dollar Demand?
Recent news highlights escalating geopolitical tensions in the Middle East, leading to a surge in crude oil prices and disruptions in key shipping lanes. This heightened geopolitical risk is a significant driver for safe-haven assets, and the US Dollar is often a primary beneficiary. While the news also mentions oil prices tumbling below $95 at one point, the underlying geopolitical instability remains a potent factor supporting dollar strength. In times of global uncertainty, investors tend to de-risk from other assets and seek the perceived safety of US Treasury bonds and, by extension, the US Dollar. This 'flight to safety' dynamic can override other fundamental factors, such as inflation expectations or interest rate differentials, in the short to medium term.
The conflict in the Middle East, specifically, has implications for global energy markets and, consequently, inflation. If tensions continue to escalate, oil prices could remain elevated or even surge higher, potentially reigniting inflation fears. This scenario would likely bolster the DXY, as the Federal Reserve might be compelled to maintain a hawkish stance on interest rates to combat rising inflation. The market's reaction to oil price volatility, as seen in the recent swings, indicates that geopolitical events are currently playing a more dominant role in shaping the DXY's trajectory than purely economic data. The dollar's ability to hold its ground near $99.67, despite mixed economic signals, can be partly attributed to its role as a safe haven in this uncertain geopolitical climate.
The recent news regarding the Canadian Dollar's potential rebound due to cooling inflation is also relevant. If inflation continues to moderate in major economies, it could influence central bank policies, potentially leading to a less aggressive monetary tightening cycle. This could, in turn, create opportunities for currencies like the CAD to strengthen against the dollar if the DXY's upward momentum falters. However, for now, the overarching geopolitical risks seem to be providing a more significant tailwind for the dollar, making it a preferred safe-haven currency amidst global instability. The interplay between geopolitical events and economic data will be crucial in determining whether the DXY can sustain its move above the $99.88 resistance.
Looking Ahead: What's Next for the DXY?
The DXY is currently at a critical juncture, trading at $99.67 and facing immediate resistance at $99.88. The daily chart paints a bullish picture with strong RSI and MACD signals, supported by a robust ADX reading of 31.05. This suggests that the underlying trend is upward, and any dips might present buying opportunities. However, the shorter timeframes, particularly the 1-hour chart, show mixed signals and potential for intraday volatility, with Stochastic oscillators in overbought territory and a weaker ADX reading of 23.16. This creates a scenario where a breakout above $99.88 is the most probable continuation, targeting $100.32 and $100.62. Conversely, a failure to break this resistance could lead to a pullback towards daily support at $99.14.
The prevailing geopolitical tensions continue to act as a significant underpinning for the dollar, reinforcing its safe-haven appeal. This factor, combined with the strong daily technicals, suggests that the odds favor a continuation of the bullish trend, provided key resistance levels are breached. Traders should remain vigilant for confirmation signals, such as a decisive daily close above $99.88, and manage their risk accordingly, especially given the conflicting signals on shorter timeframes. The market will likely be watching for any shifts in geopolitical risk or significant economic data releases that could sway the DXY's trajectory.
Frequently Asked Questions: DXY Analysis
What happens if DXY breaks decisively above the $99.88 resistance level?
A confirmed break above $99.88, especially on the daily chart, would validate the bullish trend and likely trigger further upside momentum. This could see the DXY target the next significant resistance at $100.32, with a secondary target at $100.62. This scenario is estimated to have a 60-65% probability based on current daily technicals.
Should I consider a short position on DXY at current levels of $99.67 given the 1-hour Stochastic is overbought?
Entering a short position solely based on the 1-hour Stochastic being overbought at $99.67 carries significant risk due to the strong daily uptrend. A more prudent approach would be to wait for confirmation of rejection at $99.88, potentially with bearish divergence on RSI or MACD, and target initial support at $99.51. This bearish scenario has a 35-40% probability.
Is the RSI at 65.77 on the daily chart a sell signal for DXY?
An RSI reading of 65.77 on the daily chart is not typically considered a sell signal; it indicates strong bullish momentum but is still within the neutral zone, suggesting room for further gains. A move above 70 would be needed to signal overbought conditions and warrant caution for potential pullbacks.
How will the ongoing geopolitical tensions in the Middle East impact DXY's price around $99.67 this week?
Escalating geopolitical tensions typically increase demand for safe-haven assets like the US Dollar. This could provide a tailwind for the DXY, potentially pushing it towards resistance levels like $99.88 and beyond, even if economic data is mixed. The market will be closely monitoring news flow from the region.
| Indicator | Value | Signal | Interpretation |
|---|---|---|---|
| RSI (14) | 65.77 | Neutral | Strong momentum, room to move higher |
| MACD Histogram | Positive | Bullish | Positive momentum building |
| Stochastic (%K/%D) | 81.77 / 54.53 (1H) | Bearish | Overbought on 1H, potential short-term reversal |
| ADX | 31.05 (Daily) | Strong Trend | Confirms a strong trend direction |
| Bollinger Bands | Above Mid Band | Bullish | Price trading above middle band, indicating upward pressure |
Track markets in real-time
AI-powered analysis, technical indicators and real-time price data.
Join Our Telegram Channel
Breaking market news, AI analysis and trading signals instantly.
Join Channel