ETHUSD Trades Near $2,324.68: Is a Bullish Breakout Imminent?
ETHUSD hovers around $2,324.68. With RSI at 60.43 and strong 4H uptrend signals, traders eye a potential breakout above resistance. Learn the key levels and trade setup.
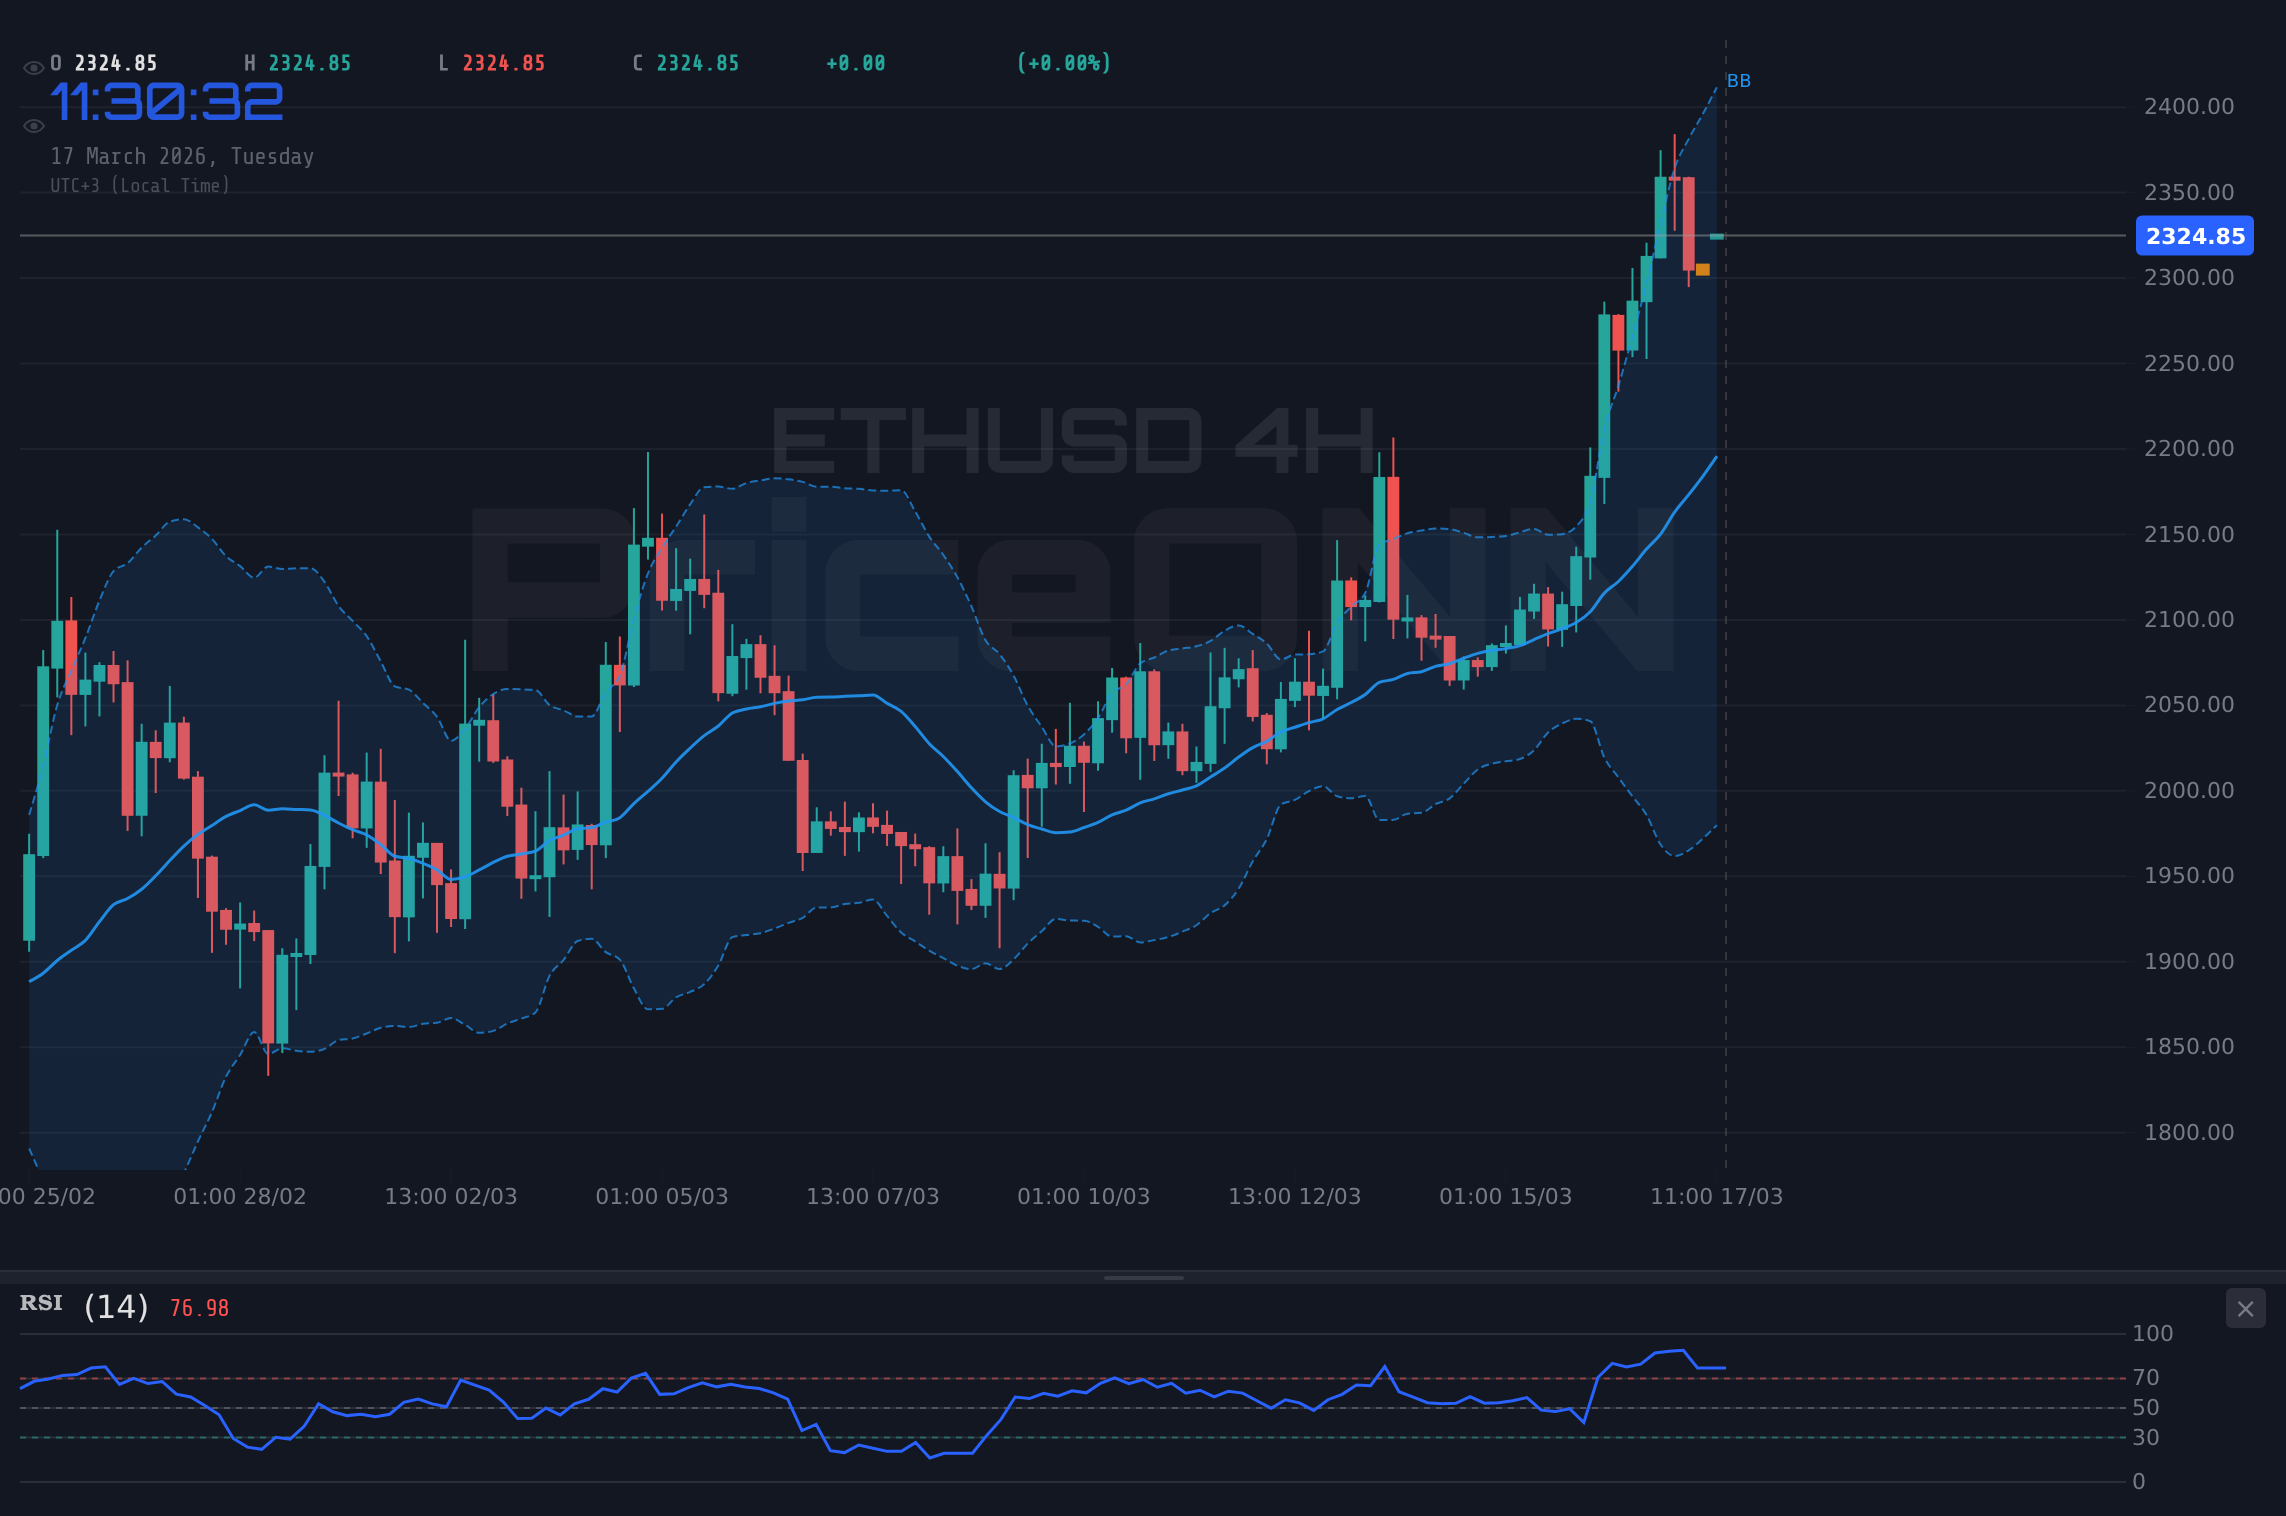
This is where the real action is. ETHUSD is currently dancing around the $2,324.68 mark, and frankly, the technical picture is screaming for attention. After a period of consolidation, the indicators are starting to align, suggesting that the bulls might be gearing up for another significant move. Having watched ETHUSD closely, particularly through the recent volatility, I’m seeing patterns emerge that point towards a potential breakout, but it’s not a done deal yet. The market is at a crucial juncture, and understanding the nuances of the current setup is key to navigating it profitably.
- ETHUSD RSI at 60.43 signals a bullish trend, but not yet overbought territory.
- Critical resistance sits at $2,385.81 on the 4H chart, a level to watch for a decisive breakout.
- The MACD histogram shows positive momentum on the 4H chart, supporting upward potential.
- DXY at 99.62 is rising, which historically can pressure crypto assets, but ETHUSD shows resilience.
Now, let's dive into what's really driving this market. The 4-hour chart for ETHUSD is particularly compelling. We're seeing a strong uptrend signal with an ADX reading of 46.89, indicating that the momentum behind this move is significant. This isn't just a blip; it's a developing trend that traders need to respect. The RSI, while not yet in overbought territory at 61.55 on the daily chart, is showing a steady climb, suggesting room for further upside. Meanwhile, the MACD on the daily chart is positive and above its signal line, reinforcing the bullish sentiment. This confluence of indicators paints a picture of potential upside, but we need to be mindful of the resistance levels.
The Bullish Case: Targeting New Highs
The primary scenario for ETHUSD is decidedly bullish, especially when looking at the 4-hour timeframe. The strong uptrend, supported by a robust ADX of 46.89, suggests that the path of least resistance is upwards. The MACD histogram is printing positive momentum, and the Stochastic oscillator, while in overbought territory on the daily (K=86.87, D=66.26), is showing a bullish crossover on the 4-hour chart (K=81.43, D=83.54), indicating continued strength. The immediate resistance to watch is at $2,385.81. A decisive close above this level, ideally on increased volume, would confirm a breakout and could pave the way for further gains. The next significant resistance is at $2,447.83. Traders looking to enter on the bullish side should be watching for a confirmation of the break above $2,385.81. This setup offers a compelling risk-reward ratio, especially if we can catch the move early.
Bullish Scenario: Breakout Confirmation
70% ProbabilityOn the daily chart, ETHUSD is also showing signs of strength, with an RSI of 62.6 and a positive MACD. While the Stochastic is in overbought territory, it's crucial to remember that in a strong uptrend, oscillators can remain overbought for extended periods. The key here is not to get shaken out by temporary overbought signals but to focus on the trend confirmation. The support levels on the daily chart, starting at $2,196.55, provide a substantial buffer. A break below these levels would invalidate the bullish thesis, but for now, the focus remains on the upside potential. The market sentiment appears to be shifting towards risk-on, which is generally favorable for cryptocurrencies like Ethereum.
The Bearish Case: Caution at Resistance
However, we cannot ignore the potential for a pullback or a bearish scenario. While the 4-hour and daily charts lean bullish, the 1-hour timeframe presents a more mixed picture. The RSI is at 53.93, and the MACD is showing negative momentum, with the price currently below the 1-hour middle Bollinger Band. This suggests that immediate intraday selling pressure could emerge. Furthermore, the daily chart’s Stochastic oscillator is in overbought territory, which historically can precede a period of consolidation or a sharp correction. If ETHUSD fails to break above the $2,385.81 resistance, we could see a reversal. The first significant support level to watch on the 4-hour chart is $2,329.29, followed by $2,300.23. A break below these levels would signal a potential shift in momentum and could lead to a move towards the daily support at $2,196.55. The ADX on the 1-hour chart is at 31.95, which indicates a strong trend, but the mixed signals between timeframes warrant caution.
Bearish Scenario: Failure to Break Resistance
30% ProbabilityThe current price action around $2,324.68 is critical. If sellers manage to push the price below the immediate 1-hour support at $2,324.85, it could trigger a wave of profit-taking. This is especially true if broader market sentiment sours. The DXY is currently at 99.62 and showing upward momentum, which often correlates inversely with crypto prices. A strengthening dollar could add another layer of pressure on ETHUSD. However, the resilience shown in the 4-hour and daily charts suggests that any pullback might be a buying opportunity for those with a longer-term perspective, provided the key daily support levels hold.
Correlations and External Factors
Understanding the broader market context is crucial for ETHUSD. The Dollar Index (DXY) is currently at 99.62 and trending upwards on the daily chart, signaling a potential headwind for riskier assets like cryptocurrencies. Historically, a stronger dollar can lead to capital flowing out of assets like ETHUSD. However, we've seen periods where this correlation has weakened, especially when specific catalysts drive crypto markets independently. The S&P 500 is trading at 6671.9, showing a slight downtrend today, which aligns with a general risk-off sentiment. If major equity indices continue to decline, it could spill over into the crypto market, impacting ETHUSD. On the other hand, the bullish signals from the 4-hour and daily ETHUSD charts suggest that it might be decoupling from broader market weakness, driven by its own internal dynamics, possibly related to upcoming network upgrades or positive sentiment within the crypto community.
Oil prices, specifically Brent at $104.41 and WTI at $97.59, are surging. This rise in energy costs can contribute to inflation concerns, which in turn can influence central bank policies. If inflation remains stubbornly high, it might lead to delayed interest rate cuts or even further tightening, which would be bearish for risk assets. However, the current strong uptrend in oil could also signal a robust global economy, which might indirectly support risk appetite. For ETHUSD, the immediate impact of rising oil prices is less direct than that of the DXY or equity markets, but it adds to the overall inflationary narrative that central banks are closely monitoring.
The correlation analysis is vital here. While the DXY's upward move presents a potential challenge, the strong bullish signals on the ETHUSD 4-hour and daily charts cannot be ignored. The fact that ETHUSD is showing resilience despite a rising dollar suggests underlying strength. Traders should monitor the DXY's trajectory closely; a sustained push above 100.32 on the daily chart would be a significant bearish signal for ETHUSD. Conversely, if the DXY stalls or reverses, it would remove a key obstacle for Ethereum. The S&P 500's current downtrend is also a point of concern. A close below the daily support of 6628.43 could signal broader market instability, which would likely impact ETHUSD negatively. However, the crypto market often exhibits its own drivers, and the strong technical setup on ETHUSD might override these broader correlations in the short term.
Key Levels and Trade Setup
The technical landscape for ETHUSD is clearly defined by key support and resistance levels. On the upside, the immediate hurdle is $2,385.81. A confirmed break and hold above this level is the primary trigger for a bullish trade. This level is not just an arbitrary number; it represents the peak of the recent consolidation on the 4-hour chart. Successfully breaching it would likely unlock further upside, targeting $2,447.83 and then $2,536.96. These targets are derived from the confluence of previous price action highs and Fibonacci extensions, offering clear profit objectives. The risk management aspect is equally critical. The invalidation level for this bullish thesis is a close below the 4-hour support at $2,329.29, and more significantly, the daily support at $2,196.55. Trading below $2,329.29 would suggest the bullish momentum has stalled, and a move lower is probable.
For traders looking to play the bearish scenario, the invalidation of the bullish breakout above $2,385.81 would be the signal. A failure to hold this resistance could lead to a sharp move down, testing the 4-hour support at $2,329.29. If this level gives way, the next target would be $2,300.23. The ultimate stop for a bearish trade would be a sustained move back above the $2,447.83 resistance. It’s a high-risk, high-reward setup that relies on the market rejecting the upward momentum. Given the strength of the 4-hour and daily uptrend signals, the probability of this bearish scenario playing out is lower, but it remains a possibility if broader market sentiment turns negative or if ETHUSD fails to break through key resistance.
The Federal Reserve's policy stance and upcoming economic data releases, particularly those related to inflation and employment, could introduce significant volatility. Traders should manage risk prudently and consider the potential impact of these macroeconomic factors on ETHUSD's price action.
The current price of $2,324.68 is precisely at a point where short-term traders might see an opportunity for a quick scalp if the 1-hour resistance at $2,324.85 holds, or a longer-term entry if the 4-hour resistance at $2,385.81 is decisively broken. The strength of the trend indicated by the ADX on multiple timeframes is a key takeaway. While oscillators might show overbought or oversold conditions, a strong ADX often means these conditions can persist. Therefore, chasing short-term reversals against a strong trend can be a losing strategy. It’s better to wait for clear confirmation of a trend change or a breakout.
Focus on the 4-hour chart for trend confirmation and the 1-hour chart for entry timing. Wait for a clear break above $2,385.81 with sustained volume before committing to a long position. If playing the short side, look for a decisive break below $2,329.29 as a signal to enter.
Frequently Asked Questions: ETHUSD Analysis
What happens if ETHUSD breaks above the $2,385.81 resistance level?
A confirmed break above $2,385.81 on the 4-hour chart would likely trigger further upside momentum. The next targets would be $2,447.83, followed by $2,536.96. This scenario is supported by strong bullish signals on the daily and 4-hour charts, including a high ADX reading.
Should I buy ETHUSD at current levels near $2,324.68 given the mixed 1-hour signals?
Buying at current levels requires caution due to mixed 1-hour signals and the proximity to resistance. A more prudent approach would be to wait for confirmation of a breakout above $2,385.81, or a pullback to a key support level like $2,329.29 if the bullish thesis remains intact, with a probability of around 70% for the upside scenario.
Is the RSI at 60.43 on the 1-hour chart a sell signal for ETHUSD?
An RSI of 60.43 on the 1-hour chart is not typically considered a sell signal; it indicates bullish momentum without being overbought. However, when considering the daily RSI at 62.6, which is also in bullish territory, it suggests that the trend is upward and that oscillators can remain in these zones during strong moves.
How will the rising DXY at 99.62 affect ETHUSD's price this week?
A rising DXY at 99.62 historically presents a headwind for assets like ETHUSD. This could potentially cap upside or even trigger a pullback. However, the strong internal bullish signals for ETHUSD suggest it might show resilience. Traders should monitor if ETHUSD continues to move higher despite the dollar's strength, or if the DXY's rise eventually leads to a bearish reversal.
The market is offering a clear setup for ETHUSD, with defined risk and reward. The bullish scenario, targeting new highs above $2,385.81, appears to have a higher probability given the confluence of strong trend indicators on the 4-hour and daily charts. However, the mixed signals on the 1-hour timeframe and the rising DXY warrant a disciplined approach. Patience will be rewarded; waiting for a confirmed breakout above resistance is the most prudent strategy for capturing the upside potential. Remember, managing your risk is paramount, and always have a plan for invalidation if the market moves against your thesis.
Technical Outlook Summary
| Indicator | Value | Signal | Interpretation |
|---|---|---|---|
| RSI (14) | 60.43 | Bullish | Positive momentum, not overbought. |
| MACD Histogram | Positive | Bullish | Supports upward move. |
| Stochastic | K=81.43, D=83.54 (4H) | Bullish Crossover | Suggests continued upward movement. |
| ADX | 46.89 (4H) | Strong Trend | Confirms significant trend strength. |
| Bollinger | Middle Band | Above | Price is above the middle band, indicating bullish bias. |
Track markets in real-time
AI-powered analysis, technical indicators and real-time price data.
Join Our Telegram Channel
Breaking market news, AI analysis and trading signals instantly.
Join Channel