Nasdaq100 Tests $24,540.76 Support as Gold Shines Amid Volatility
Nasdaq100 hovers around $24,540.76, testing key support. Gold prices ($5,022.51) show resilience amid market uncertainty. Technicals and macro factors analyzed.
Having tracked the Nasdaq100 through a period of intense volatility, the current price action around $24,540.76 presents a critical juncture for traders. While equities show signs of pressure, precious metals, particularly gold, are demonstrating remarkable strength. This divergence warrants a closer look at the underlying forces at play and what they signal for the immediate trading landscape.
- Nasdaq100 is testing crucial support at $24,502.42, with the 1H chart showing a neutral trend but a bearish signal from Stochastic.
- Gold prices are consolidating near $5,022.51, with the 1D RSI at 48.01 indicating a lack of strong directional conviction despite recent pullbacks.
- The US Dollar Index (DXY) is showing strength, currently trading at 99.64, which typically exerts pressure on gold and major forex pairs.
- Geopolitical tensions and central bank actions remain key drivers, influencing risk appetite and safe-haven demand, impacting indices like the Nasdaq100 and commodities like XAUUSD.
Why Nasdaq100's Technicals Point to a Crucial Support Test
The 1H and 4H Charts Signal Caution
The Nasdaq100, currently trading at $24,540.76, is navigating a complex technical landscape. On the 1-hour chart, the trend is neutral with a strength of 50%, yet the Stochastic indicator is flashing a bearish signal (%K at 15.02, %D at 10.05), suggesting a potential for further downside pressure. While the MACD shows positive momentum, it's below the signal line, indicating waning bullish conviction. The ADX at 22.91, though showing a strong upward trend, is often misleading in choppier markets. The 4-hour chart paints a similar picture: a neutral trend with MACD below its signal line and a bearish Stochastic signal. The ADX here is weaker at 10.89, suggesting a lack of sustained trend strength, which is a critical observation for any breakout or breakdown scenario. This confluence of neutral to bearish short-term signals suggests that the current levels are indeed a key area to watch for a potential bounce or a deeper correction.
The immediate support levels on the 1-hour chart are 24502.42, followed by 24479.41 and 24458.14. A decisive break below the 24502.42 mark could trigger stop-loss orders, leading to a cascade towards the lower levels. Conversely, a hold above these prices, particularly the 24502.42 level, could provide the necessary footing for a short-term recovery. The daily chart, however, shows a stronger bearish trend (91% strength) with RSI at 44.06, further reinforcing the idea that the current support test is a significant event. Traders are observing closely whether the bulls can defend these levels or if the bears will exploit the weakening momentum.
Correlation with DXY and Equities
The Nasdaq100's price action is intrinsically linked to broader market sentiment, often dictated by the US Dollar Index (DXY) and the performance of other major indices. Currently, the DXY is trading at 99.64, showing a daily increase of 0.2%. This strengthening dollar typically exerts downward pressure on risk assets like the Nasdaq100, as it makes US assets more expensive for foreign investors. Furthermore, the S&P 500 is down 0.32% at 6673.5, and the Nasdaq100 itself is trading lower by 0.42% at $24,540.76. This broader equity market weakness indicates a general risk-off sentiment, which is a headwind for growth-oriented tech stocks represented in the Nasdaq100. The correlation is clear: a strong dollar coupled with a declining equity market suggests that the support levels for the Nasdaq100 are under significant threat.
The ADX on the daily timeframe for the Nasdaq100 is 32.66, indicating a strong downtrend. This macro-technical picture suggests that any bounce might be a temporary reprieve rather than a sustained reversal, unless significant fundamental catalysts emerge to shift market sentiment. The interplay between the dollar's strength, equity market performance, and the specific technical setup on the Nasdaq100 creates a challenging environment for bulls looking for a decisive upward move.
Gold's Resilience: A Safe Haven in Turbulent Times?
XAUUSD Holding Strong Near $5,022.51
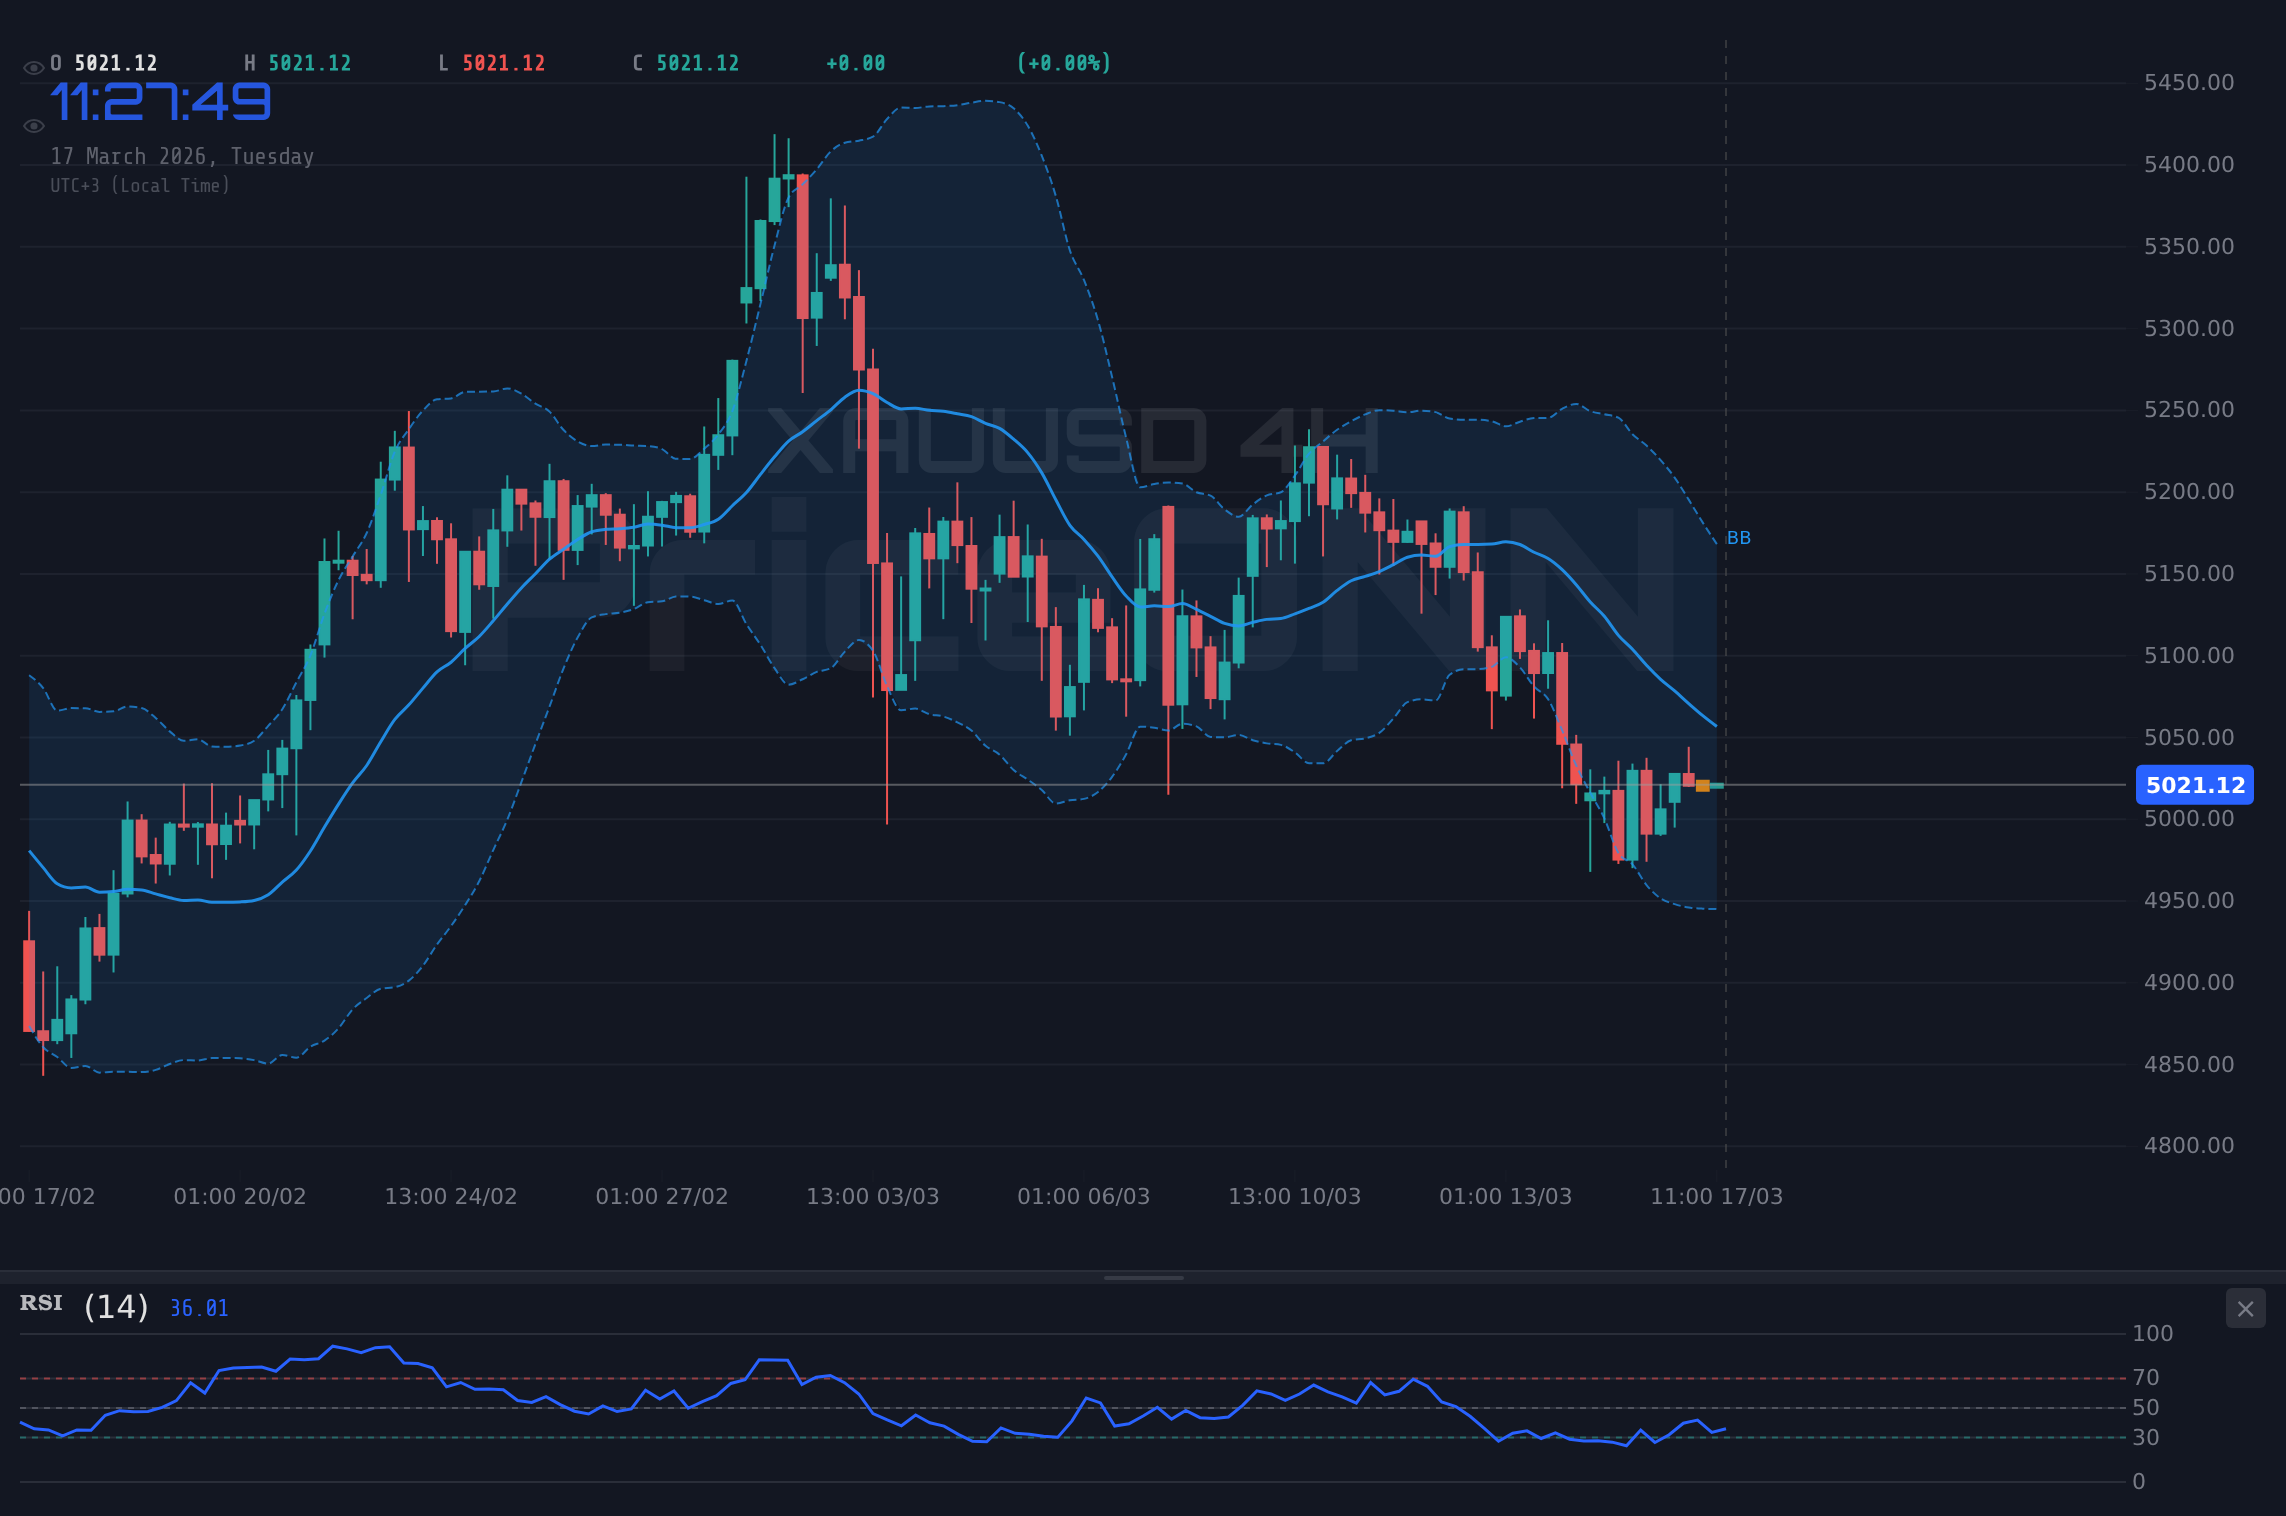
In stark contrast to the pressure on the Nasdaq100, gold (XAUUSD) is demonstrating a compelling resilience, currently trading at $5,022.51. Despite a recent pullback, the price is holding key support levels, hinting at underlying strength. On the 1-hour chart, the trend is neutral, but the RSI at 51.2 shows a slight upward bias, and the MACD is in positive territory. However, the Stochastic is giving a bearish signal, indicating potential short-term consolidation. The 4-hour chart presents a more bearish short-term outlook, with RSI at 41.75 and MACD below its signal line. Yet, the daily chart, despite a bearish overall signal, shows an RSI of 48.01, which is close to the neutral zone and suggests that the selling pressure might be abating.
The ADX on the daily chart is a mere 13.07, signaling a weak trend, which often precedes a significant move. This suggests that the market is in a consolidation phase, and the current price action around $5,022.51 could be a prelude to a larger move. The support levels to watch on the daily chart are 4970.06, 4934.05, and 4900.29. A sustained hold above these levels, particularly the psychological $5,000 mark, would be a bullish signal for gold. The resistance levels, on the other hand, are 5039.83, 5073.59, and 5109.6. A break above 5039.83 could signal a renewed upward push.
The Influence of Geopolitics and Central Banks
The recent news flow provides critical context for gold's performance. Reports indicate that gold experienced a sharp downside 'fake-out' despite ongoing geopolitical tensions, with XAU/USD briefly dipping. This suggests that underlying demand remains robust. Furthermore, the news that gold prices are consolidating near the $5,000 mark as central bank buying momentum slows is crucial. While the pace of central bank accumulation might be easing, the fact that they continue to hold significant gold reserves provides a fundamental floor for the price. Geopolitical risks, such as the closure of the Strait of Hormuz and the ongoing conflict mentioned in the news snippets, inherently boost demand for safe-haven assets like gold.
The market's reaction to these events, with gold holding firm near $5,022.51 despite broader market pressures, underscores its role as a hedge against uncertainty. While the DXY's strength could pose a challenge, the persistent geopolitical backdrop and the potential for central banks to maintain their gold holdings offer a supportive narrative. Investors are closely watching if this consolidation near $5,000 can give way to a renewed rally, especially if risk aversion increases further.
Forex Market Dynamics: A Tale of Divergence
EURUSD and USDJPY Battle for Direction
The forex market presents a mixed picture, with key currency pairs showing conflicting trends. EURUSD is currently trading at 1.14955, down 0.08% on the day. The daily trend is strongly bearish (98% strength) with RSI at 34.27, suggesting oversold conditions but also persistent selling pressure. The key support levels are 1.14378, 1.13704, and 1.13274. The 1-hour chart shows a neutral trend with a bullish Stochastic signal, while the 4-hour chart also shows a neutral trend with a bullish Stochastic. This divergence between the strong daily downtrend and the short-term bullish signals is typical of consolidation phases.
USDJPY, on the other hand, is showing a strong daily uptrend (86% strength) at 159.184. The daily RSI at 64.48 is in the upper neutral zone, and the Stochastic is in overbought territory. The key resistance levels are 159.542, 160.089, and 160.437. The strength in USDJPY, often driven by interest rate differentials and risk sentiment, aligns with the rising DXY. The intervention fears mentioned in the news, regarding potential Japanese Yen intervention to halt USD/JPY's advance near 159.40, add a layer of complexity. Traders are watching if the Bank of Japan will step in to curb the yen's weakness, which could lead to a sharp reversal.
Sterling and the Aussie: Mixed Signals
GBPUSD is exhibiting a bearish daily trend (91% strength) with the price at 1.33085. The RSI is at 39.73, indicating a bearish bias, and the Stochastic is also giving a bearish signal. Support levels are at 1.32475, 1.3178, and 1.31327. The 4-hour chart shows a neutral trend, but the overall daily picture suggests further downside potential, especially if broader market sentiment turns risk-off.
AUDUSD presents an interesting case. While the 1-hour and 4-hour charts show a bullish trend and a bullish signal respectively, the daily trend is classified as bullish with 87% strength. The price is at 0.70681, with resistance at 0.71052. The upcoming Reserve Bank of Australia (RBA) decision looms large, adding an element of uncertainty. News suggests AUD/USD is poised for a breakout above 0.71 ahead of the RBA decision. A hawkish surprise from the RBA could indeed fuel a rally, but a cautious stance might see the pair consolidate or even reverse, especially if the DXY continues its upward trajectory. The divergence across these major forex pairs highlights the need for careful analysis of individual currency drivers and broader market correlations.
Energy Markets Surge Amid Geopolitical Tensions
Brent and WTI Lead the Charge
The energy markets are experiencing a significant surge, with both Brent and WTI crude oil prices showing strong upward momentum. Brent crude is trading at $104.32, up 3.44% on the day, driven by a very strong daily uptrend (100% strength). The daily RSI at 82.02 is deep in overbought territory, suggesting a potential for a pullback, but the ADX at 59.72 indicates an extremely strong trend. Resistance levels are at 105.05, 109.24, and 111.88. The 1-hour chart shows a bullish trend with a strong buy signal, while the 4-hour also confirms a bullish trend.
WTI crude is not far behind, trading at $97.47, up 3.66%. Its daily trend is also classified as strong (100% strength), with an RSI of 74.91, also indicating overbought conditions but a very strong trend as confirmed by the ADX at 53.97. Resistance levels for WTI are at 99.47, 104.91, and 108.24. The news regarding the closure of the Strait of Hormuz and a record strategic reserve release directly fuels this rally, highlighting significant geopolitical risk impacting supply.
The Inflationary Implications
The surge in oil prices carries significant inflationary implications for the global economy. Higher energy costs directly impact transportation and production costs across various sectors, potentially feeding into broader inflation metrics. This could complicate the stance of central banks, forcing them to balance the need to control inflation with the risk of stifling economic growth. The market's reaction to oil prices, especially in the context of central bank policies and inflation data, will be a key factor to monitor in the coming weeks. The strong upward momentum in oil prices suggests that inflationary pressures might persist or even intensify, which could influence monetary policy decisions and, consequently, market sentiment across all asset classes.
Cryptocurrency Market: Bitcoin and Ethereum Show Mixed Signals
BTCUSD Consolidates Above Key Levels
Bitcoin (BTCUSD) is currently trading around $74,255, showing a slight daily decrease. While the 1-hour trend is neutral, the 4-hour and daily timeframes indicate a strong bullish trend. The 4-hour RSI is at 61.25, in the upper neutral zone, and the MACD is positive. However, the Stochastic is in overbought territory on both the 4-hour and daily charts, signaling potential caution. The ADX on the 4-hour chart is a strong 42.64, confirming the upward trend. Support levels on the 1-hour chart are at 73886, 73683, and 73486, while resistance is at 74286, 74483, and 74686. The overall daily signal is bullish, suggesting that despite short-term consolidation, the longer-term outlook remains positive.
ETHUSD Faces Overbought Conditions
Ethereum (ETHUSD) is trading at $2,324.12, down 1.47% on the day. The 1-hour trend is neutral, but the 4-hour trend is strongly bullish (100% strength), and the daily trend is neutral. The 4-hour RSI at 71.19 is firmly in overbought territory, and the Stochastic is also showing extreme overbought conditions on both the 4-hour and daily charts. This suggests that while the trend has been strongly bullish, a period of consolidation or correction might be due. The ADX on the 4-hour chart is 46.89, indicating a strong uptrend. Support levels on the 1-hour chart are 2298.95, 2284.69, and 2273.05, with resistance at 2324.85, 2336.49, and 2350.75. The daily signal is bullish, but the overbought indicators warrant caution for aggressive long positions.
The performance of Bitcoin and Ethereum, despite some short-term headwinds, continues to be influenced by factors such as institutional adoption, regulatory developments, and broader market sentiment. The recent news about AI's demand for power and potential nuclear renaissance is an interesting, albeit indirect, factor that could influence the energy consumption narrative around proof-of-work cryptocurrencies in the long run, but currently, the focus remains on technical levels and market momentum.
Navigating the Nasdaq100: What Traders Should Watch Next
The Critical $24,502 Support Level
For traders focused on the Nasdaq100, the immediate action revolves around the $24,502.42 support level. A failure to hold this mark on the 1-hour chart could trigger a cascade towards the 24479.41 and 24458.14 levels. The conflicting signals from short-term indicators versus the longer-term daily bearish trend create a high-stakes environment. The divergence between the strong dollar, weakening equities, and resilient gold prices adds another layer of complexity. Investors should be wary of chasing short-term bounces without confirmation, given the prevailing bearish undertones on the daily chart.
The Role of Inflation and Central Banks
The persistent strength in oil prices, driven by geopolitical events, poses a significant challenge to central banks fighting inflation. If inflation remains sticky, it could force central banks to maintain a hawkish stance for longer, which would be detrimental to growth-oriented indices like the Nasdaq100. Conversely, any signs of cooling inflation or a shift in central bank rhetoric could provide a much-needed catalyst for a risk-on rally. Traders should closely monitor upcoming economic data, particularly inflation reports and central bank communications, for clues on the future direction of monetary policy and its impact on the Nasdaq100.
The current market environment demands a disciplined approach. While the Nasdaq100 is testing support at $24,540.76, the technicals and macro backdrop suggest caution. Gold's strength at $5,022.51 highlights the demand for safe havens, and the surge in oil prices underscores ongoing inflationary concerns. For now, patience appears to be the best strategy, waiting for clearer signals and confirmation before committing to significant positions.
Frequently Asked Questions: Nasdaq100 Analysis
What happens if the Nasdaq100 breaks below $24,502.42 support?
A break below the $24,502.42 support level on the Nasdaq100 could trigger stop-loss orders, potentially leading to a rapid decline towards the 24479.41 and 24458.14 levels. This would confirm the bearish pressure indicated by the daily chart's ADX of 32.66.
Should I consider buying the Nasdaq100 at current levels of $24,540.76 given the mixed signals?
Entering long positions at $24,540.76 requires caution. While short-term charts show some bullish signals, the daily trend is bearish. A more prudent approach would be to wait for confirmation, such as a close above the 4-hour middle Bollinger Band or a bullish divergence on the daily RSI, before considering entry.
Is the Stochastic indicator at 15.02 on the 1H chart a sell signal for the Nasdaq100?
A Stochastic reading of 15.02 on the 1-hour chart is in the oversold territory, but when coupled with a bearish MACD signal and a strong daily downtrend, it suggests potential for further downside rather than an immediate buy signal. Confirmation from price action holding support is crucial.
How will the rising DXY at 99.64 affect the Nasdaq100 this week?
The rising DXY at 99.64 typically exerts downward pressure on risk assets like the Nasdaq100. This correlation suggests that continued dollar strength could hinder any attempts at a significant rally in the index, making the defense of key support levels even more critical.
Track markets in real-time
AI-powered analysis, technical indicators and real-time price data.
Join Our Telegram Channel
Breaking market news, AI analysis and trading signals instantly.
Join Channel