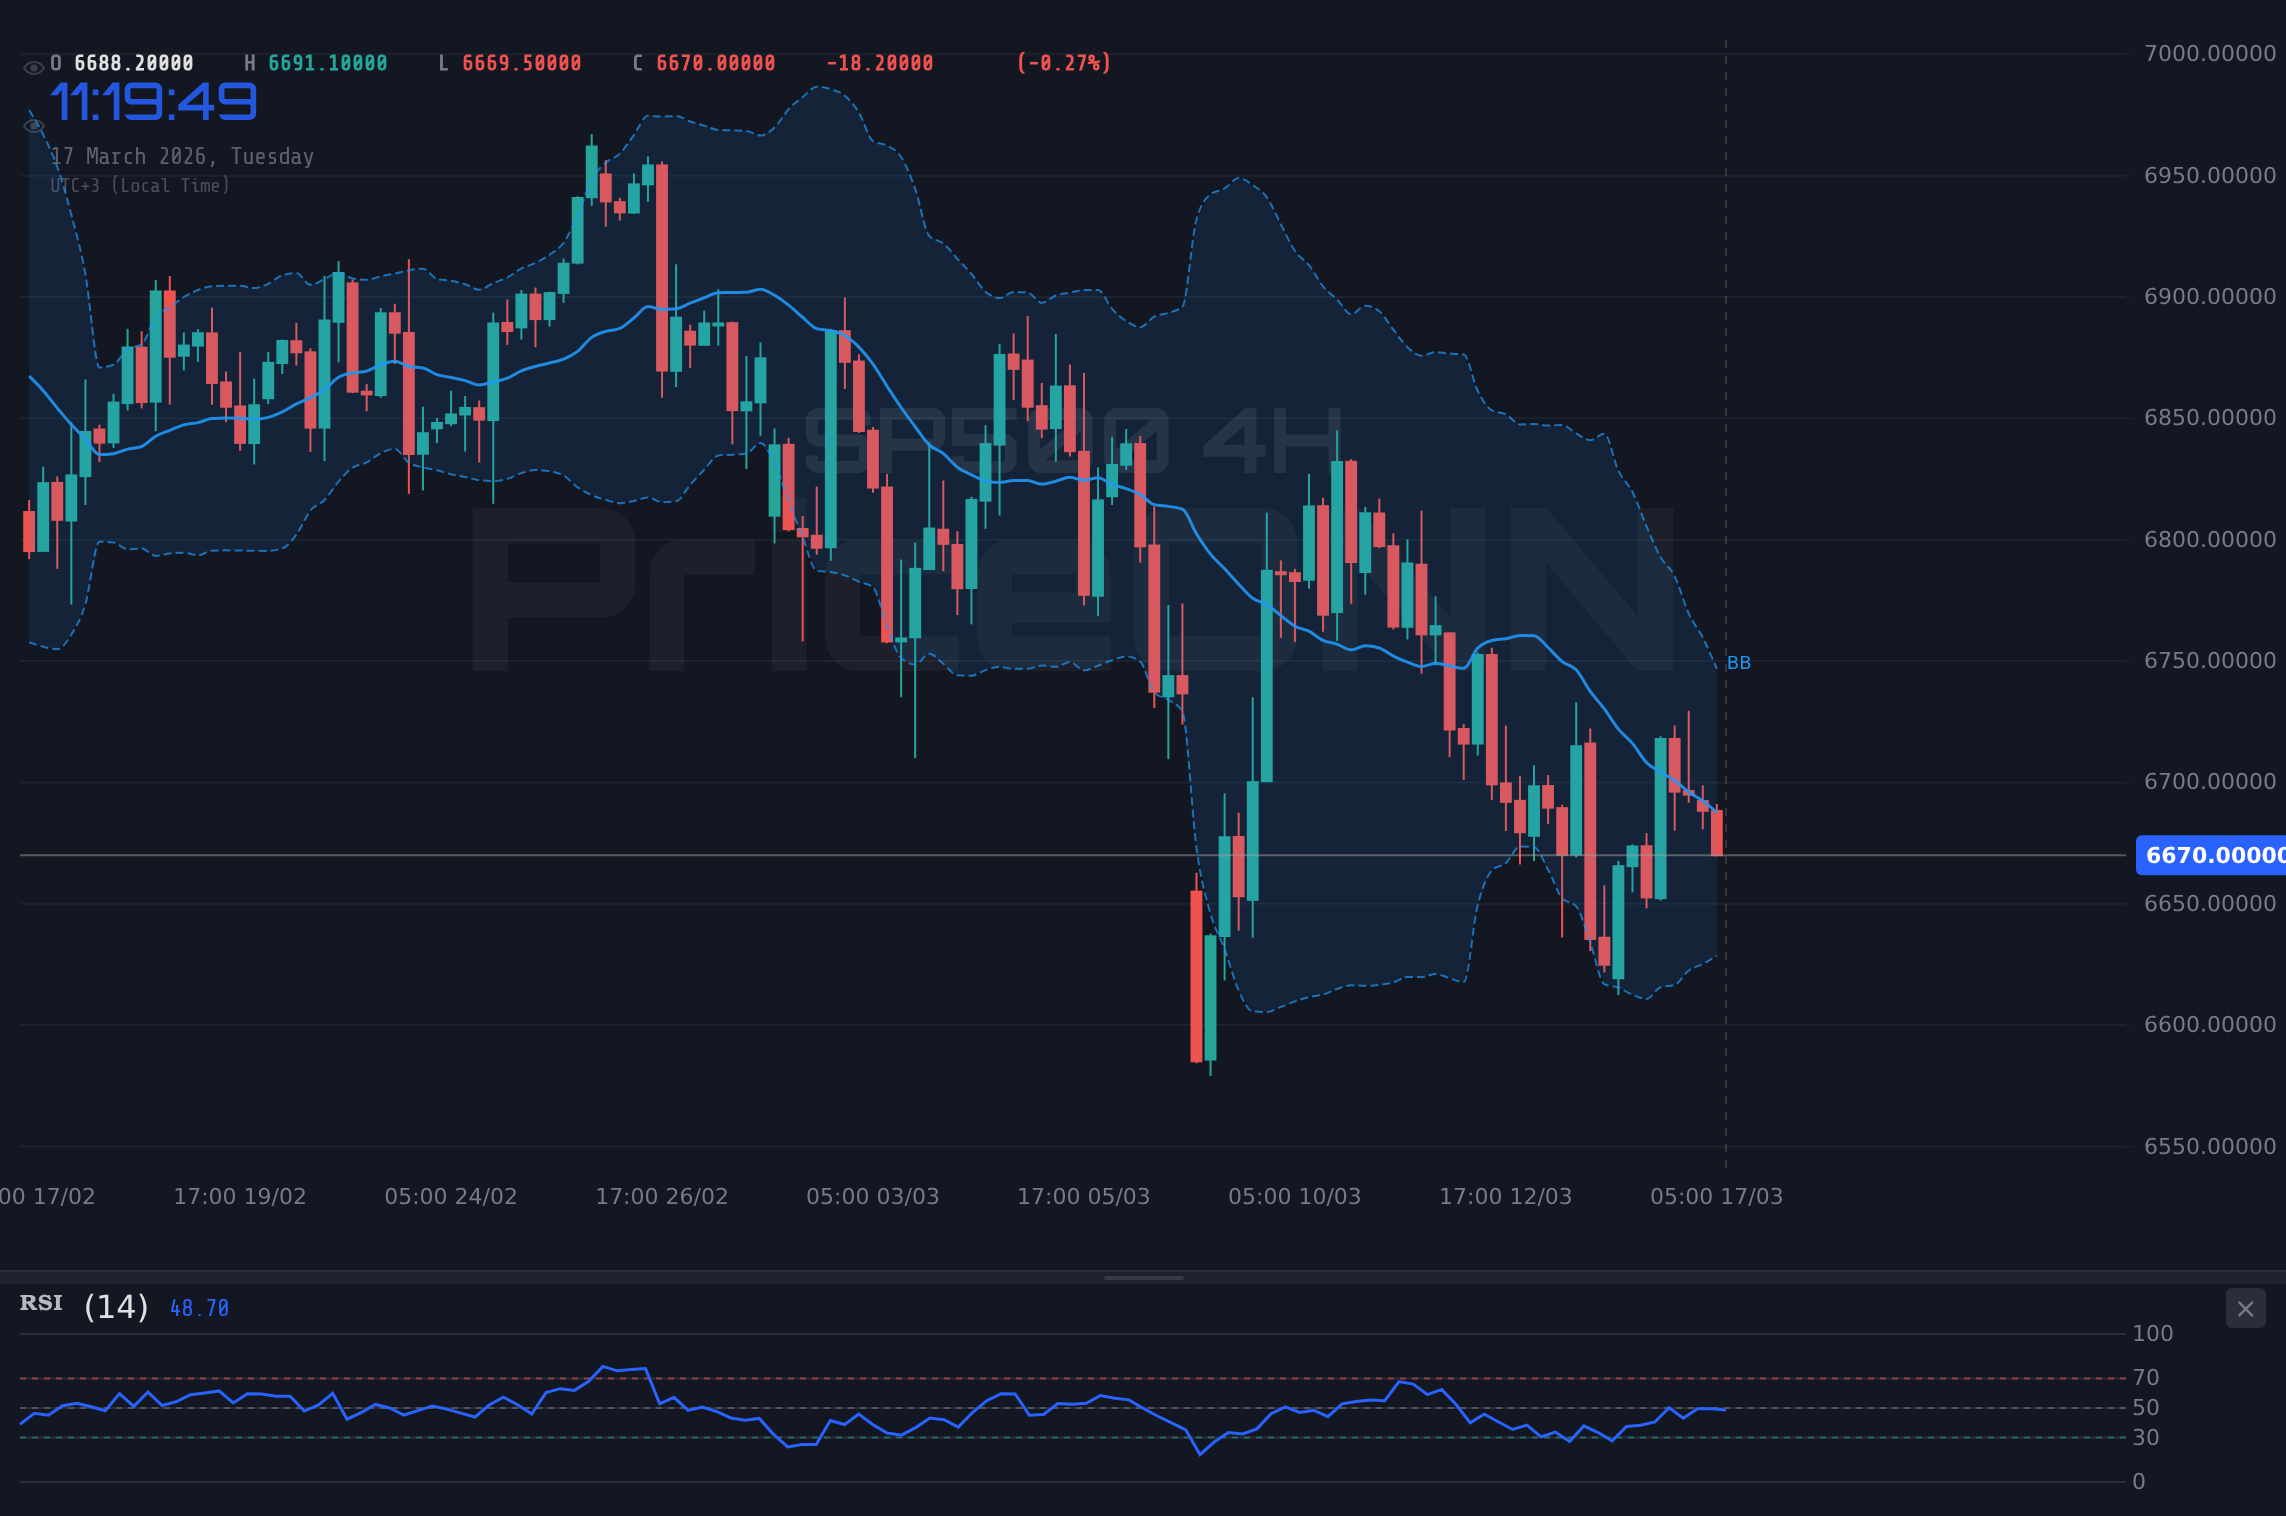
SP500 Tests $6,674.45 Support as RSI Signals Caution
The SP500 is testing critical support at $6,674.45. With RSI at 46.69 on the 1H chart and a weaker trend indicated by ADX, a bounce or breakdown is imminent.
The S&P 500 index is currently navigating a crucial juncture, trading at $6,674.45, as market participants grapple with conflicting signals across multiple timeframes. The index has pulled back, testing key support levels, while indicators present a mixed picture. This analysis delves into the technical underpinnings, exploring the bull and bear arguments that are currently locked in a battle for control, and what these dynamics mean for traders navigating this complex landscape.
The current market sentiment appears to be at a crossroads. While the daily chart shows a clear downtrend with the SP500 at $6,674.45, the shorter timeframes offer glimmers of hope for a potential bounce. This divergence is precisely where seasoned traders find opportunities, but also where the risk of whipsaws is highest. Understanding the strength of the prevailing trend versus the potential for short-term reversals is paramount. We're seeing the ADX on the 1-hour chart at 20.16, suggesting a weak trend, which could imply that the current downward move might be losing momentum, paving the way for a corrective rally. However, the daily ADX reading of 40.73 paints a starkly different picture, indicating a strong downtrend that cannot be ignored.
- RSI at 46.69 on the 1H chart indicates bearish momentum, but is not yet oversold.
- The critical support level for the SP500 is at $6,662.87, with further support at $6,657.63.
- The MACD histogram showing negative momentum suggests sellers are currently in control on shorter timeframes.
- Daily ADX at 40.73 confirms a strong downtrend, making any rallies suspect.
- Correlation with DXY at 99.68 suggests a strengthening dollar may continue to pressure US equities.
The Bull Case: A Potential Bounce from Key Support
A Short-Term Reversal in the Making?
On the 1-hour chart, the SP500 is showing some signs that a short-term bounce could be on the cards. The RSI is hovering at 46.69, indicating there's still room before it enters oversold territory, but the upward trend it has shown on this timeframe suggests a potential shift. The MACD, while showing negative momentum overall, has shown some positive signs on the 1-hour chart, crossing above its signal line. This could be interpreted as early signs of bulls attempting to regain control, even if the larger trend remains bearish. The Stochastic indicator on the 1-hour timeframe is K=16.89 and D=10.14, which is deep in oversold territory, signaling a potential for a short-term reversal upwards. This is a classic setup where price has been pushed too far, too fast, and a correction is due.
Furthermore, the price action itself is currently testing the $6,662.87 support level. Historically, significant indices often find a floor around such well-defined technical levels after a period of selling pressure. If this level holds, we could see a retracement towards the $6,672.77 resistance. The ADX on the 1-hour chart at 20.16 suggests a weak trend, which is often a precursor to a reversal or a significant consolidation phase before the next move. This weak trend strength could mean that the selling pressure is waning, and buyers might step in to create a short-covering rally. The presence of higher support levels at $6,657.63 and $6,652.97 provides additional confidence for bulls looking for a technical bounce. This scenario is further supported by the fact that the Bollinger Bands on the 1-hour chart are currently below the middle band, suggesting that price has moved into oversold territory on this timeframe, and a move back towards the band is plausible.
Correlation and Sentiment Factors
The DXY, or Dollar Index, is currently trading at 99.68 and showing strength, which typically puts pressure on equities. However, if the dollar’s strength were to stall or reverse, it could provide a tailwind for the SP500. Currently, the DXY's 1-hour RSI is at 54.98, indicating a bullish trend on the short term, which aligns with the bearish pressure on stocks. The 4-hour chart for the DXY shows an RSI of 57.8, also suggesting continued strength. This correlation is a key factor to watch; a weakening dollar would be a significant bullish catalyst for the SP500. Additionally, if geopolitical tensions were to ease, or if positive news regarding inflation emerged, risk appetite could return, leading to a rally in stocks. The recent news mentioning 'Easing Oil Fears' causing a decline in gold could suggest a broader shift in market sentiment towards risk assets, though the SP500's own momentum appears to be lagging.
For bulls looking for an entry, confirmation would ideally come from a decisive close above the 1-hour resistance at $6,672.77, followed by a retest and hold of that level. The Stochastic crossing back above D on the 1-hour chart would also be a key confirmation signal.
The Bear Case: Downtrend Poised to Continue
Daily Chart Dominance and Bearish Indicators
The overarching narrative for the SP500, particularly when viewed on the daily timeframe, is one of a strong downtrend. The index is currently trading at $6,674.45, well below its mid-Bollinger Band, and the MACD histogram is firmly in negative territory, indicating that selling momentum is dominant. The daily RSI sits at 39.19, firmly in the bearish zone and trending downwards, suggesting ample room for further declines before any oversold conditions are met. This paints a picture of weakness that cannot be easily dismissed by short-term fluctuations.
The ADX on the daily chart stands at a robust 40.73, confirming a strong downtrend. This indicates that the market is not merely consolidating but is in a directional move lower, making any counter-trend rallies likely to be sold into. The Stochastic indicator on the daily chart shows K=27.37 and D=38.85, reinforcing the bearish outlook with a clear downtrend signal. The price is also below the middle Bollinger Band on this timeframe, which often acts as a dynamic resistance level on the way down. The immediate support at $6,662.87 is a critical line; a break below this level would likely trigger further selling, targeting the next support at $6,657.63 and potentially extending down to $6,652.97. The fact that the SP500 is showing a general direction of 'SAT' (Sell) across multiple timeframes, especially the daily (7 out of 7 signals), underscores the prevailing bearish sentiment.
Macroeconomic Headwinds and Geopolitical Uncertainty
The strength of the US Dollar, as indicated by the DXY's upward trend, continues to be a significant headwind for US equities. A stronger dollar makes American exports more expensive and can reflect tighter financial conditions or a 'risk-off' sentiment globally, both of which are bearish for stocks. The current DXY price of 99.68, with its daily RSI at 65.81 and ADX at 33.54, signals a strong uptrend in the dollar, which directly correlates with downward pressure on the SP500. Any hint of hawkishness from the Federal Reserve, even amidst current economic data, could further bolster the dollar and weigh on the index.
While the provided news mentions 'Easing Oil Fears', other geopolitical factors could easily re-emerge as market movers. The recent mention of the Strait of Hormuz closure and its impact on oil prices, though potentially leading to a surge in energy costs which could fuel inflation, also highlights the ever-present geopolitical risks that can quickly shift market sentiment back to safety. If inflation concerns resurface, it could lead to renewed expectations of higher-for-longer interest rates, a scenario that is typically detrimental to equity valuations. This uncertainty means that any rallies in the SP500 should be treated with skepticism, as a sudden geopolitical event or a hawkish Fed commentary could quickly reverse any short-term gains.
A close below the $6,662.87 support level on the daily chart would be a strong bearish signal, invalidating any hopes of a near-term bounce and likely accelerating the downtrend.
The Verdict: Bears Hold the Edge as Trend Remains Down
Weighing the Evidence
When we weigh the evidence, the bearish case for the SP500 currently appears stronger, primarily due to the dominance of the daily downtrend. While the 1-hour chart offers potential for a short-term corrective bounce, the confluence of bearish indicators on the daily timeframe - RSI below 40, MACD in negative territory, and a strong ADX of 40.73 - suggests that any rallies are likely to be met with selling pressure. The SP500 trading at $6,674.45 is in a precarious position, sitting just above a critical support level that, if broken, could lead to a significant decline.
The correlation with the strengthening DXY at 99.68 further reinforces the bearish outlook. The dollar's upward trajectory often signals a 'risk-off' environment, which is unfavorable for equities. While shorter-term indicators like the 1-hour Stochastic are oversold, they are often unreliable in strong daily downtrends. Confirmation of a sustained bullish move would require not only holding the $6,662.87 support but also breaking key resistance levels on the daily chart, which currently appear distant. For now, the prevailing trend suggests caution is warranted, and any strength should be viewed as a potential selling opportunity rather than the start of a new bull run.
Navigating the Current Environment
Traders should remain vigilant. The current price action around $6,674.45 presents a battleground. Bulls need to defend $6,662.87 and push prices higher, ideally above $6,672.77 on the 1-hour chart to signal a short-term reversal. Bears, on the other hand, are looking for a decisive break below $6,662.87 to confirm the continuation of the downtrend, targeting $6,657.63 and lower. The conflicting signals between short-term oversold conditions and the dominant daily downtrend create a high-risk environment. Patience and strict risk management will be key. Waiting for clearer directional signals, such as a confirmed breakout above daily resistance or a breakdown below daily support, will be crucial for navigating this choppy market. The market's next significant move will likely depend on upcoming economic data and geopolitical developments that could shift the broader sentiment.
The strength of the dollar, currently at 99.68, continues to be a dominant factor influencing global markets, including the SP500. As the Fed's policy path remains a key focus, any shifts in interest rate expectations will likely be reflected in both currency and equity markets. For now, the technical picture on the daily chart strongly favors the bears, suggesting that rallies are opportunities to exit positions rather than initiate new long trades. The market is at a critical juncture, and a break of the $6,662.87 support level could signal a more significant downturn.
“The market is a device for transferring money from the impatient to the patient.” – Warren Buffett. In times of conflicting signals like these, patience and discipline are not just virtues; they are essential survival tools for traders.
Frequently Asked Questions: SP500 Analysis
What happens if the SP500 breaks below $6,662.87 support?
A break below $6,662.87 would invalidate the short-term bullish scenario and likely accelerate the downtrend. The next targets would be $6,657.63 and $6,652.97, confirming the strength indicated by the daily ADX at 40.73.
Is the RSI at 46.69 a buy signal for the SP500 at $6,674.45?
No, an RSI of 46.69 on the 1-hour chart is not a direct buy signal. While it indicates bearish momentum is present, it's not yet in oversold territory and must be considered alongside the strong daily downtrend and other indicators.
How does the DXY's strength at 99.68 affect the SP500's outlook?
A strong DXY, currently at 99.68 with a bullish daily trend (ADX 33.54), typically puts downward pressure on US equities like the SP500. This correlation suggests that continued dollar strength could hinder any potential rallies in the index.
What should traders watch for to confirm a bullish reversal on the SP500?
A confirmed bullish reversal would require the SP500 to hold above the $6,662.87 support, break decisively above the 1-hour resistance at $6,672.77, and show improving momentum on the MACD and Stochastic indicators across multiple timeframes.
Track markets in real-time
AI-powered analysis, technical indicators and real-time price data.
Join Our Telegram Channel
Breaking market news, AI analysis and trading signals instantly.
Join Channel