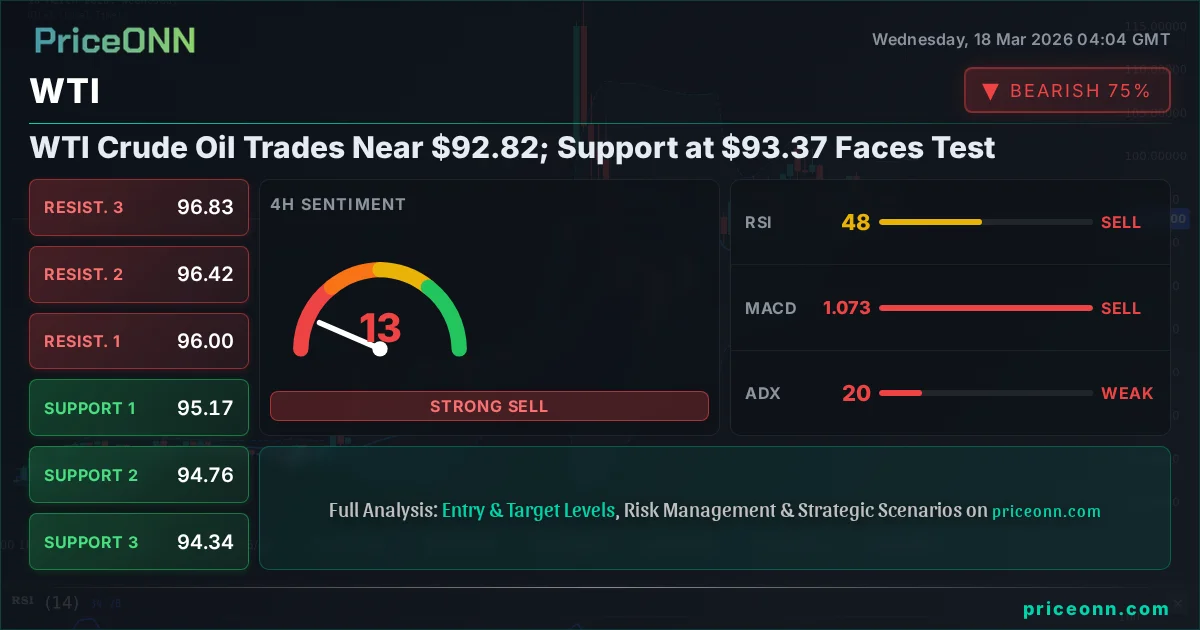
WTI Crude Oil Trades Near $92.82; Support at $93.37 Faces Test
WTI crude oil hovers around $92.82 as traders eye key support at $93.37. Analysis of indicators and multi-timeframe trends suggests potential volatility.
WTI crude oil is currently trading just shy of the $92.82 mark, finding itself at a critical juncture as the market grapples with conflicting signals across various timeframes. The immediate focus is on the $93.37 support level, a price point that has held firm in recent sessions but is now facing renewed pressure. This delicate balance between bullish momentum and underlying selling pressure creates a complex trading environment, demanding a close examination of technical indicators and market sentiment.
- WTI crude oil is trading at $92.82, with immediate support identified at $93.37 and resistance at $101.82.
- The 1-hour chart shows a strong downtrend (ADX 22.4), while the 1-day chart indicates a robust uptrend (ADX 55.58), highlighting significant multi-timeframe divergence.
- RSI readings are mixed: 35.45 on 1H (oversold territory), 47.6 on 4H (neutral), and 68.48 on 1D (approaching overbought).
- MACD histogram shows negative momentum on 1H and 4H, but positive on 1D, indicating trend uncertainty.
- The current market setup presents a challenging risk/reward profile due to conflicting trend signals and ADX readings below 20 on shorter timeframes.
Navigating the Short-Term Downtrend
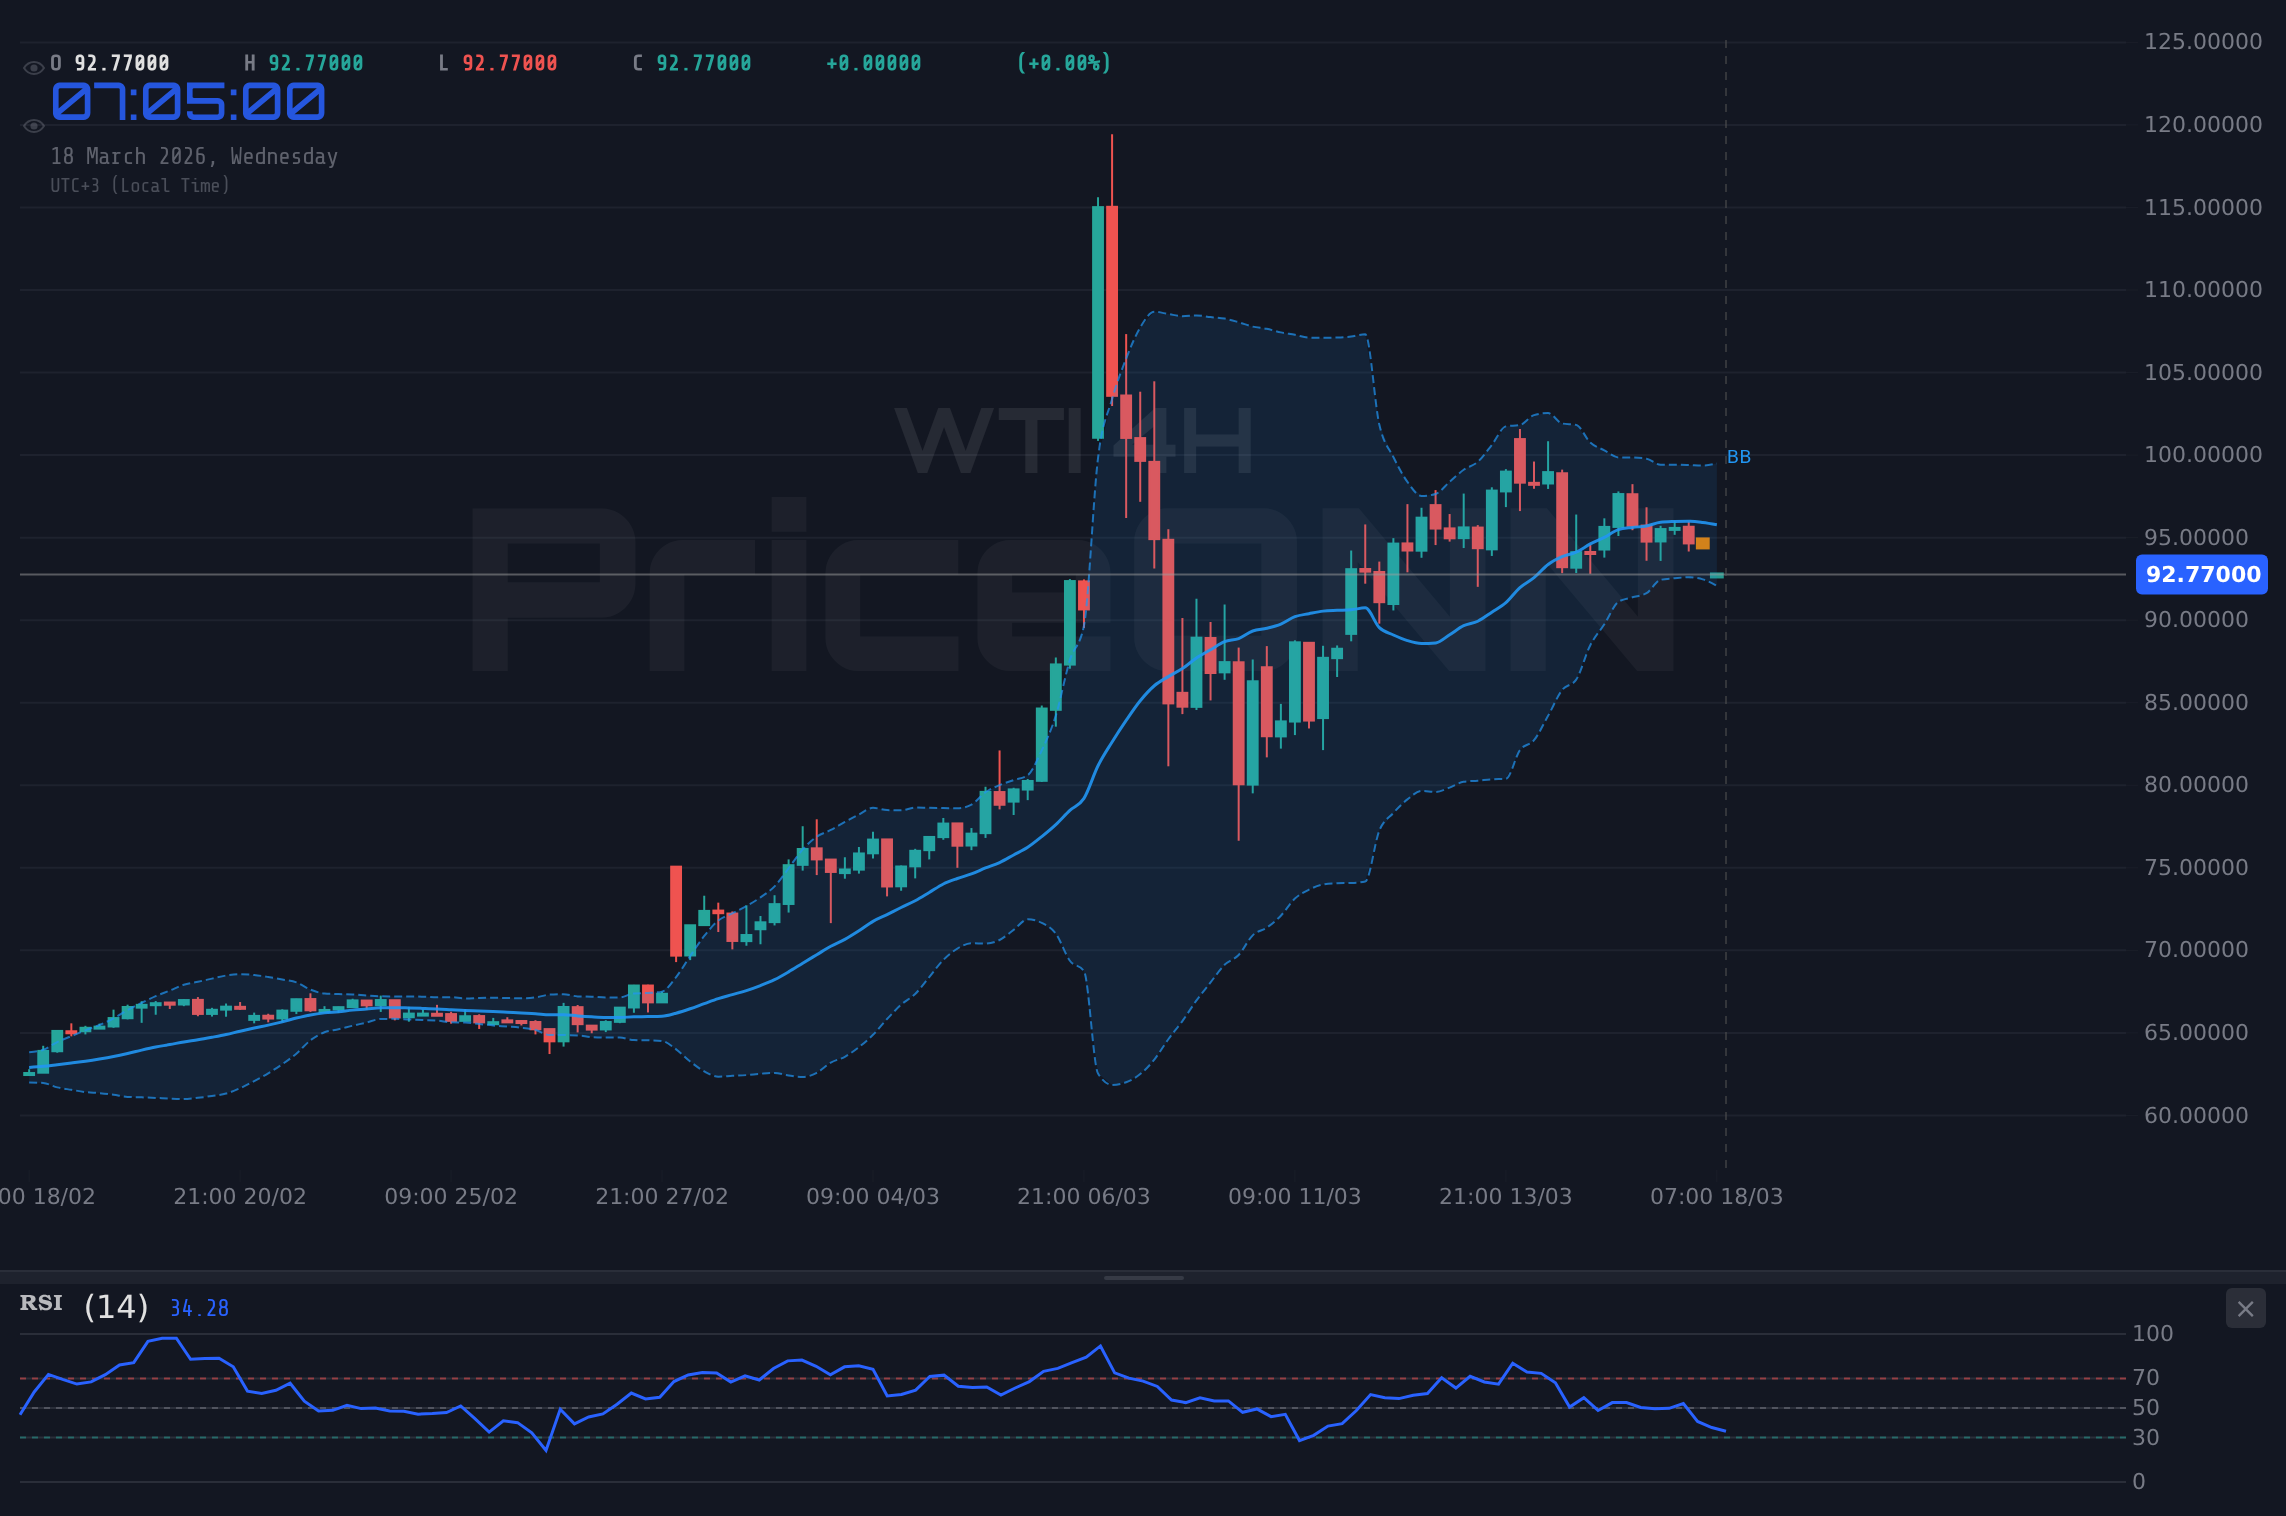
On the 1-hour timeframe, the narrative for WTI crude oil is decidedly bearish. The price, currently hovering around $92.82, is firmly entrenched in a downtrend, supported by an ADX reading of 22.4. This suggests a trend of moderate strength, but the overall picture is one of downward momentum. The MACD histogram is painting a negative picture, sitting below the signal line, which reinforces the selling pressure. Furthermore, the Stochastic Oscillator is flashing a clear sell signal, with the %K line at 19.72 well below the %D line at 52.04, indicating oversold conditions that could precede a short-term bounce, but the immediate bias is to the downside. The RSI at 35.45 also points towards oversold territory, suggesting that the selling might be nearing exhaustion in the very short term, but it doesn't negate the prevailing bearish sentiment on this timeframe. The Bollinger Bands are currently positioned below the lower band, indicating aggressive selling and potential for a minor reversal or consolidation, but the trend remains down.
The conflict arises when we shift our gaze to the daily chart. Here, WTI is in a powerful uptrend, boasting an ADX of 55.58 – a reading that signifies a very strong trend. The price is above the middle Bollinger Band, and the MACD shows positive momentum with the histogram above the signal line. The RSI at 68.48 is in the upper half of the neutral zone, approaching overbought conditions but still indicating room for upward movement. This stark contrast between the 1-hour and daily charts presents a significant challenge for traders. While the short-term outlook is bearish, the longer-term trend remains robustly bullish. This divergence implies that any short-term selling pressure might be a precursor to a larger upward move, or it could be the beginning of a significant correction within the broader uptrend. The key question is whether the shorter-term bearish signals will persist long enough to challenge the established daily uptrend, or if they are merely temporary fluctuations within a larger bullish structure.
The Crucial Role of Key Levels
The immediate price action is centered around the support level at $93.37. This level has acted as a floor in recent trading sessions, and its resilience has been crucial in preventing a steeper decline. A break below this level on significant volume would likely trigger further selling, potentially targeting the next support at $92.91. However, the daily chart suggests that even a dip to these levels might be a buying opportunity for those who believe in the strength of the overarching uptrend. On the resistance side, the 1-hour chart offers a near-term target of $101.82. This level represents a significant hurdle, and a sustained push above it would signal a shift in short-term momentum. On the daily chart, further resistance can be found at $98.02 and then $100.46. The $105.47 level is the next major psychological barrier. The current price of $92.82 is precariously poised between these conflicting support and resistance zones, making directional bets challenging without a clear break of these key levels.
The 4-hour chart presents an intermediate perspective, showing a neutral trend with an ADX of 19.76, indicating a lack of strong directional conviction in the mid-term. The RSI here sits at 47.6, firmly in neutral territory, offering no strong bias. The MACD histogram is negative, mirroring the 1-hour sentiment, but the Stochastic Oscillator is in the oversold zone, suggesting a potential for a bounce. This neutral stance on the 4-hour chart further complicates the outlook, suggesting that the market is in a consolidation phase or a period of indecision, caught between the strong daily uptrend and the bearish pressure on the hourly charts. Traders are likely waiting for a clearer signal or a decisive break of either the $93.37 support or the $101.82 resistance before committing to a significant position.
Divergent Indicators: A Trader's Dilemma
The divergence in technical indicators across different timeframes is the central theme in WTI's current market landscape. On the 1-hour chart, the overwhelming signal is 'SELL', driven by oversold RSI and Stochastic readings, negative MACD momentum, and a clear downtrend indicated by the ADX. However, the daily chart paints a contrasting picture, with a strong 'BUY' signal stemming from a very high ADX, positive MACD momentum, and RSI comfortably in the upper neutral zone. This conflict is precisely what creates choppy, range-bound conditions, where price can whipsaw traders who are trying to anticipate the next major move. The 4-hour chart, acting as a bridge between these two extremes, leans towards neutrality, further adding to the confusion. The ADX of 19.76 on this timeframe suggests that the trend strength is not yet established, making it difficult to rely on trend-following indicators.
This scenario is typical of markets that are digesting significant news or waiting for a catalyst. Factors such as global demand outlook, OPEC+ production decisions, geopolitical tensions in oil-producing regions, and inventory reports all play a crucial role in shaping sentiment. While the current price action suggests caution, the underlying strength on the daily chart implies that any significant bearish move might be temporary. The market appears to be in a state of flux, with short-term traders betting on a continuation of the hourly downtrend, while longer-term investors are likely accumulating positions, anticipating a rebound based on the daily bullish trend. The lack of clear confluence across all timeframes means that any trade taken here carries a higher degree of risk, and a disciplined approach focusing on risk management is paramount.
Geopolitical Undercurrents and Demand Outlook
Recent news indicates that Germany is considering capping fuel prices amid rising oil costs, a move that could, in theory, dampen demand. However, the impact of such localized measures on global benchmarks like WTI is often minimal unless they signal a broader trend. More significant is the news regarding Idemitsu Kosan's investment in the global LNG market. While this pertains to natural gas, it reflects a broader energy sector investment strategy and could indirectly signal expectations about energy demand and pricing trends. The U.S. is also facing challenges in controlling soaring oil prices after tapping emergency reserves, as reported by some outlets. This suggests that supply-side constraints and geopolitical risks remain potent drivers of oil prices. The ongoing tensions in major oil-producing regions, coupled with potential production adjustments by OPEC+, continue to underpin the market's bullish sentiment on longer timeframes. The market is constantly weighing the immediate bearish signals from technical indicators against the backdrop of persistent geopolitical risks and a potentially strong underlying demand structure, especially if China's economic landscape continues to improve.
The narrative surrounding U.S. shale production also remains a key factor. While shale output has been robust, the rate of growth can be influenced by various economic and regulatory factors. Any indication of slowing growth or increased drilling costs could further support the bullish case for WTI. Conversely, signs of a global economic slowdown or a significant increase in non-OPEC+ supply could challenge the current uptrend. The interplay between these fundamental drivers and the technical signals is what creates the current market complexity. For now, the price action around $92.82 and the crucial $93.37 support level will be closely watched for clues about which narrative will prevail in the short to medium term.
The Daily Chart's Bullish Conviction
Despite the intraday weakness, the daily chart for WTI crude oil presents a compelling bullish case. The price is trading above the middle Bollinger Band, and the MACD histogram is in positive territory, indicating that the broader trend remains upward. The RSI at 68.48 is strong, suggesting healthy momentum without being excessively overbought, and the ADX at 55.58 confirms a very strong trend. This suggests that any current dips might be opportunities for buyers to enter the market, anticipating a continuation of the upward move. The support levels on the daily chart, starting at $93.37, then $92.91, and further down at $91.16, are critical points where the bullish thesis could be tested. A failure to hold these levels would signal a significant shift in sentiment, but as it stands, the daily chart remains the dominant influence for longer-term traders.
The strength indicated by the daily ADX is particularly noteworthy. A reading above 50 suggests a very powerful trend, and at 55.58, WTI is firmly in such a territory. This implies that the prevailing upward move has significant underlying strength, and pullbacks are likely to be shallow and short-lived before the trend resumes. The Stochastic Oscillator on the daily chart, while showing %K below %D, is still in a position that doesn't indicate extreme overbought conditions, and the recent uptick in %K from 43.03 to potentially higher levels suggests that momentum could be building again. This reinforces the idea that the current intraday weakness might be a temporary pause rather than a reversal.
Interpreting the Conflicting Signals
The core challenge for traders right now is reconciling the bearish signals on the 1-hour chart with the bullish conviction on the daily chart. The 1-hour chart's sell signal, with RSI at 35.45 and Stochastic in oversold territory, suggests potential for a short-term bounce. However, the ADX at 22.4 indicates a trend that, while present, isn't overwhelmingly strong. This means that a bounce might be short-lived, and the larger downtrend on this timeframe could resume. Conversely, the daily chart's ADX of 55.58 points to a very strong trend, suggesting that any dips are likely buying opportunities. The MACD on the daily chart is positive, and on the hourly it's negative, creating a clear conflict. This divergence often leads to volatility and choppy price action. The market is essentially at a crossroads, with short-term traders playing for a pullback and long-term investors looking for an entry point to ride the established uptrend.
The recent news about Germany capping fuel prices, while localized, does touch upon demand concerns. However, the larger geopolitical narrative, including potential supply disruptions and OPEC+ dynamics, tends to have a more significant impact on WTI. The fact that the U.S. has depleted emergency oil reserves also points to supply-side tightness. This fundamental backdrop supports the bullish view on the daily chart. The current price around $92.82, therefore, represents a crucial test. A failure to hold the $93.37 support could invalidate the immediate bullish outlook on the daily chart and signal a deeper correction. However, if the price holds and bounces, it would confirm the strength of the daily uptrend and suggest that the hourly bearish signals were merely noise within a larger bull market.
The Path Forward: Patience and Observation
Given the conflicting signals and the pivotal price levels, the most prudent approach for traders at this juncture is one of patience and observation. Attempting to force a trade based on the prevailing hourly weakness could lead to being caught on the wrong side if the daily trend reasserts itself. Conversely, blindly buying into the daily uptrend without acknowledging the immediate bearish pressure could lead to premature entry and further losses if the short-term downtrend accelerates. The ADX readings are particularly telling; the weak trend strength on the 1-hour and 4-hour charts (22.4 and 19.76 respectively) indicates a lack of commitment from either bulls or bears. This suggests that we are likely in a consolidation or transition phase. The strong ADX on the daily chart (55.58) implies that when a directional move does occur, it is likely to be powerful.
Therefore, the immediate focus should remain on the key support at $93.37 and resistance at $101.82. A decisive break above resistance, confirmed by increasing volume and bullish indicator confluence across multiple timeframes, could signal a continuation of the daily uptrend. Conversely, a decisive break below the $93.37 support, especially on the daily chart, would invalidate the bullish thesis and open the door for a more significant correction, potentially targeting the $92.91 and $91.16 levels. Until such a break occurs, the market is likely to remain volatile and range-bound, offering limited opportunities for high-probability trades. Risk management should be the top priority, with tight stop-losses employed if any positions are taken.
Looking at the Broader Market Context
The performance of WTI is also influenced by broader market dynamics, particularly the U.S. Dollar Index (DXY) and major equity indices like the S&P 500 and Nasdaq. Currently, the DXY is trading around 99.31, showing a slight upward bias on the 1-hour chart but mixed signals overall. A strengthening dollar typically puts downward pressure on commodities priced in USD, such as crude oil. However, the daily trend for DXY is bullish (ADX 34.3), which, if sustained, could add to the headwinds for WTI. On the equity front, the S&P 500 is showing a strong bullish trend on the 1-hour chart (ADX 35.45) but a bearish trend on the daily chart (ADX 41.09), reflecting similar divergences seen in WTI. Nasdaq also shows mixed signals. This correlation analysis suggests that the broader market sentiment is also in a state of flux, which can contribute to volatility in oil prices.
The conflicting trends in equities and the dollar index add another layer of complexity to trading WTI. If risk appetite were to decline significantly, leading to a drop in equities and a rise in the DXY, it would likely exert further downward pressure on oil prices, potentially accelerating a move below the $93.37 support. Conversely, if the DXY were to weaken and equities were to rally, it would provide a more favorable backdrop for WTI to potentially break its short-term downtrend and resume its daily upward trajectory. The current price action around $92.82 suggests that these broader market forces are not providing a clear directional impetus, leaving WTI to be driven primarily by its own supply/demand fundamentals and technical configurations.
The Risk of a Bearish Breakout
While the daily chart remains bullish, ignoring the bearish signals on the shorter timeframes would be imprudent. The 1-hour chart's strong downtrend, coupled with negative MACD and oversold Stochastic/RSI, suggests that a breakdown below the critical $93.37 support level is a tangible risk. If this support fails, the next immediate target would be $92.91, followed by $91.16. A move to these levels would represent a significant correction from the current price and would likely be driven by a confluence of factors: a sustained rise in the DXY, a significant drop in equity markets, and perhaps disappointing economic data that dampens demand expectations. The ADX on the 1-hour chart, while not extremely high, does indicate a trending market, meaning that once a break occurs, it could lead to a swift move in the direction of the break. Traders should be prepared for this possibility and ensure their risk management strategies are robust.
The current lack of clear trend strength on the 4-hour chart (ADX 19.76) also means that the market could be coiling for a larger move. If the bearish momentum from the 1-hour chart gains traction and breaks through the 4-hour support levels, it could trigger a cascade of selling as algorithmic traders and short-term players react to the breakdown. The daily chart's strong ADX suggests that a reversal from such a decline would need to be significant and sustained to overcome the established trend. Therefore, while the long-term view remains bullish, the short-term technicals and the key support level at $93.37 demand extreme caution. A close below this level would be a significant bearish signal, even if the daily chart still shows underlying strength.
Conclusion: A Market at a Crossroads
WTI crude oil is currently trading at a pivotal point around $92.82. The market is exhibiting a classic case of conflicting signals, with strong bullish conviction on the daily timeframe clashing with bearish momentum on the shorter 1-hour and neutral conditions on the 4-hour chart. The critical support at $93.37 is under pressure, and its resilience will be key to determining the immediate direction. While the daily uptrend suggests that dips are buying opportunities, the short-term technicals warn of potential downside risk. Traders should exercise caution, prioritize risk management, and wait for a clear break of either the $93.37 support or the $101.82 resistance before committing to significant positions. The interplay between technicals, geopolitical events, and macroeconomic data will dictate which narrative ultimately prevails.
| Indicator | Value | Signal | Interpretation |
|---|---|---|---|
| RSI (14) | 35.45 | Bearish | Oversold on 1H, Neutral on 4H, Approaching Overbought on 1D |
| MACD Histogram | -2.77 | Bearish | Negative momentum on 1H & 4H, Positive on 1D |
| Stochastic (%K) | 19.72 | Bearish | Oversold on 1H, Mixed on 4H/1D |
| ADX | 22.4 | Neutral | Moderate trend strength on 1H, Weak on 4H, Very Strong on 1D |
| Bollinger Bands | Middle Band | Watch | Price below middle band on 1H/4H, above on 1D |
Frequently Asked Questions: WTI Analysis
What happens if WTI breaks below the $93.37 support level?
A break below $93.37 on the daily chart would invalidate the immediate bullish thesis. This could trigger further selling pressure, potentially targeting $92.91 and then $91.16, signaling a deeper correction within the broader uptrend.
Should I buy WTI at current levels near $92.82 given the conflicting signals?
Given the conflicting signals and weak trend strength on shorter timeframes (ADX 19.76 on 4H), caution is advised. While the daily trend is bullish, waiting for a clear break above $101.82 resistance or confirmation of support holding at $93.37 is recommended for a higher probability setup.
Is the RSI at 35.45 on the 1-hour chart a buy signal for WTI?
An RSI of 35.45 on the 1-hour chart indicates oversold conditions, suggesting potential for a short-term bounce. However, it is not a standalone buy signal, especially with the prevailing downtrend and negative MACD on this timeframe. Confirmation from other indicators and price action is crucial.
How will the DXY's bullish daily trend affect WTI prices this week?
The DXY's bullish daily trend (ADX 34.3) suggests potential headwinds for WTI, as a stronger dollar typically pressures oil prices. If the DXY continues to rise, it could contribute to a breakdown below WTI's $93.37 support level.
Track markets in real-time
AI-powered analysis, technical indicators and real-time price data.
Join Our Telegram Channel
Breaking market news, AI analysis and trading signals instantly.
Join Channel