DowJones30 Tests $47,389.33 Resistance: What Traders Need to Watch
DowJones30 hovers near $47,202.00 as it approaches key resistance at $47,389.33. Technical indicators show mixed signals, demanding cautious observation.
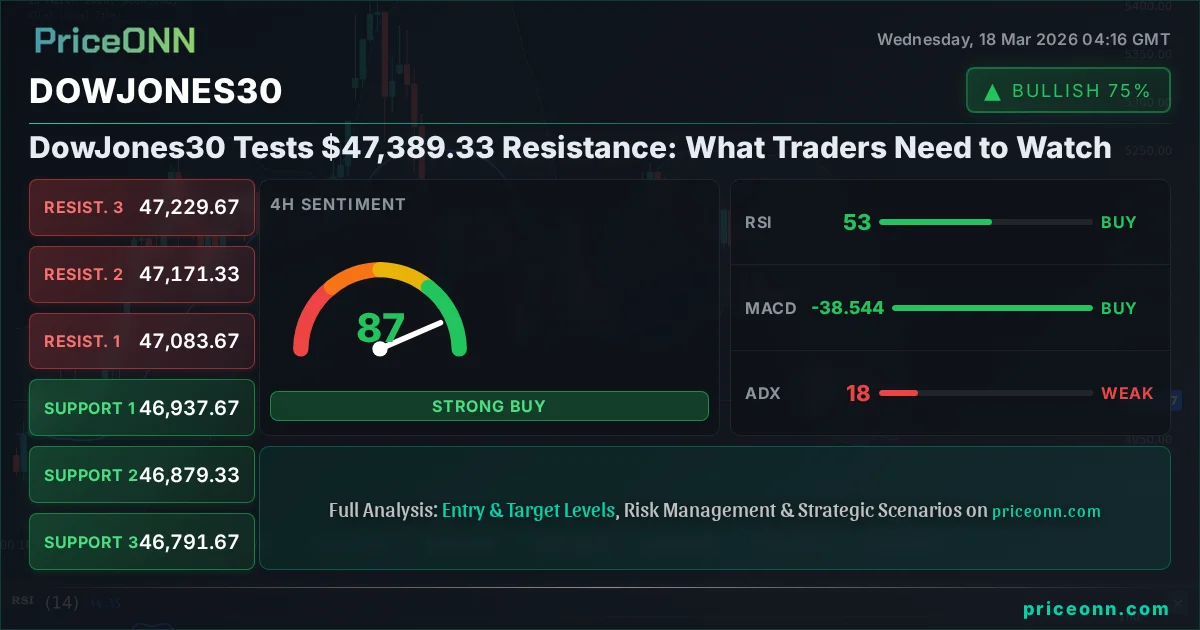
The Dow Jones Industrial Average (DJIA) finds itself at a critical juncture, currently trading around the $47,202.00 mark. This level places the index squarely in the sights of both bulls and bears as it approaches a significant resistance zone identified at $47,389.33. The current technical setup presents a complex picture, with conflicting signals from various indicators suggesting a period of consolidation or a potential breakout is on the horizon. Traders and investors are closely monitoring this pivotal area, weighing the prevailing bullish momentum against the possibility of a pullback from these elevated levels. Understanding the nuances of the current market sentiment, coupled with a deep dive into the technical indicators, is paramount for navigating the immediate future of this major US index.
- The DowJones30 is trading near $47,202.00, approaching resistance at $47,389.33.
- On the 1-day chart, the ADX reading of 41.09 signals a strong downtrend, contradicting the short-term bullish signals.
- The Stochastic oscillator on the 1-day chart shows a potential bullish signal (%K > %D), but the RSI at 45.05 indicates further downside potential.
- The DXY is at 99.32, showing a mixed but generally upward trend on the daily chart, which could pressure risk assets like the DowJones30.
- The current market sentiment is cautious, with traders awaiting clearer direction amid mixed signals.
The Dow Jones Industrial Average (DJIA) currently sits at $47,202.00, a level that has become a focal point for market participants. The approach towards the $47,389.33 resistance level is particularly noteworthy. This price point has historically acted as a barrier, and its proximity now suggests that the market is at a decision point. While the 1-hour and 4-hour charts exhibit some bullish characteristics, the longer-term daily perspective paints a more cautious, even bearish, outlook. This divergence in signals across different timeframes underscores the complexity of the current market environment. The interplay between short-term optimism and long-term technical pressures creates a scenario where patience and careful observation are key. The price action around $47,389.33 will likely dictate the next significant move for the index, making it a critical level to watch in the coming trading sessions. This nuanced technical landscape requires a thorough examination of all available data to form a coherent market view.
Navigating the Technical Landscape: A Multi-Timeframe Perspective
Delving deeper into the technicals, the 1-hour chart for the Dow Jones 30 presents a somewhat optimistic picture, with a strong bullish trend indicated by an ADX value of 29.88. The RSI at 62.74 suggests a healthy upward momentum, while the Stochastic oscillator, with %K at 91.76 and %D at 40.4, strongly signals a bullish continuation, indicating that the market is not yet overbought in this short-term timeframe and has room to run. The MACD also shows positive momentum, supporting the idea of further upside in the immediate hours. This short-term bullish bias is further reinforced by the Bollinger Bands, which show the price trading above the middle band, a common sign of an ongoing uptrend.
However, this short-term optimism is significantly tempered when we shift our focus to the 4-hour timeframe. Here, the ADX drops to 18.2, a reading that signifies a weak trend, suggesting that the market is becoming choppy or range-bound. While the RSI remains in a neutral zone at 53.03, indicating no immediate overbought or oversold conditions, the MACD histogram is positive, and the price is above the middle Bollinger Band, the overall trend strength is questionable. More concerning is the Stochastic oscillator, where %K at 59.86 and %D at 61.59 are showing a bearish crossover signal, indicating a potential downturn. This mixed picture on the 4-hour chart suggests that the earlier bullish momentum might be losing steam, and caution is warranted before assuming a sustained rally.
The daily chart presents the most significant divergence and introduces a strong bearish undertone. The ADX here is a stark 41.09, which indicates a powerful downtrend. This contradicts the short-term bullish signals observed on lower timeframes quite dramatically. The RSI at 45.05 is in the neutral zone but leans towards the lower end, suggesting that there is more room for prices to fall than to rise. The Stochastic oscillator on the daily chart also shows a potential bearish signal with %K at 47.96 and %D at 40.96, indicating a possible downward move. Although the MACD is showing negative momentum and the price is below the middle Bollinger Band, the most significant takeaway from the daily timeframe is the strong ADX reading, which suggests that any short-term rallies are likely to be met with strong selling pressure. This highlights the critical importance of the $47,389.33 resistance level; a failure to break above it decisively, especially with such a strong daily downtrend signal, could lead to a significant reversal.
The Interplay of Global Markets: DXY and Equities
The performance of the Dow Jones Industrial Average cannot be analyzed in isolation; its movements are intricately linked to broader market forces, particularly the US Dollar Index (DXY) and the performance of other major equity indices. The DXY, currently trading around 99.32, presents a mixed but generally upward trend on its daily chart, with an ADX of 34.3 indicating a strong trend. While the 1-hour and 4-hour charts show some consolidation, the daily strength of the dollar can often exert downward pressure on risk assets like the Dow Jones. A strengthening dollar typically makes US exports more expensive and can reduce the attractiveness of US equities for foreign investors, potentially capping upside potential for the index. The current DXY level suggests that dollar strength remains a factor to consider, potentially acting as a headwind for the DJIA as it approaches resistance.
Furthermore, the correlation with other major US indices like the S&P 500 and Nasdaq 100 is crucial. The S&P 500 is showing a strong bullish trend on the 1-hour chart (ADX 35.5) but a weak trend on the 4-hour (ADX 14.49) and a strong downtrend on the daily (ADX 41.09). Similarly, the Nasdaq 100 shows strong bullish trends on the 1-hour and 4-hour charts but a strong daily downtrend (ADX 32.78). This divergence across the equity landscape mirrors the complexity seen in the Dow Jones itself. The fact that both the S&P 500 and Nasdaq 100 are showing strong daily downtrend signals, despite short-term strength, reinforces the bearish sentiment derived from the Dow Jones' daily chart. This broad-based technical weakness across major indices suggests that the current price levels for the DJIA might be facing significant headwinds from both the dollar's strength and a general weakening of risk appetite across the broader market.
The recent news flow also adds context. Reports of rising crude oil prices influencing Dow Jones futures to decline near 46,850, despite the current DJIA trading higher, highlight the market's sensitivity to inflationary pressures. While Brent crude prices have seen a notable decline (-2.18%) recently, WTI prices have also fallen (-2.85%). This is somewhat counterintuitive to the idea of rising oil prices causing a decline in futures, suggesting that other factors are at play, perhaps related to demand concerns or geopolitical shifts mentioned in the news. The news about Idemitsu Kosan's investment in LNG and Germany's price cap legislation on fuel indicate shifts in energy markets, which can indirectly impact inflation expectations and, consequently, central bank policy outlooks. All these elements contribute to the cautious sentiment currently surrounding the market, making the approach to the $47,389.33 resistance level for the Dow Jones a particularly sensitive event.
Price Action and Key Levels: The $47,389.33 Battleground
The primary focus for traders right now is the resistance level at $47,389.33. On the 1-hour and 4-hour charts, this level is the immediate ceiling. A decisive break and sustained hold above $47,389.33 on these shorter timeframes could potentially trigger a short-covering rally, pushing the index towards the next resistance at $47,782.67. The confluence of bullish signals on the hourly chart, if sustained, could fuel such a move. However, the daily chart paints a different picture. With a strong downtrend ADX of 41.09 and an RSI below 50, any move above $47,389.33 might be short-lived and could be a 'bull trap' – a move that lures buyers in before reversing sharply. The key support levels on the daily chart are at $46,631.33, $46,266.67, and $46,000.00. A failure to hold the current price around $47,202.00 could see the index retest these lower levels quickly.
The significance of the $47,389.33 level is amplified by its position relative to the current price of $47,202.00. This creates a relatively tight range for immediate price action. The market sentiment is clearly divided. Short-term traders might be looking for a breakout above resistance to enter long positions, targeting the $47,782.67 level, with stops placed just below the current price or the immediate support at $47,095. Conversely, longer-term traders and those who place more weight on the daily chart's bearish signals might be looking for signs of rejection at $47,389.33 to initiate short positions. Their target would be the daily support at $46,631.33, with stops placed just above the resistance level. The probability assessment hinges heavily on whether the short-term bullish momentum can overcome the strong daily bearish trend signals. Until a clear break above $47,389.33 is confirmed with substantial volume and sustained price action across multiple timeframes, particularly the daily, the risk of a downside reversal remains elevated.
The Road Ahead: What to Watch for
Looking forward, the Dow Jones Industrial Average is at a critical juncture. The immediate battleground is the resistance zone around $47,389.33. A sustained move above this level, confirmed across daily charts, would invalidate the current bearish outlook derived from the daily ADX and RSI. In such a scenario, the next target would be the $47,782.67 resistance, with potential extension towards $48,147.33. This would likely be accompanied by a shift in sentiment, a weakening of the DXY, and a recovery in broader equity indices. However, the current technical indicators, especially on the daily chart, suggest this is less probable in the short term.
Conversely, a rejection at $47,389.33, which seems more likely given the strong daily trend signals, would open the door for a decline towards the daily support levels. The first significant level to watch would be $46,631.33. A break below this point could accelerate the selling pressure, potentially targeting $46,266.67 and even $45,873.33. This downside scenario would likely be supported by a strengthening dollar, increased risk aversion in the markets, and potentially negative economic data releases. Traders should pay close attention to the volume accompanying any move at these key levels; high volume on a breakout or breakdown would lend more credibility to the move.
The conflicting signals between short-term bullish trends and the dominant daily bearish trend create a high degree of uncertainty. This is a market where patience is a virtue. Waiting for a clear confirmation – either a decisive breakout above $47,389.33 or a solid rejection leading to a move below $47,095 (a short-term support) – is crucial. The ADX readings across different timeframes are particularly telling: strong trends on the 1-hour and daily charts in opposite directions suggest a period of indecision or a significant shift is imminent. The market is essentially holding its breath around these key levels, and any catalyst, whether it be economic data, central bank commentary, or geopolitical news, could be the trigger for the next significant move.
FAQ Section
Frequently Asked Questions: DowJones30 Analysis
What happens if DowJones30 breaks above $47,389.33 resistance with strong conviction?
A decisive and sustained break above $47,389.33, especially with high volume on the daily chart, would signal a bullish reversal. This could trigger a rally towards the next resistance at $47,782.67, and potentially higher towards $48,147.33 as short-sellers are squeezed out and new buyers enter the market.
Should I consider buying DowJones30 at current levels near $47,202.00 given the mixed signals?
Buying at current levels of $47,202.00 is risky due to the approaching resistance at $47,389.33 and the strong daily downtrend signals (ADX 41.09). A more prudent approach would be to wait for confirmation: either a clear breakout above resistance or a pullback to a more defined support level like $46,631.33.
Is the RSI at 45.05 on the daily chart a sell signal for DowJones30 right now?
An RSI of 45.05 on the daily chart is not an extreme oversold or overbought signal, but it leans towards bearish territory, indicating more room for downside than upside. It suggests that while the index is not in panic selling territory, the momentum is not strongly bullish, aligning with the overall cautious outlook.
How might the DXY's trend around 99.32 affect the DowJones30's move towards $47,389.33?
The DXY's strong daily uptrend (ADX 34.3) around 99.32 suggests dollar strength, which typically acts as a headwind for risk assets like the DowJones30. This dollar strength could contribute to capping the upside potential near the $47,389.33 resistance, making a rejection more probable.
Track markets in real-time
AI-powered analysis, technical indicators and real-time price data.
Join Our Telegram Channel
Breaking market news, AI analysis and trading signals instantly.
Join Channel