Brent Crude Tests Resistance at $103.77: Is $105.05 Next?
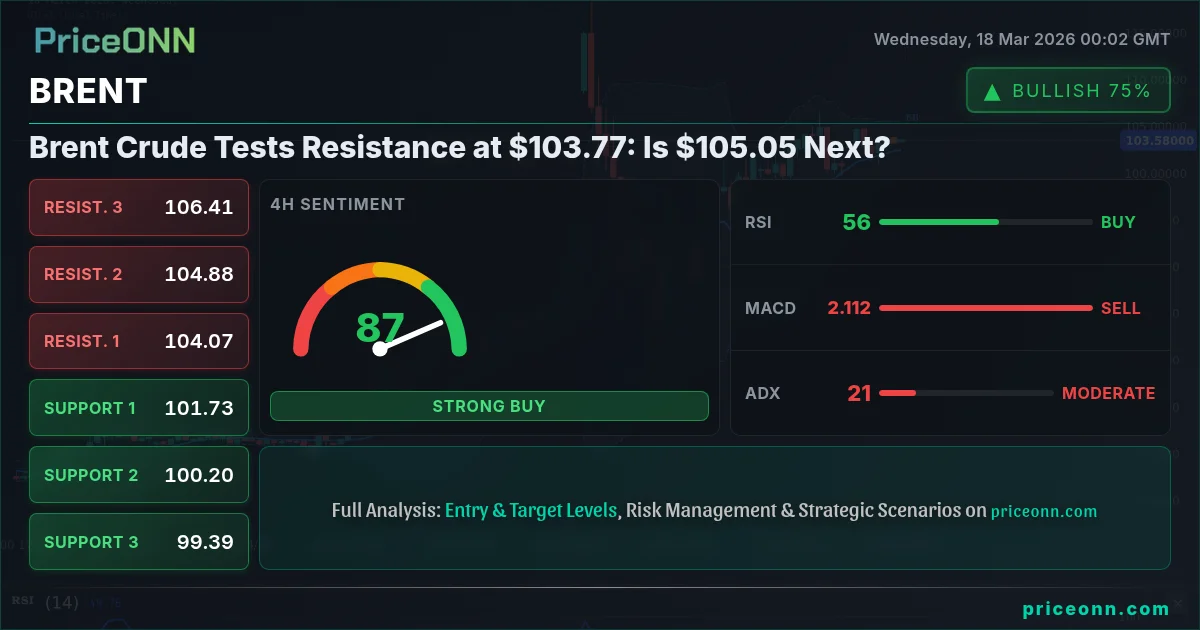
Brent Crude is trading at $103.77 as traders eye resistance levels. Technical indicators suggest a cautious approach ahead of potential upside.
The global oil market is at a fascinating crossroads. With Brent Crude currently hovering around the $103.77 mark, the question on every trader's mind is whether the recent upward momentum can overcome key resistance levels, or if we're set for a pullback. This isn't just about a single commodity's price; it's a barometer for broader economic sentiment, geopolitical tensions, and inflation expectations worldwide. The surge past $100 has certainly grabbed attention, but the real test lies ahead, particularly as we approach the critical $105.05 level.
- Brent Crude is trading at $103.77, showing a strong daily upward move of 2.89%.
- Key resistance sits at $104.07 (4H) and $104.93 (1H), with a significant psychological level at $105.05.
- The 1D RSI at 81.73 signals extreme overbought conditions, suggesting potential for a pullback despite the strong trend.
- Geopolitical factors and inflation expectations remain key drivers, with Germany's fuel price capping legislation offering a counter-narrative to soaring energy costs.
The Macro Picture: Inflation, Geopolitics, and the Dollar's Shadow
The dramatic rally in Brent Crude, pushing it past $100 and now testing resistance near $104, isn't happening in a vacuum. It’s deeply intertwined with a complex web of global macroeconomic forces. Firstly, persistent inflation concerns worldwide are keeping energy prices elevated. While some regions, like Germany, are attempting to cap fuel price hikes – a move that could theoretically dampen demand – the broader narrative remains one of supply constraints and geopolitical risk premiums. The ongoing tensions in various regions continue to cast a shadow over supply security, ensuring that even minor disruptions can send prices soaring. This environment naturally supports commodities like oil, acting as a potential hedge against rising costs.
Furthermore, the US Dollar Index (DXY) plays a crucial role. While the DXY is currently showing a slight daily pullback to 99.32, its overall trend is still upward on the daily chart (99.14 support, 99.88 resistance). A strengthening dollar typically exerts downward pressure on dollar-denominated commodities like Brent, as they become more expensive for holders of other currencies. However, the current surge in oil prices seems to be overpowering this effect, at least in the short term. This divergence warrants close observation; if the DXY breaks decisively higher, it could provide a significant headwind for oil bulls. For now, the market seems more focused on the supply-side pressures and inflation narrative.
The correlation between oil prices and major equity indices also offers context. While the S&P 500 is showing a daily gain of 0.24% to 6711.05, its longer-term trend on the daily chart is bearish (support at 6628.43, resistance at 6745.53). Similarly, the Nasdaq 100, though up 0.52% today to 24773.25, also exhibits a bearish daily trend (support at 24350.47, resistance at 24871.19). A general risk-off sentiment in equities, often driven by inflation fears or tightening monetary policy, can paradoxically support oil prices if the market perceives oil as a safe-haven asset or a better inflation hedge than equities. However, a severe equity downturn could eventually spill over into commodities, dampening demand expectations.
Technical Breakdown: Brent Crude on the Charts
Turning to the charts, Brent Crude presents a compelling picture across multiple timeframes. On the 1-hour chart, the trend is clearly bullish with a strength of 81%, supported by positive MACD momentum and Stochastic showing a bullish signal (%K > %D) in the 90.71 range. The price is trading above the middle Bollinger Band, indicating upward pressure. However, the RSI(14) at 54.92 suggests there's still room to run before hitting overbought territory on this shorter timeframe, though it’s creeping up.
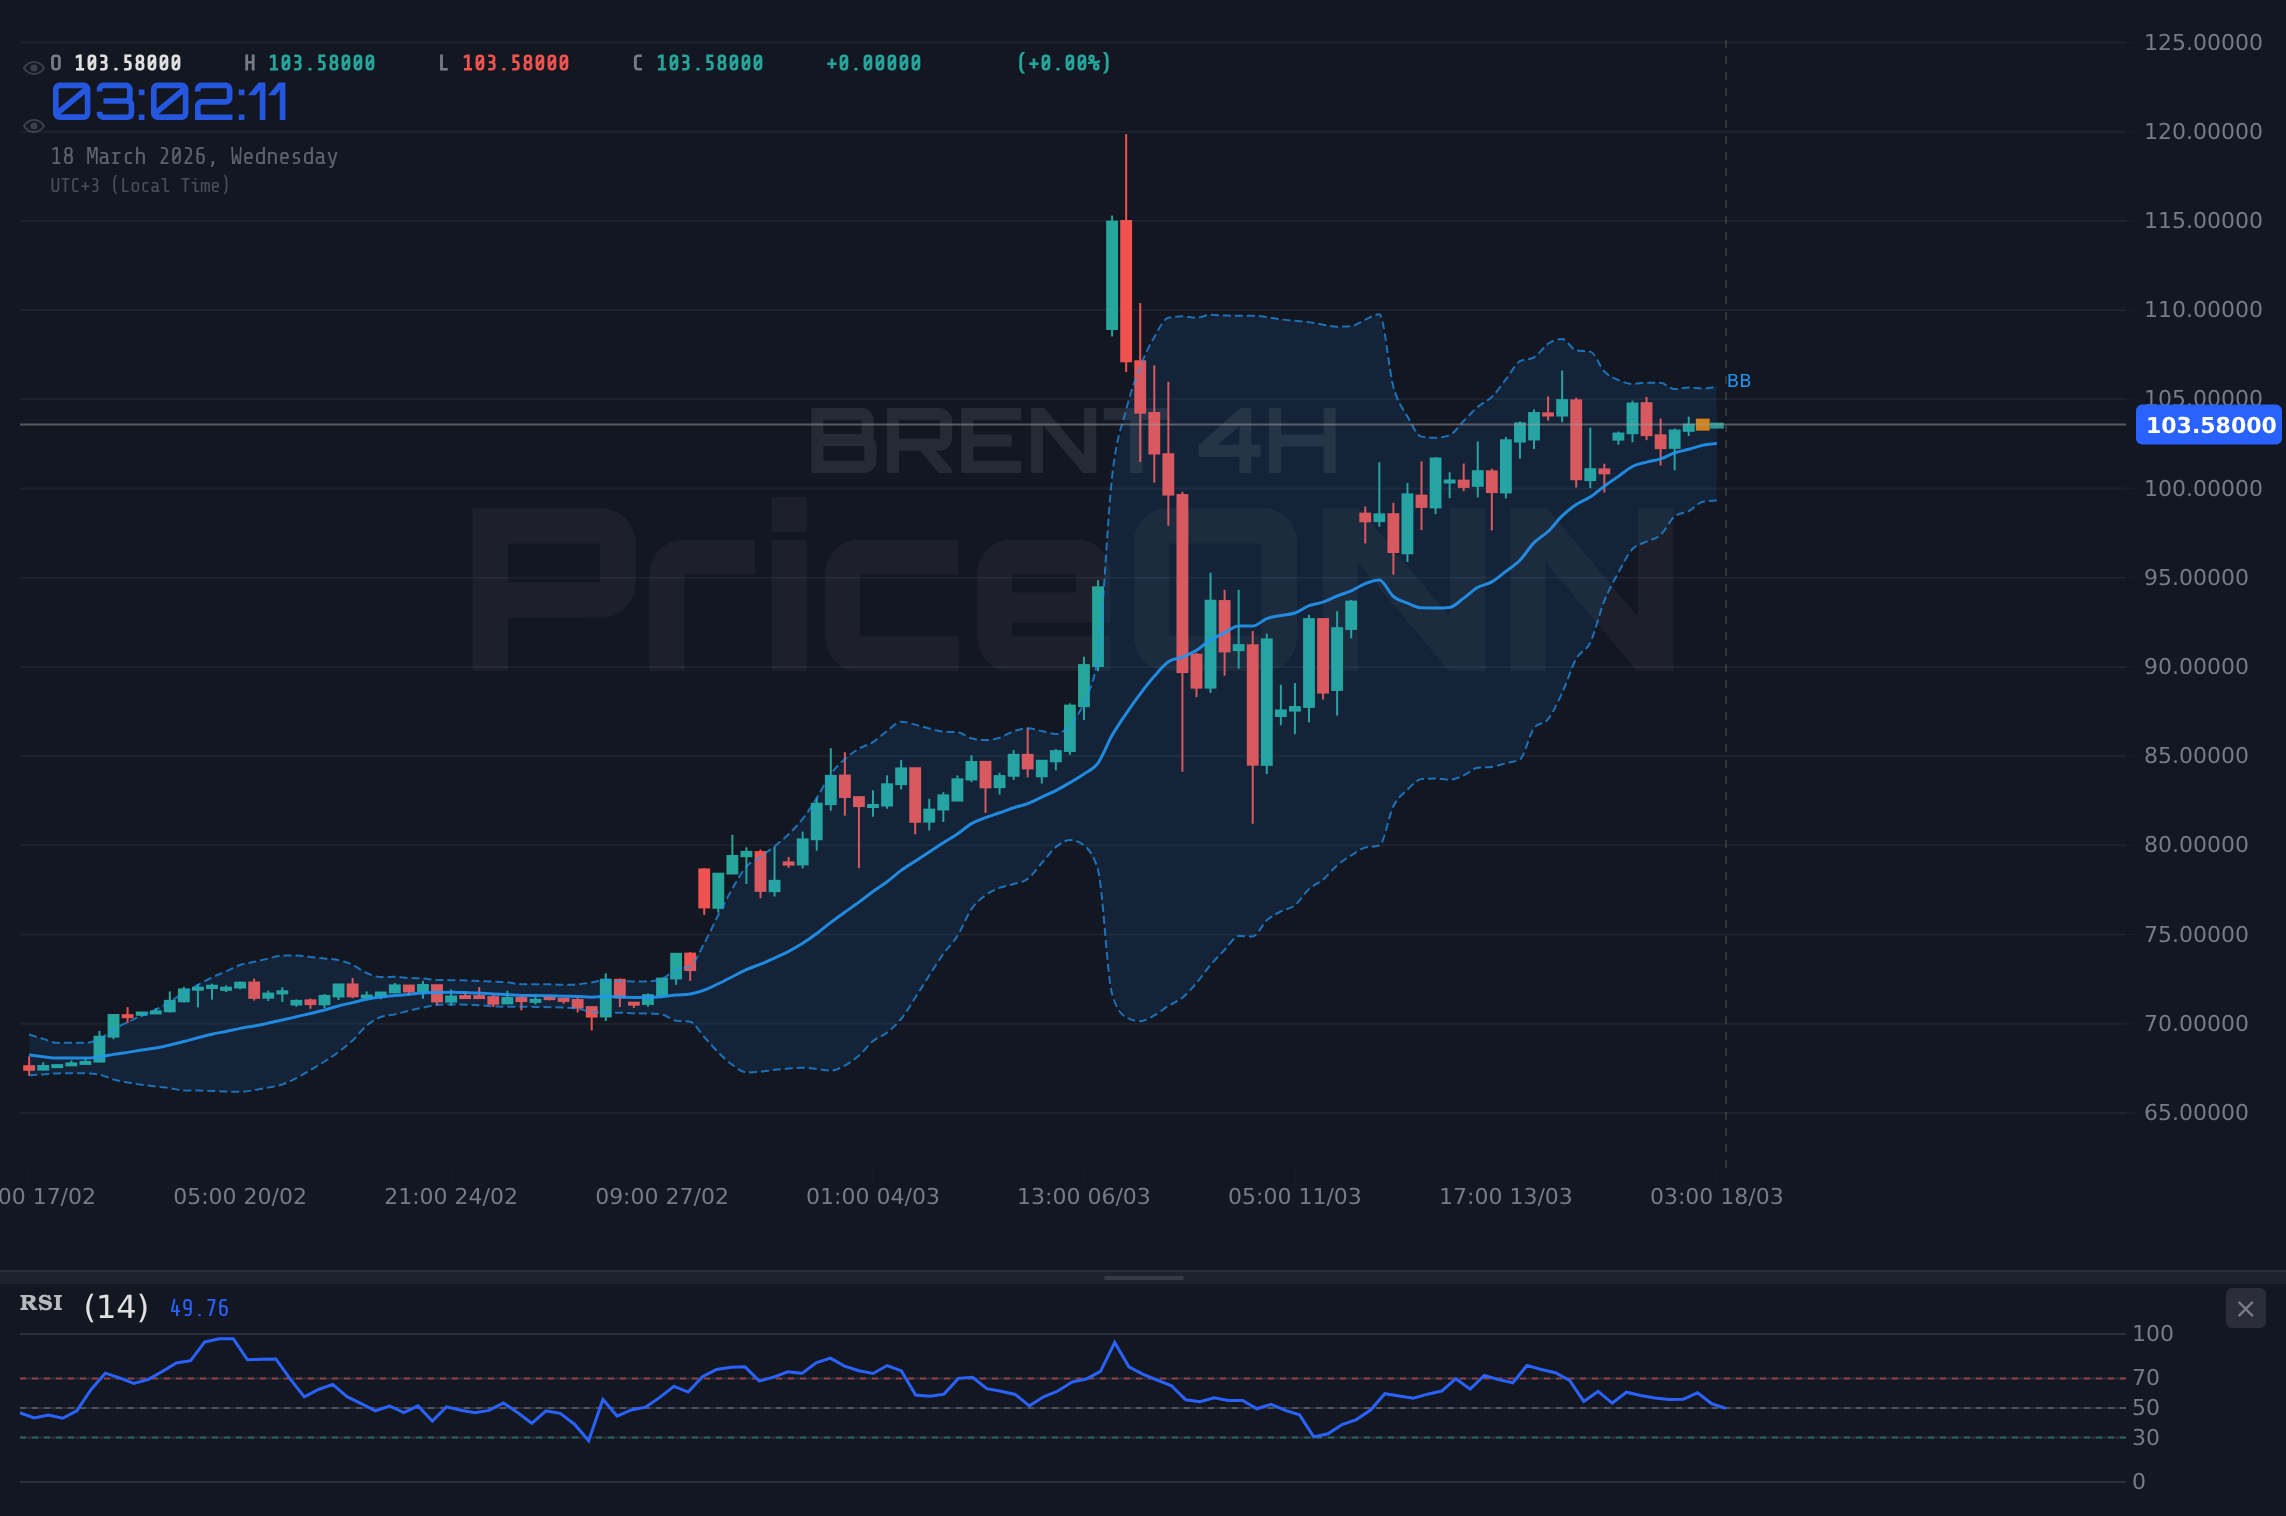
The 4-hour chart reinforces the bullish bias, although the trend strength moderates slightly to 50% as it hovers around neutral. The MACD shows negative momentum here, which is a slight divergence from the 1-hour, but Stochastic is still in bullish territory, and the price is above the middle Bollinger Band. The RSI at 58.03 also indicates a healthy upward move without extreme overbought conditions. The ADX at 21.34 suggests a moderate uptrend is in play, not yet a runaway train, but certainly a trend.
However, the daily chart is where the real caution flags begin to wave. The trend is unequivocally bullish with 100% strength, and prices are above the middle Bollinger Band. The MACD is positive, and Stochastic is giving a bullish signal. BUT, the RSI(14) is sitting at a very high 81.73. This is deep into overbought territory. While RSI can stay elevated for extended periods in strong trends, it signals that the market is stretched and ripe for a correction or consolidation. The ADX at 59.72 confirms an extremely strong trend, but such strong trends often experience sharp, albeit temporary, pullbacks. The immediate resistance levels on the daily chart are clear: $105.05, followed by $109.24 and $111.88.
Crucially, the immediate support levels must be respected. On the 1-hour chart, $103.39 and $102.94 are key. On the 4-hour, $101.73 and $100.20 become more significant. The daily chart shows support at $98.22 and $95.58. A break below the 4-hour support at $101.73 would be the first sign of a potential trend shift or deeper correction, especially if accompanied by increased volume and negative shifts in shorter-term momentum indicators.
The $105.05 Threshold: What Lies Beyond?
The $105.05 level is more than just a number; it's a critical psychological and technical barrier. If Brent Crude can decisively break above this level on significant volume, it would signal a continuation of the bullish trend, potentially targeting the next resistance at $109.24. This scenario would likely be fueled by escalating geopolitical tensions or news of unexpected supply disruptions. The strong daily uptrend, despite the overbought RSI, suggests that momentum traders might be looking to chase this breakout, expecting further upside. The ADX at 59.72 indicates that once a move starts, it has the power to extend significantly.
However, the extreme readings on the daily RSI (81.73) cannot be ignored. This suggests that the market is overheated and vulnerable to profit-taking. A failure to break $105.05, followed by a move back below the 4-hour support at $101.73, could trigger a sharp sell-off. In such a case, the first target would be the $100.20 area, and a more significant drop could see prices revisit the $98.22 support level. This bearish scenario would be amplified if the US Dollar Index (DXY) starts a strong rally, or if risk appetite in global equities improves dramatically, leading investors away from commodities.
The German news about capping fuel prices is an interesting counterpoint. While it's a national measure, any sign of coordinated efforts to curb energy demand could, in theory, put a lid on prices. However, given the current geopolitical climate and the underlying supply fundamentals, it's unlikely to be enough to derail the broader bullish trend unless accompanied by a significant de-escalation of global conflicts or a major shift in central bank policy towards easing.
From a trading perspective, the current setup at $103.77 presents a dilemma. Chasing the price higher risks buying at the top of a short-term rally, especially with the daily RSI screaming 'overbought'. Conversely, betting on a pullback carries the risk of being caught on the wrong side of a strong trend, particularly if geopolitical news provides further fuel for the rally. This is precisely why the WATCH_ZONE decision is appropriate here. A clear break above $105.05 on strong volume would validate the bullish continuation, while a decisive close below the 4-hour support at $101.73 would signal a potential reversal.
What’s Next for Brent Crude?
Looking ahead, the path for Brent Crude will likely be dictated by a tug-of-war between persistent supply concerns and inflation fears on one side, and potential demand destruction and strengthening dollar headwinds on the other. The geopolitical landscape remains the most significant wildcard. Any escalation or de-escalation in key regions could trigger rapid price movements. Traders will be closely watching for any further news from Germany or other major economies regarding energy demand management policies.
Technically, the $105.05 resistance level is the immediate hurdle. A sustained break above this point, confirmed by daily closes and strong volume, would open the door for further upside towards $109.24. However, the extremely high daily RSI reading at 81.73 suggests that caution is warranted. A more probable scenario in the short term might be consolidation or a pullback towards the $101.73-$103.39 range, especially if the DXY finds its footing. The key for traders is to wait for confirmation – either a decisive breakout above resistance or a clear breakdown below support – before committing to significant positions.
The strong ADX readings across timeframes (1H: 12.36, 4H: 21.34, 1D: 59.72) indicate that when a trend does establish, it has significant power. The current daily trend is exceptionally strong, but the RSI warns of exhaustion. This creates a volatile environment where sharp moves are possible in either direction. Risk management remains paramount. For those looking for long opportunities, waiting for a pullback to a more sensible support level or confirmation of a sustained breakout above $105.05 would be prudent. For short-term traders, monitoring the immediate 1-hour resistance at $104.16 and support at $103.39 will be key to navigating the intraday chop.
Frequently Asked Questions: BRENT Analysis
What happens if BRENT breaks above the $105.05 resistance level?
A decisive break above $105.05 on strong volume, confirmed by the daily RSI moving out of overbought territory, would likely signal a continuation of the bullish trend. This could target the next resistance level at $109.24, supported by the very strong daily ADX of 59.72.
Should I buy BRENT at current levels around $103.77 given the daily RSI is at 81.73?
Buying at current levels carries significant risk due to the extreme overbought RSI reading on the daily chart. A more prudent approach would be to wait for a pullback to support levels like $101.73 or for confirmation of a sustained breakout above $105.05. Patience is key.
Is the daily ADX at 59.72 a sign of a runaway trend or an overheated market for BRENT?
An ADX of 59.72 indicates an extremely strong trend is in place. However, when combined with a daily RSI of 81.73, it signals that the market is significantly extended and vulnerable to sharp corrections or consolidations, despite the trend's strength.
How will the German fuel price cap news affect BRENT prices this week?
While Germany's move to cap fuel prices is a bearish signal for demand, its impact on the global BRENT price is likely limited given the strong geopolitical risk premiums and broader inflation concerns. It may contribute to short-term volatility but is unlikely to derail the current uptrend unless accompanied by significant de-escalation or coordinated global demand-side measures.
| Indicator | Value | Signal | Interpretation |
|---|---|---|---|
| RSI (14) | 81.73 | Overbought | Extreme readings suggest potential pullback or consolidation. |
| MACD | Positive | Bullish Momentum | Supports the ongoing uptrend on daily charts. |
| Stochastic | K=56.84, D=53.3 | Bullish Crossover | Confirms upward momentum, though nearing overbought. |
| ADX | 59.72 | Very Strong Trend | Indicates a powerful trend, but also potential for exhaustion. |
| Bollinger | Middle Band Breakout | Bullish | Price trading above the middle band confirms upward pressure. |
Track markets in real-time
AI-powered analysis, technical indicators and real-time price data.
Join Our Telegram Channel
Breaking market news, AI analysis and trading signals instantly.
Join Channel