AUDUSD Hovers Near $0.71125 Resistance: A Technical Deep-Dive
AUDUSD trades near $0.71125 resistance. Technical indicators show mixed signals across timeframes, with ADX suggesting a choppy market. Key levels to watch.
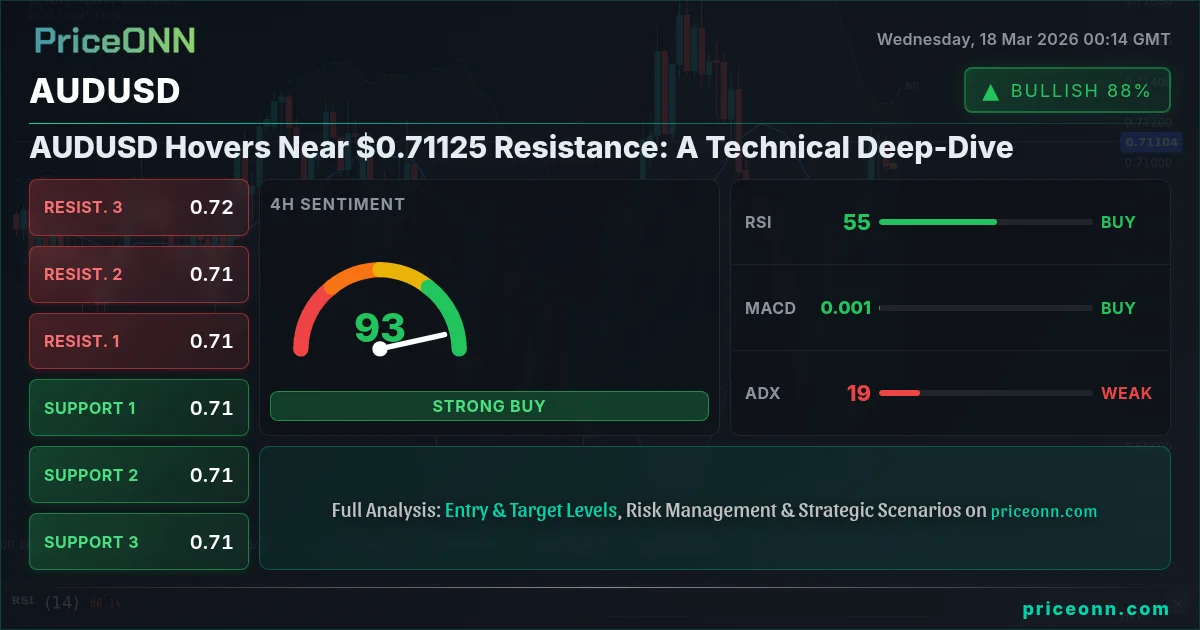
The Australian Dollar against the US Dollar (AUDUSD) is currently navigating a critical juncture, trading near the $0.71125 mark. This price point isn't just a number; it represents a confluence of recent price action and a notable resistance level that traders are watching closely. As the market grapples with mixed signals from various technical indicators, understanding the nuances of the current AUDUSD setup is paramount for any serious trader looking to navigate these choppy waters. We're seeing a real tug-of-war between short-term momentum and longer-term trend indicators, painting a picture of indecision that requires careful analysis before any significant moves are made.
- AUDUSD is currently trading at $0.71125, hovering near a key resistance level.
- The 1-hour RSI at 62.45 signals potential overbought conditions, while the 1-day RSI at 42.81 indicates a downward trend.
- ADX readings are low across multiple timeframes (18.79 on 4H, 22.9 on 1H, 23.07 on 1D), suggesting a lack of strong directional momentum.
- The current market environment presents a 'watch zone' scenario, requiring a clear break of key levels for a high-probability trade setup.
- Geopolitical tensions and central bank policy shifts remain underlying factors influencing AUDUSD's correlation with global risk sentiment.
Navigating the Choppy Waters: A Multi-Timeframe Technical Overview
Diving into the 1-hour chart for AUDUSD, we see a picture of cautious optimism. The price is hovering around $0.71125, just shy of the immediate resistance at $0.71141. The RSI(14) is sitting at 62.45, which, while not yet in extreme overbought territory, certainly suggests that the recent upward momentum might be losing some steam. This is corroborated by the Stochastic oscillator, where the %K line at 65.2 is just below the %D line at 66.7, hinting at a potential pullback. However, the MACD remains in positive territory, and the ADX at 22.9 indicates a moderately strong trend is in play, albeit not a runaway one. The Bollinger Bands are showing the price trading above the middle band, suggesting an upward bias in the very short term, but the overall 'General Signal' leaning towards 'BUY' (7 Buy, 1 Sell, 1 Neutral) indicates that while buyers are present, the conviction isn't overwhelming.
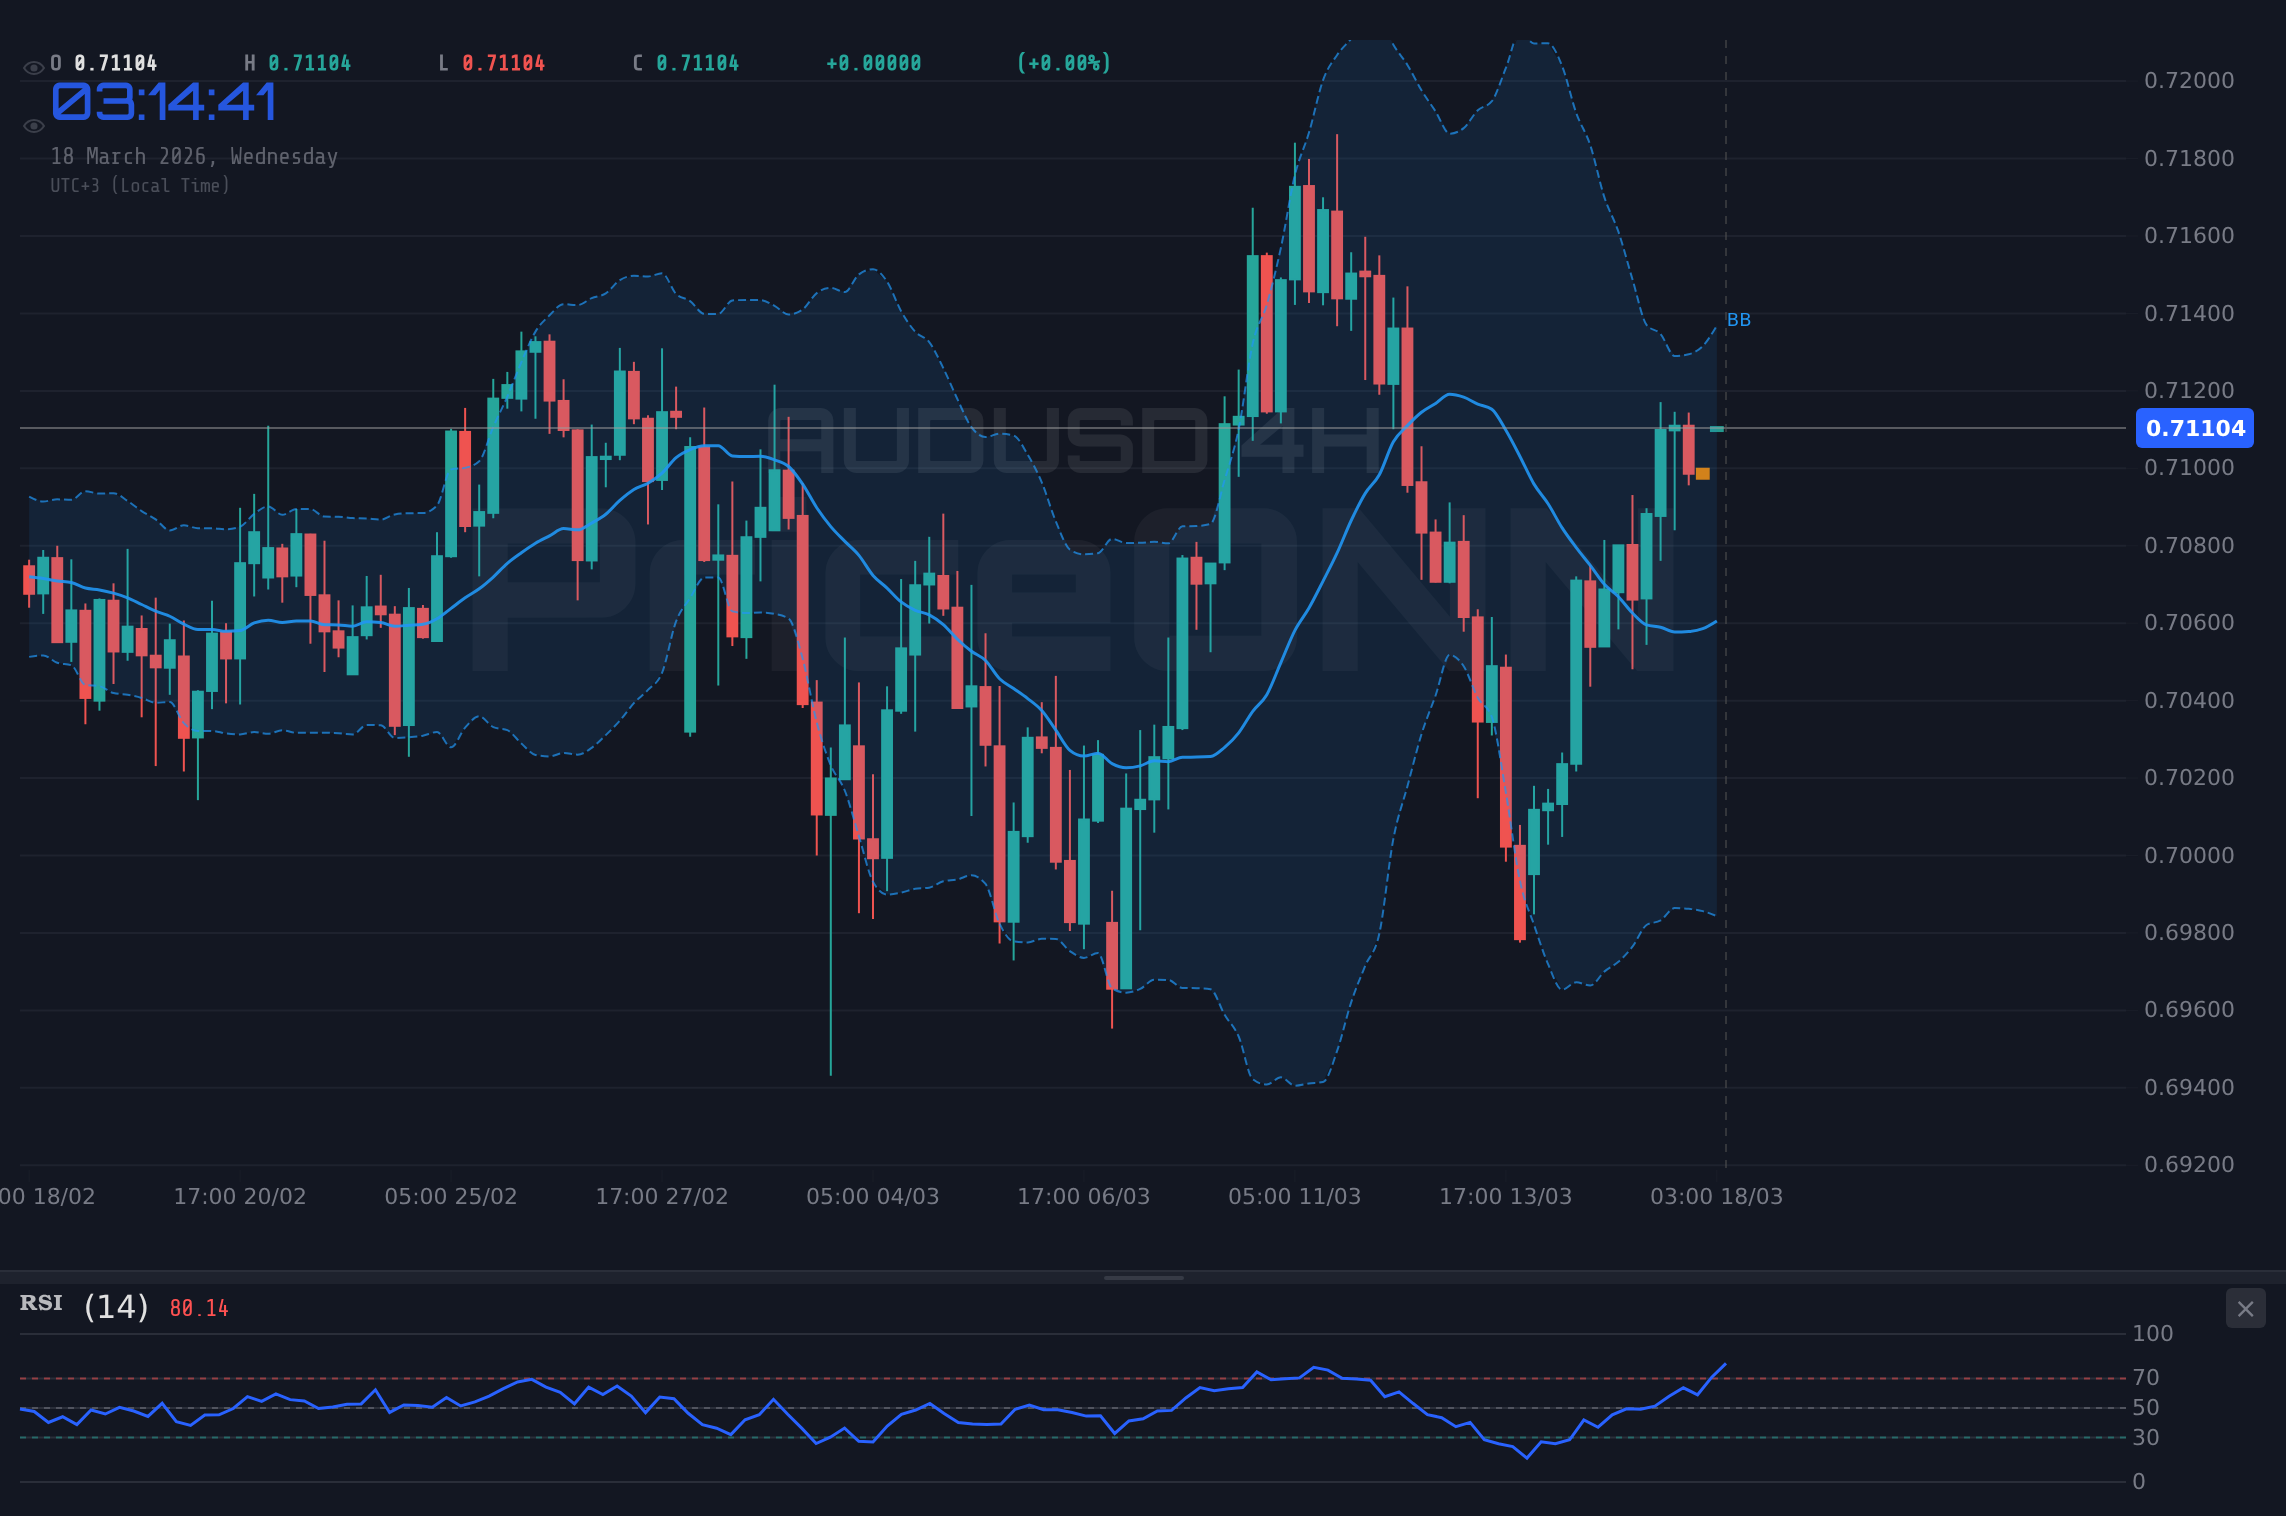
Moving to the 4-hour timeframe, the picture becomes more nuanced, bordering on neutral. The AUDUSD is trading around $0.71125, and the resistance level at $0.71224 is within touching distance. Here, the RSI(14) is at 55.08, firmly in neutral territory and showing a slight upward inclination, which aligns with the overall trend direction. The MACD is also showing positive momentum, sitting above its signal line. However, the Stochastic oscillator is a bit more cautionary: %K is at 89.63 and %D is at 89.83, both deep in overbought territory and showing a bearish divergence (%K < %D). This suggests that while the price might push a little higher, the underlying strength is waning, and a reversal could be imminent. The ADX at 18.79 is particularly telling; it signifies a weak trend, meaning the market is likely range-bound or consolidating, making it difficult for strong directional trades. The overall signal here is 'BUY' (7 Buy, 1 Sell, 0 Neutral), but this is heavily influenced by short-term momentum, and the overbought Stochastics on this timeframe are a warning sign.
The daily chart offers a broader perspective, and frankly, it's where the real caution lies. AUDUSD is currently priced at $0.71125, but the daily chart shows a clear downtrend, with the price below the middle Bollinger Band and the RSI(14) at 54.8, indicating a potential for further downside if the current trend reasserts itself. The MACD is in negative territory, below its signal line, reinforcing the bearish bias on the daily timeframe. The Stochastic oscillator is showing %K at 41.88 and %D at 57.14, giving a bearish signal. While the ADX at 23.07 still suggests a trend is present, it's not as strong as on the shorter timeframes, and the overall 'General Signal' is 'BUY' (6 Buy, 2 Sell, 0 Neutral), which seems to be heavily influenced by the intraday strength. This divergence across timeframes is precisely why the current price action near resistance needs careful handling. The daily chart is whispering caution, while the hourly chart is shouting a tentative 'buy'. This conflict is the hallmark of a market in transition or consolidation.
The Crucial Role of Key Levels: Where Does AUDUSD Go Next?
Let's talk about the price levels that truly matter. On the upside, the immediate resistance is clearly defined. The 1-hour chart points to $0.71141 as the first hurdle, followed by $0.71224 on the 4-hour chart. If AUDUSD manages to break decisively above $0.71224, especially with increasing volume and confirmation from other indicators, it could signal a shift towards the next significant resistance at $0.71338. This would imply that the short-term bullish momentum is gaining traction and potentially overriding the daily bearish sentiment. The $0.7200 target, which is an emerging query in trader searches, would then become a more tangible objective, although it's currently a fair distance away.
Conversely, downside support levels are critical to monitor. On the 1-hour chart, support can be found at $0.71003, then $0.70941. A break below these levels could accelerate selling pressure. Looking at the 4-hour chart, the first significant support comes in at $0.70918, followed by $0.70726. A decisive move below $0.70918 would strongly suggest that the daily bearish trend is reasserting itself, potentially opening the door for a test of the daily support levels, starting with $0.70085. The fact that the ADX is relatively low across all timeframes (hovering in the low 20s) indicates that strong trends are not yet established, meaning we could see sharp but short-lived moves in either direction before a clearer trend emerges. This is why risk management is so vital right now.
The interplay between these resistance and support levels, especially in conjunction with the conflicting indicator signals, creates what I call a 'watch zone'. We are not yet at a point where a high-conviction trade setup is screaming 'enter now'. Instead, we are in a phase where patience is key. A trader might look for confirmation of a breakout above $0.71224 on the 4-hour chart, perhaps with a sustained RSI above 60 and a MACD crossover, to consider a long position targeting higher levels. Alternatively, a clear break and hold below the 1-hour support at $0.71003, accompanied by a daily RSI dip towards 40, could present a shorting opportunity, aiming for the $0.70085 area. The current price action near $0.71125 is more about observing and waiting for the market to reveal its hand.
Trade Stance: Patience in the Face of Uncertainty
Given the current technical landscape for AUDUSD, my trade recommendation leans towards a 'WATCH_ZONE' approach. The ADX readings across the hourly, 4-hour, and daily charts are relatively low, particularly the 18.79 on the 4-hour chart and 23.07 on the daily, which signals a lack of strong, committed trend. While the 1-hour chart shows some bullish momentum with an RSI of 62.45 and a 'BUY' signal, the 4-hour and daily charts present a more cautious, even bearish, outlook with overbought stochastic conditions on the 4-hour and a bearish MACD on the daily. This conflict across timeframes means that entering a trade right now would be speculative rather than based on high-probability signals.
What we need to see is a clear catalyst or a decisive break of a key level. For a bullish scenario to gain traction, a sustained close above the 4-hour resistance at $0.71224 would be crucial. This would need to be accompanied by the daily RSI moving back above 50 and ideally the MACD showing renewed positive momentum. Such a development would validate the short-term bullish signals and potentially open the door for a move towards the $0.7200 target, an emerging query among traders. The strength of this move would also be influenced by the DXY, which is currently consolidating near 99.28. A falling DXY would typically support an AUDUSD rally, providing an additional tailwind.
On the bearish side, a failure to break above $0.71224 and a subsequent close below the 1-hour support at $0.71003 would be a significant bearish development. This would likely confirm the daily downtrend, potentially leading to a test of the $0.70918 support on the 4-hour chart and further down towards the daily support at $0.70085. The recent news about the RBA's narrow rate hike decision, as mentioned in market commentary, could also contribute to downside pressure if it signals a less hawkish stance compared to other central banks, potentially weakening the Australian Dollar. Until one of these scenarios plays out with conviction, the prudent approach is to observe from the sidelines and wait for a clearer picture to emerge. This disciplined approach is what separates successful traders from those who chase the market.
Fundamental Undercurrents: What's Driving the Aussie?
While the technical charts provide a granular view of price action, it's crucial to understand the fundamental forces at play that influence AUDUSD. The Australian Dollar, often sensitive to global risk sentiment and commodity prices, is currently caught between conflicting global economic narratives. The recent news regarding the RBA's narrow rate hike decision is particularly noteworthy. A split decision among policymakers suggests a lack of strong consensus on the future path of monetary policy, which can create uncertainty around the AUD. This contrasts with the broader global trend of central banks potentially pausing or signaling an end to aggressive tightening cycles, although the Fed's upcoming decision remains a key event to watch. The DXY's consolidation near 99.28 also plays a role; if the dollar index were to break higher, it would typically exert downward pressure on AUDUSD, and vice-versa.
Commodity prices, a traditional driver for the Australian Dollar, present a mixed picture. Brent crude oil is surging past $103.77, indicating inflationary pressures and potential geopolitical risks in energy markets. While higher commodity prices can sometimes benefit commodity-exporting nations like Australia, the overall global economic outlook and risk appetite are also critical. The fact that US stock futures experienced a downturn early Tuesday, despite oil prices surging, suggests that the market might be more concerned about inflation and interest rate hikes than the boost from higher energy prices. This risk-off sentiment, if it persists, could weigh on riskier currencies like the AUD. The recent 2% tumble in silver, despite a weaker dollar and falling yields, further underscores this complex market environment where traditional correlations are being tested.
Looking ahead, the economic calendar will be crucial. Upcoming inflation data and central bank communications, particularly from the US Federal Reserve and potentially the Bank of England, will provide further direction. If inflation proves to be stickier than expected, it could force central banks to maintain a hawkish stance, supporting currencies like the USD and potentially pressuring AUDUSD. Conversely, signs of cooling inflation could lead to a 'risk-on' environment, benefiting the Aussie. The 'audusd fundamentals' query is gaining traction, reflecting trader interest in these macro drivers. Understanding how these global factors interact with domestic Australian economic data will be key to deciphering the future direction of AUDUSD. The market is constantly seeking clarity, and until that clarity arrives, expect continued choppiness.
The Path Forward: Preparing for the Next Move
The AUDUSD is currently in a state of technical indecision, trading near $0.71125 and caught between conflicting signals across different timeframes. The 1-hour chart shows some bullish momentum, but it's tempered by overbought conditions on the Stochastic and a neutral RSI. The 4-hour chart presents a similar picture with positive momentum but significant overbought warnings from the Stochastic. Crucially, the daily chart maintains a bearish bias, with the RSI below 50 and negative MACD momentum. The low ADX values across all timeframes reinforce the idea that we are in a range-bound or consolidating market, where a strong directional trade is not yet warranted.
For traders considering a position, the key is to wait for confirmation. A decisive break and hold above the 4-hour resistance at $0.71224, ideally supported by a falling DXY and positive news flow regarding Australian economic data or commodity prices, would be the signal for a potential long entry. The target for such a move could initially be around $0.71338, with a secondary target near $0.71530. Conversely, a break below the 1-hour support at $0.71003, confirmed by a daily RSI decline and negative MACD crossover, would suggest a bearish continuation, with targets at $0.70918 and potentially lower towards $0.70085. The emerging trader interest in 'aud usd 0.7200 target' highlights a potential longer-term upside objective, but reaching that level would require overcoming significant resistance and a sustained shift in global risk sentiment.
Risk management remains paramount in this environment. Given the current choppiness and conflicting signals, it’s advisable to use wider stop-losses or to wait for stronger confirmation before committing capital. The market is currently testing the patience of traders, rewarding those who can wait for high-probability setups rather than chasing every price fluctuation. As we look towards key economic events and central bank decisions, the AUDUSD pair is likely to remain volatile. The 'aud usd 0.7200 target' might be a distant aspiration, but for now, focus on the immediate price action around $0.71125 and the levels that will dictate the next short-to-medium term move.
| Indicator | Value | Signal | Interpretation |
|---|---|---|---|
| RSI (14) | 62.45 | Neutral | Slightly overbought, potential for pullback |
| MACD Histogram | 0.0037 | Bullish | Positive momentum, but needs confirmation |
| Stochastic (%K,%D) | 65.2 / 66.7 | Bearish | Overbought, potential reversal signal |
| ADX | 22.9 | Neutral | Weak trend, market is choppy |
| Bollinger Bands | Middle Band | Bullish | Price above middle band on 1H, but caution needed |
Frequently Asked Questions: AUDUSD Analysis
What happens if AUDUSD breaks above the $0.71224 resistance level?
A sustained break above $0.71224, confirmed by daily momentum, could signal a bullish continuation. This would likely target $0.71338 initially, potentially paving the way for a move towards the $0.7200 area, especially if the DXY weakens. This scenario gains probability if key economic data supports a risk-on environment.
Should I consider a short position at current levels near $0.71125 given the daily bearish trend?
Entering a short position solely based on the daily trend at these levels carries significant risk due to intraday bullish signals and weak ADX. A more prudent approach would be to wait for a confirmed break below the 1-hour support at $0.71003, ideally with bearish confirmation from RSI and MACD on the daily chart, before considering a short trade targeting $0.70918.
Is the Stochastic oscillator showing overbought conditions at 89.63 a sell signal for AUDUSD on the 4-hour chart?
While Stochastic %K at 89.63 and %D at 89.83 are deep in overbought territory and %K < %D suggests a bearish signal, it's not a standalone reason to sell. This reading indicates that the recent upward move is losing steam and a pullback is likely. However, confirmation from price action breaking key support levels or a bearish MACD crossover is needed for a high-probability short trade.
How might the upcoming Fed decision impact AUDUSD trading near $0.71125?
The Fed's decision is critical. If the Fed signals a more hawkish stance or maintains higher-for-longer interest rate expectations, it could strengthen the USD (increase DXY) and pressure AUDUSD below $0.71125. Conversely, a dovish surprise or a pause could weaken the dollar, supporting a potential rally in AUDUSD towards its resistance levels, especially if coupled with positive commodity news.
The AUDUSD pair is currently at a crossroads. The conflicting signals across timeframes and the low ADX readings suggest a period of consolidation or a potential trend change is brewing. While the immediate price action hovers near resistance at $0.71125, the daily chart's bearish undertones cannot be ignored. Patience and strict risk management will be rewarded as the market awaits a clearer directional impetus. Whether it's a breakout above resistance or a breakdown below support, disciplined traders will be ready to act when the probabilities align.
Track markets in real-time
AI-powered analysis, technical indicators and real-time price data.
Join Our Telegram Channel
Breaking market news, AI analysis and trading signals instantly.
Join Channel