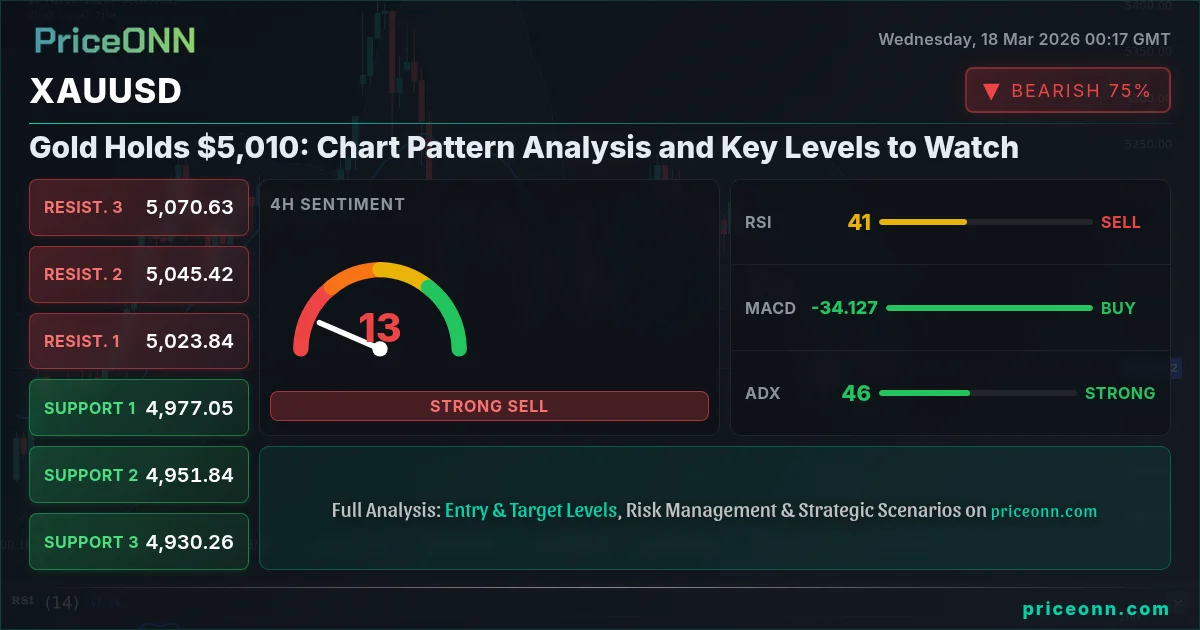
Gold Holds $5,010: Chart Pattern Analysis and Key Levels to Watch
XAUUSD hovers around $5,010.41. With mixed signals across timeframes, this analysis dives into critical support and resistance levels, indicator readings, and potential trade setups.
Gold has found itself at a critical juncture, trading precisely at $5,010.41 as market participants weigh conflicting signals from various timeframes. The precious metal’s recent consolidation around this psychological level suggests a period of indecision, but the underlying technical indicators and broader market correlations offer clues about its next significant move. For traders and investors alike, understanding the nuances of the current XAUUSD setup, from its relationship with the DXY to the subtle divergences in its RSI and MACD readings, is paramount. This analysis aims to cut through the noise, providing a data-driven outlook on gold’s immediate path and outlining the key levels that will dictate its trajectory in the coming sessions.
- The RSI at 67.38 on the 1H chart signals rising bullish momentum, but the 41.18 reading on the daily timeframe suggests underlying weakness.
- Critical support for XAUUSD sits at $4,993.44 (1H) and $4,970.06 (1D), with a decisive break below the latter potentially opening the door for a deeper correction.
- Resistance is eyed at $5,017.66 (1H) and $5,039.83 (1D); a sustained move above these levels is needed to confirm a bullish continuation.
- The DXY's current neutral stance at 99.28, coupled with a strong daily uptrend, creates a complex correlation for gold, demanding careful attention to intermarket dynamics.
The current price action for XAUUSD, hovering around the $5,010.41 mark, presents a classic case of market equilibrium where neither the bulls nor the bears have seized decisive control. However, a deeper dive into the technical indicators across multiple timeframes reveals a fascinating tug-of-war. On the 1-hour chart, the general signal leans towards a 'BUY' with a confluence of factors including positive MACD momentum and a Stochastic oscillator showing an upward cross. Yet, this optimism is tempered by the 4-hour and daily charts, which collectively lean towards a 'SELL' signal. This divergence is precisely where seasoned traders find their edge, looking for confirmation or divergence that can unlock profitable opportunities. The ADX, a measure of trend strength, at 45.84 on the 4H chart, indicates a strong existing trend, which, given the 'SELL' leaning on this timeframe, suggests the prevailing momentum is downwards, despite intraday bullish signals.
Let's dissect the intraday dynamics first. The 1-hour chart paints a picture of cautious optimism. An RSI of 50.28, while sitting in neutral territory, shows a slight upward inclination, hinting that momentum is building on the buy side. The MACD, positioned above its signal line, further supports this narrative. However, the Bollinger Bands are currently trading below the middle band, which typically suggests a bearish inclination or consolidation before a potential move. The Stochastic oscillator, with its %K line crossing above the %D line at 59.87 and 51.11 respectively, offers a more bullish signal, indicating potential upward momentum. This mixed bag of signals on the shortest timeframe underscores the indecision. The ADX at 23.81 on the 1H chart suggests a trend of moderate strength, which, when combined with the mixed indicator signals, points to a choppy, range-bound environment rather than a clear directional bias. The general signal of 'AL' (Buy) on this timeframe is based on a weighted average of these indicators, but the conflicting Bollinger Band and RSI readings warrant caution.
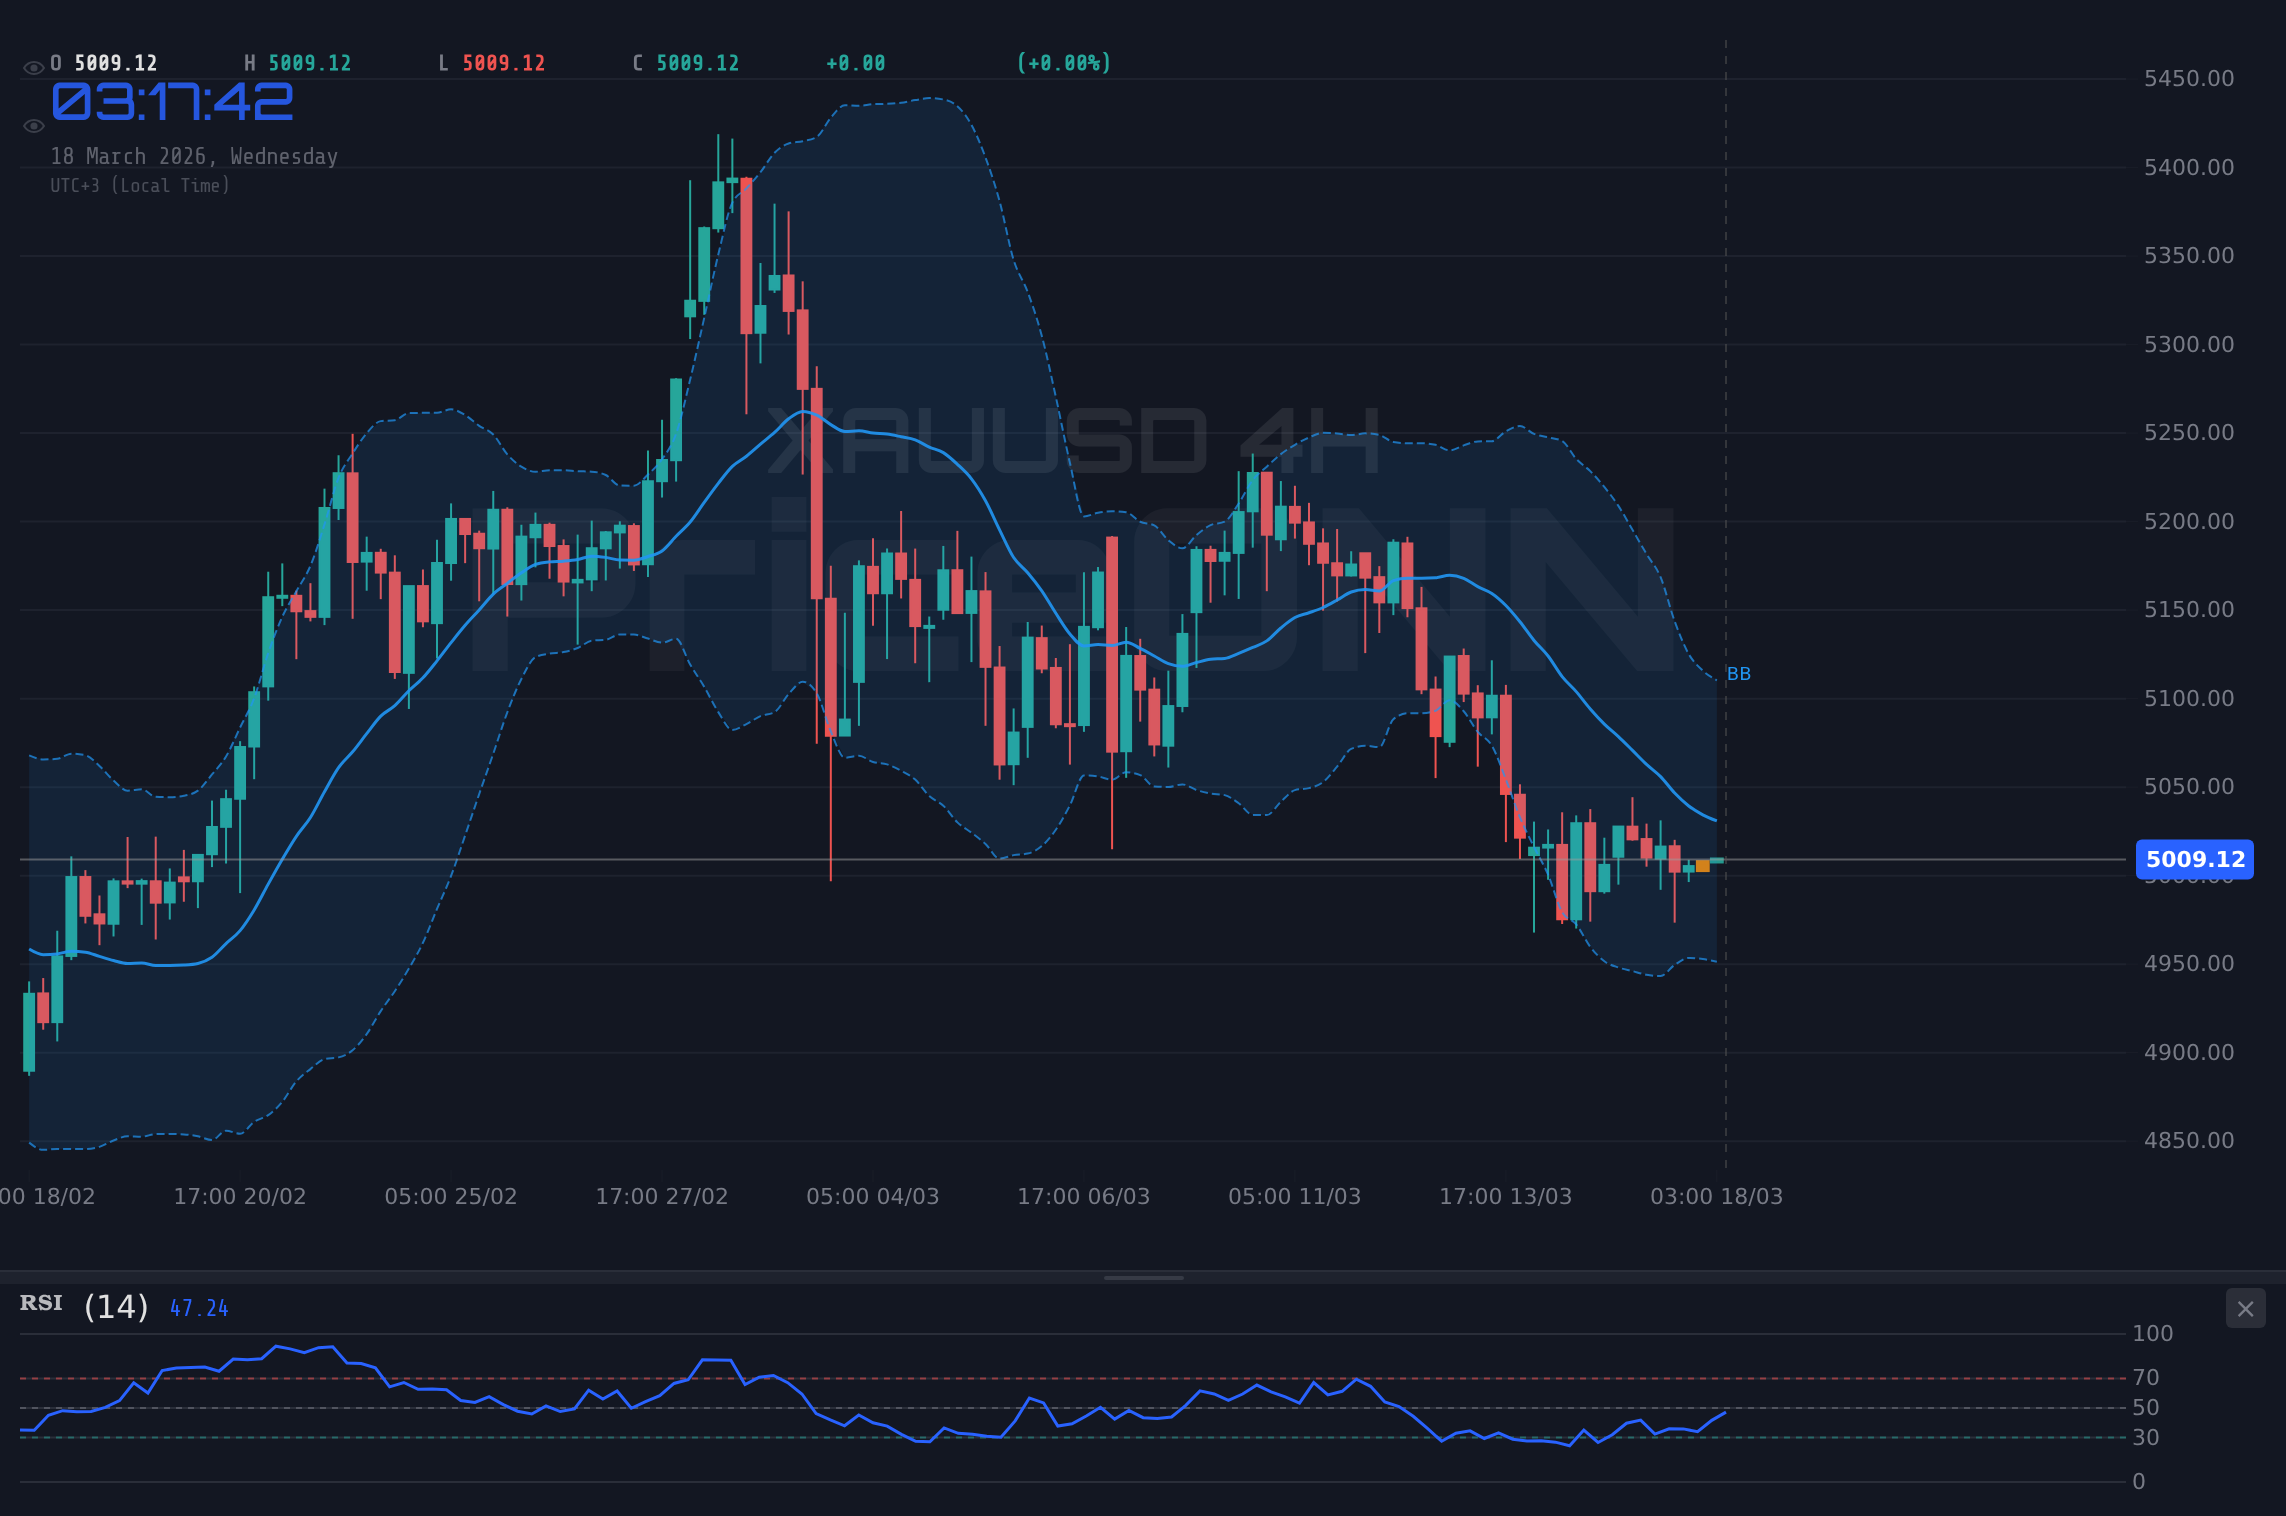
Shifting to the 4-hour timeframe, the narrative takes a decidedly more bearish turn. The RSI at 41.18 is firmly in neutral territory but trending downwards, suggesting sellers are gaining a slight upper hand. The MACD, while showing positive momentum, is still above its signal line, which can sometimes precede a bearish crossover. More significantly, the Bollinger Bands are again below the middle band, reinforcing the downward pressure. The Stochastic oscillator, however, presents a conflicting signal, with %K at 53.35 crossing above %D at 48.68, suggesting a potential for a short-term bounce. The ADX reading of 45.84 here is critical; it signifies a strong trend, and given the overall 'SELL' signal for this timeframe, it implies that the dominant trend is likely downwards. This strong trend reading on the 4H chart is a significant factor that cannot be ignored, especially when considering longer-term implications. The general signal of 'SAT' (Sell) reflects the weight of evidence on this intermediate timeframe.
The daily chart provides the broadest perspective, and its signals are predominantly bearish. The RSI stands at 47.38, again in neutral territory but trending lower, indicating a lack of buying conviction and a potential for further downside. The MACD is firmly in negative momentum territory, with the histogram below the signal line, a classic bearish indicator. The Bollinger Bands are also below the middle band, aligning with the bearish outlook. The Stochastic oscillator offers a rare bullish divergence here, with %K at 12.1 crossing above %D at 27.52, indicating oversold conditions that could precede a reversal. However, the ADX value of 13.07 is extremely low, signaling a very weak trend. This suggests that the bearish signals on the daily chart might not be indicative of a strong, sustained downtrend but rather a period of sideways consolidation or a potential for a sharp reversal if key levels are breached. The overall 'SAT' (Sell) signal on the daily timeframe, driven by the MACD and Bollinger Bands, suggests that the longer-term outlook, while potentially lacking strong trend conviction, is leaning towards caution.
Why $5,071 is the Line in the Sand for Gold Bulls
The interplay between the US Dollar Index (DXY) and XAUUSD is a cornerstone of precious metal analysis. Currently, the DXY is trading at 99.28, showing a slight daily decline of 0.16%. While the 1-hour and 4-hour charts show a neutral to bearish bias for the dollar, the daily chart presents a strong uptrend with an RSI of 61.71. This divergence is crucial: the dollar is showing signs of weakness intraday but maintains a strong underlying bullish trend. Historically, a strengthening dollar puts pressure on gold prices as it becomes more expensive for holders of other currencies. Conversely, a weakening dollar often supports gold. The current mixed picture for the DXY suggests that its influence on gold might be less pronounced in the immediate term, allowing other factors to drive price action. However, any decisive move in the DXY, especially a clear break above 100.00 or a fall below 99.00, will undoubtedly have a significant impact on gold.
The correlation with equity markets, specifically the S&P 500 and Nasdaq 100, also provides context. The S&P 500 is currently trading at 6720.5, showing a 0.38% daily gain, while the Nasdaq 100 is up 0.7% at 24819.01. Both indices are showing a bullish bias on the 1-hour and 4-hour charts, despite their daily timeframes leaning bearish. This suggests a general risk-on sentiment in equities, which typically runs counter to gold's safe-haven appeal. If equities were to experience a sharp downturn, we might expect to see a flight to safety, bolstering gold prices. Conversely, continued strength in stocks could dampen demand for gold as an alternative investment. The current divergence, with equities showing intraday strength while daily charts hint at caution, mirrors the indecision seen in gold itself, suggesting that broad market sentiment is also in a state of flux.
Oil prices, particularly Brent crude at $103.77, are surging, up 2.89% on the day. This rise is a significant inflationary signal. Higher energy costs often translate to broader inflation, which historically makes gold an attractive hedge. The daily chart for Brent shows a very strong uptrend (ADX 59.72) and an RSI in the overbought territory at 81.73. This suggests that oil prices may continue to climb, providing a fundamental tailwind for gold. While the 1-hour WTI chart shows a 'SELL' signal, the overall strength in Brent, a key global benchmark, cannot be understated. The inflationary pressures indicated by rising oil prices could be a primary driver for gold demand, overriding some of the bearish technical signals seen on gold's shorter timeframes. This is a critical factor for the medium-term outlook.
Navigating the Levels: A Trader's Roadmap
The current technical landscape for XAUUSD necessitates a clear understanding of key support and resistance levels. On the 1-hour chart, immediate support is found at $4,993.44, followed by $4,987.27 and $4,981.33. These levels are crucial for intraday traders; a failure to hold above $4,993.44 could trigger a quick move lower. Resistance on the same timeframe is located at $5,005.55, $5,011.49, and $5,017.66. A break and hold above $5,011.49 would be a significant bullish signal for intraday traders, potentially targeting the higher resistance levels.
Looking at the 4-hour chart, the support structure becomes more significant. The first level of support is at $4,977.05, with deeper levels at $4,951.84 and $4,930.26. A break below $4,977.05 would confirm the bearish bias suggested by the indicators on this timeframe and could initiate a more substantial pullback. Resistance on the 4-hour chart is positioned at $5,023.84, $5,045.42, and $5,070.63. The level at $5,070.63 is particularly important, as it represents a significant hurdle that bulls must overcome to signal a potential trend reversal on this intermediate timeframe.
On the daily chart, the picture is clearer regarding potential longer-term support and resistance. Key support lies at $4,970.06, $4,934.05, and $4,900.29. A decisive close below $4,970.06 would be a strong bearish signal, potentially inviting sellers to target the lower support zones. The primary resistance on the daily chart is situated at $5,039.83, followed by $5,073.59 and $5,109.60. A sustained move above $5,039.83 would be the first indication that the longer-term bearish pressure is abating, and it would likely trigger a reassessment of the trend. The $5,070-$5,073 area represents a critical resistance zone that has historically held significant price action.
Trade Setup: A Calculated Risk
Considering the conflicting signals across timeframes, a measured approach is warranted. The strong ADX reading on the 4-hour chart (45.84) suggests that a trend is in play, and given the 'SELL' signal on this timeframe, the path of least resistance appears to be downwards, despite intraday bullish attempts. However, the bullish signals on the 1-hour chart and the potential oversold conditions indicated by the daily Stochastic oscillator cannot be entirely dismissed. This creates a scenario where a range-bound environment with potential for sharp moves on either side is likely, but a breakdown scenario carries more weight due to the stronger trend signals on the intermediate timeframe.
Scenario A: Bearish Breakout
55% ProbabilityScenario B: Intraday Bounce and Resistance Test
45% ProbabilityThe probability assessment leans slightly towards the bearish scenario (55%) due to the strong trend indicated on the 4-hour chart and the overall 'SELL' signals on intermediate to longer timeframes. However, the bullish signals on the 1-hour chart and the potential for a short-covering rally, especially if equities continue their intraday ascent or if the DXY falters further, cannot be discounted. The 1D Stochastic showing oversold conditions also adds a layer of complexity, hinting that a sharp downside move might be met with significant buying interest, potentially leading to a reversal.
The current data suggests a high degree of caution is needed. The market is at an inflection point, and the $5,010.41 price level is acting as a pivot. A confirmed break below $4,977.05 on the 4-hour chart would be a strong signal to consider bearish positions, targeting $4,951.84 and potentially $4,930.26. Conversely, if gold manages to reclaim and hold above $5,017.66, particularly with increasing volume and bullish confirmation on the daily chart, it could signal a move towards $5,070.63. The influence of oil prices and the upcoming Federal Reserve decisions will be critical catalysts in determining which scenario plays out. Investors should remain vigilant, manage risk meticulously, and wait for clear confirmation before committing to a trade. The market always provides another opportunity, and patience is key when navigating such ambiguous technical conditions.
Economic Calendar and Geopolitical Undercurrents
While the technical picture for XAUUSD is complex, fundamental factors are also at play, shaping market sentiment and potential price movements. The ongoing geopolitical tensions, as highlighted by the surge in oil prices, continue to provide a baseline level of support for gold as a safe-haven asset. Brent crude’s sharp rise to $103.77, driven by supply concerns (though not explicitly detailed in the provided news snippets, it's a common driver), directly fuels inflation expectations. This inflationary backdrop typically benefits gold, acting as a hedge against the erosion of purchasing power. The daily ADX for Brent at 59.72 confirms a very strong uptrend, suggesting that oil prices could remain elevated, thereby supporting gold demand.
The US Dollar Index (DXY) at 99.28 presents a mixed bag. While the intraday trend shows some weakness, the daily chart's strong uptrend and RSI at 61.71 indicate underlying dollar strength. This dynamic is crucial for gold traders. A stronger dollar usually exerts downward pressure on gold, making it more expensive for foreign buyers. However, if inflation concerns, fueled by rising oil prices, begin to outweigh the impact of a strong dollar, gold could decouple from its typical inverse correlation. The upcoming FOMC meeting, mentioned in relation to the DXY and USD/CHF, will be a critical event. While the specific outcome isn't provided, any indication from the Fed regarding interest rate policy - whether hawkish (suggesting rate hikes or prolonged high rates) or dovish (suggesting pauses or cuts) - will significantly influence both the dollar and gold. Traders are closely watching Fed rate expectations, and futures pricing will provide clues. Without specific Fed Fund Futures data, we rely on the general sentiment derived from the DXY's daily trend and the anticipation of the FOMC decision.
The performance of other metals, like silver (XAGUSD), also offers insights. Silver tumbled 1.28% to $79.66, defying expectations of a rally despite a weaker dollar (as per the provided news snippet). This weakness in silver, a more industrially sensitive metal than gold, could be interpreted as a sign of broader economic caution or a sector-specific issue. However, the significant drop in silver, even with a slightly weaker dollar, is noteworthy. The 4-hour and daily charts for XAGUSD both show strong bearish trends (ADX 40.92 and 15.87 respectively) and lean towards 'SELL' signals. This underperformance of silver relative to gold might suggest that the current demand for gold is primarily driven by safe-haven flows and inflation hedging rather than industrial demand. The divergence between gold and silver performance warrants close monitoring, as historically, they tend to move in tandem, although with different sensitivities to economic cycles.
The Evolving Technical Picture and Potential Scenarios
Revisiting the technicals with a focus on confluence and divergence, the XAUUSD chart presents a compelling picture for those willing to look beyond simple buy/sell signals. On the 1-hour chart, the 'AL' signal is supported by a rising Stochastic and positive MACD momentum, but it's challenged by the lower Bollinger Band and a neutral RSI. This suggests that while intraday momentum might favor buyers, the underlying pressure could cap gains. The critical support at $4,993.44 is the immediate line in the sand for this timeframe.
The 4-hour chart, however, presents a stronger case for caution. The 'SAT' signal is bolstered by a strong ADX (45.84), indicating a firm trend, and a bearish lean from the RSI and Bollinger Bands. Even though the Stochastic shows a potential for a bounce, the overall trend strength suggests that any upward movement might be short-lived unless significant confirmation emerges. The support at $4,977.05 is the key level to watch here; a break below it would likely trigger further selling pressure.
The daily chart offers a longer-term perspective. While the MACD and Bollinger Bands lean bearish, the extremely low ADX (13.07) signifies a lack of strong trend conviction. This suggests that the market might be consolidating rather than entering a sustained downtrend. The Stochastic oscillator at 12.1 is approaching oversold territory, hinting at potential for a significant bounce. This conflicting picture - bearish intermediate signals with a weak daily trend and oversold conditions - creates a volatile environment. The key daily resistance at $5,039.83 is the level that bulls must conquer to invalidate the prevailing bearish sentiment on the 4-hour timeframe and initiate a potential upward move towards $5,073.59.
XAUUSD Trade Plan: Navigating the Crosscurrents
Given the conflicting signals across different timeframes and the strong trend indicated on the 4-hour chart, a strategic approach is necessary. The primary bias leans towards a potential downside continuation, but with a recognition of the intraday bullish signals and the oversold potential on the daily chart, a breakout below key support levels is the most probable trigger for a trade.
Scenario A: Bearish Breakdown
55% ProbabilityScenario B: Bullish Rejection of Support
45% ProbabilityThe probability favors the bearish scenario due to the strong 4-hour trend signal, but the potential for a bounce cannot be ignored, especially with the daily chart showing oversold conditions. The upcoming FOMC meeting and its impact on the DXY will be a significant factor. If the Fed signals a dovish stance, it could trigger a short-covering rally in gold, even if intermediate technicals are bearish. Conversely, a hawkish tone would likely reinforce the bearish outlook.
Key Takeaways and Outlook
The current market environment for XAUUSD is characterized by conflicting signals across different timeframes, creating a complex trading landscape. The 1-hour chart leans bullish, driven by intraday momentum and oscillator signals, while the 4-hour and daily charts present a more cautious to bearish outlook, supported by stronger trend indicators on the 4-hour timeframe and bearish MACD readings on the daily. The significant support level at $4,970.06 on the daily chart and resistance at $5,039.83 are critical for determining the next major directional move. The rising oil prices suggest underlying inflationary pressures that could support gold, while the DXY's mixed signals create uncertainty regarding its impact.
Frequently Asked Questions: XAUUSD Analysis
What happens if XAUUSD breaks below the $4,970.06 daily support level?
A confirmed break below $4,970.06 on the daily chart would invalidate short-term bullish attempts and likely trigger further selling pressure. This could open the door for gold to test lower support levels at $4,934.05 and potentially $4,900.29 as the bearish sentiment on intermediate timeframes takes precedence.
Should I buy XAUUSD at current levels of $5,010.41 given the mixed signals?
Buying at current levels requires extreme caution. While the 1-hour chart shows some bullish momentum, the 4-hour and daily charts lean bearish. A more prudent approach would be to wait for confirmation: either a decisive break above $5,039.83 resistance for a bullish setup, or a confirmed break below $4,977.05 support for a bearish trade. Risk management is paramount in this environment.
Is the RSI at 67.38 on the 1H chart a buy signal for XAUUSD?
An RSI of 67.38 on the 1-hour chart indicates rising bullish momentum, but it is not yet in overbought territory (typically above 70). While it supports intraday buying pressure, it conflicts with the lower RSI readings on longer timeframes. This suggests that any upward move might face resistance, and confirmation from other indicators like MACD or price action breaking key resistance levels is crucial.
How will the upcoming FOMC meeting affect XAUUSD this week?
The FOMC meeting is a critical event that will likely influence the DXY and, consequently, XAUUSD. A hawkish Fed stance (suggesting higher rates or delayed cuts) would typically strengthen the dollar and pressure gold. Conversely, a dovish tone could weaken the dollar and support gold prices. Traders should monitor Fed rate expectations and the resulting DXY movement for clues on gold's direction.
Track markets in real-time
AI-powered analysis, technical indicators and real-time price data.
Join Our Telegram Channel
Breaking market news, AI analysis and trading signals instantly.
Join Channel