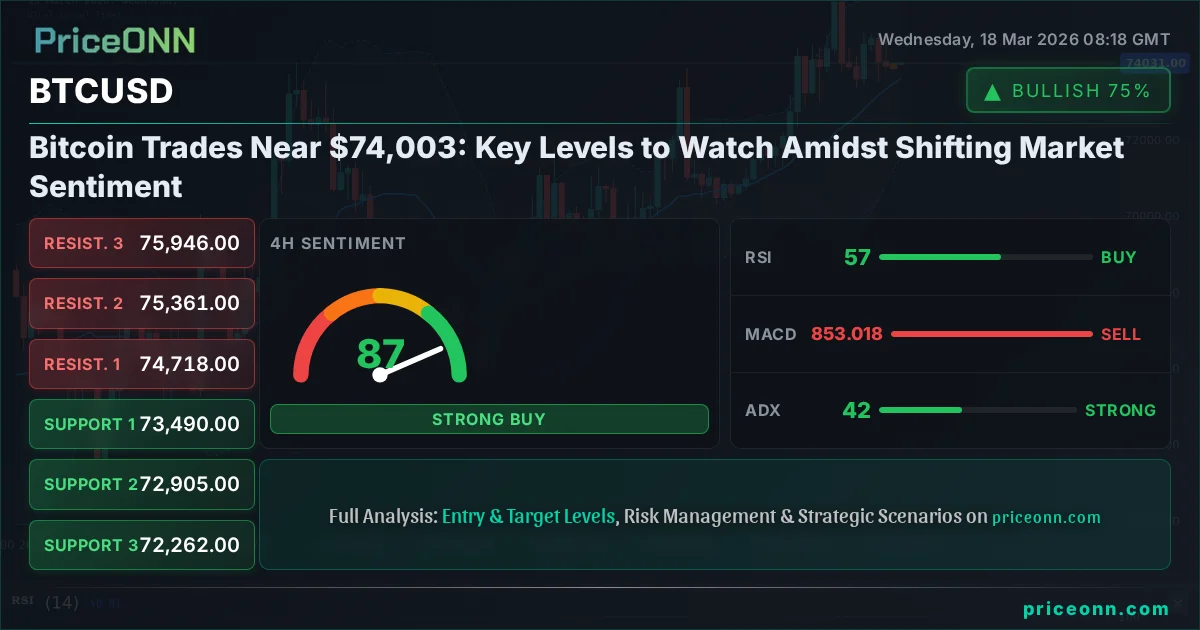
Bitcoin Trades Near $74,003: Key Levels to Watch Amidst Shifting Market Sentiment
BTCUSD hovers around $74,003 as traders assess key technical levels and broader market correlations. Is a breakout imminent?
The cryptocurrency market, led by Bitcoin, is navigating a critical juncture. As BTCUSD hovers near the $74,003 mark, investors and traders are meticulously dissecting technical indicators and macro-economic undercurrents to gauge the next significant move. Recent shifts in global risk appetite, signaled by movements in the US Dollar Index (DXY) and major equity indices like the S&P 500, are casting a shadow of uncertainty, yet the underlying technical picture for Bitcoin suggests a potential for decisive action. This analysis delves into the intricate dance between on-chain data, chart patterns, and the broader financial ecosystem to illuminate the path forward for the flagship digital asset.
- BTCUSD is trading near $74,003, with the 4H chart showing strong upward momentum (ADX 41.79) despite a neutral daily trend.
- Key support for BTCUSD is identified at $73,567.67, while resistance looms at $74,431.67 on the 1H chart.
- The RSI at 47.63 on the 1H chart indicates falling momentum, contrasting with the 4H RSI of 56.96 suggesting a more positive outlook.
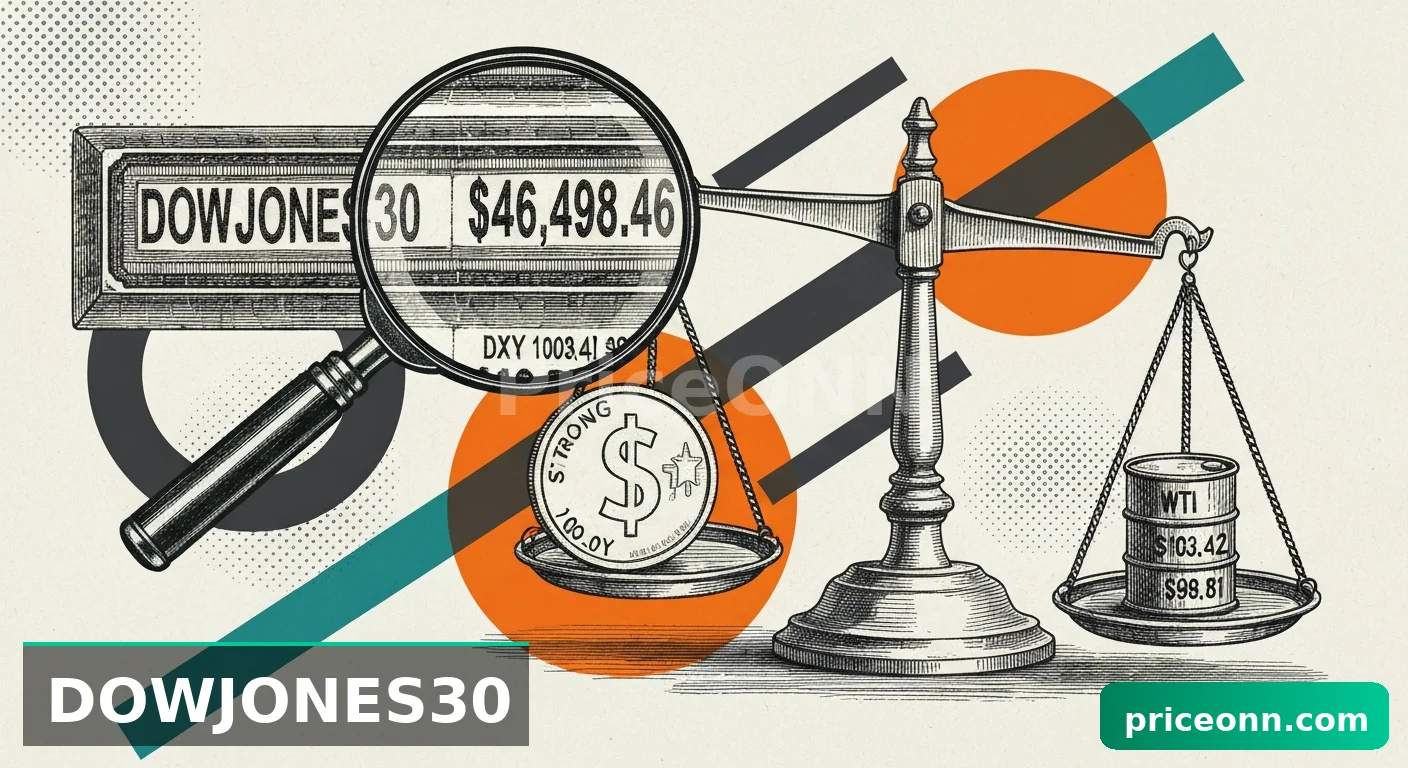
- Correlation with the DXY, currently at 99.37, suggests potential headwinds if the dollar continues its upward trajectory.
Navigating the Bitcoin Landscape: The $74,003 Crossroads
The Macroeconomic Undercurrents Shaping Digital Assets
The global financial stage is currently a complex interplay of monetary policy expectations and geopolitical undercurrents, and Bitcoin, despite its decentralized nature, is by no means immune. The Federal Reserve's stance on interest rates remains a paramount driver, with market participants closely monitoring every utterance and economic release for clues about the future path of monetary policy. While inflation data has shown signs of moderation, the Fed has consistently signaled a data-dependent approach, leaving room for uncertainty. This ambiguity directly impacts risk assets, including cryptocurrencies. When the DXY strengthens, as it is doing today hovering around 99.37, it often correlates with a risk-off sentiment, potentially putting pressure on assets like Bitcoin. Conversely, a weaker dollar and a more dovish Fed outlook can fuel demand for riskier investments, boosting BTCUSD. The current DXY reading, showing a slight uptick on the 1H chart and a neutral stance on the 4H, suggests a mixed signal for the dollar, adding another layer of complexity to Bitcoin’s price action. Traders must remain vigilant, as any significant shift in Fed expectations or dollar strength can have a ripple effect across the crypto market.
The performance of traditional equity markets, particularly the S&P 500 and Nasdaq, also serves as a crucial barometer for risk appetite. Today, the S&P 500 is showing a 0.51% gain, trading near 6752.55, and the Nasdaq is up 0.59% at 24944.75. This suggests a degree of risk-on sentiment in equities, which could theoretically translate into positive sentiment for Bitcoin. However, the relationship isn't always direct. Sometimes, the market can exhibit a decoupling, where equities rally on specific sector news while Bitcoin reacts to its own internal dynamics or broader crypto-specific news. The strength of the upward trend in the S&P 500 on the 1H (100% strength) and Nasdaq on the 1H (100% strength) is notable, indicating underlying bullishness in stocks. This provides a somewhat supportive backdrop for Bitcoin, but it's the BTCUSD $74,003 level and its immediate technicals that will likely dictate short-term price action.
Bitcoin's Technical Picture: A Tale of Divergent Timeframes
Delving into the technicals, Bitcoin presents a fascinating dichotomy across different timeframes. On the 1-hour chart, the trend appears neutral with a strength of 50%, and the RSI at 47.63 suggests a slight bearish lean, indicating falling momentum. The MACD is below its signal line, reinforcing this short-term bearish sentiment. However, the Stochastic Oscillator is showing a potential for a bounce, with the %K line above the %D line, though still in the lower half of its range. The ADX at 13.84 points to a weak trend, suggesting that the current price action might be more consolidative than directional on this very short timeframe. This neutral-to-slightly-bearish short-term view implies that immediate price action could be range-bound or susceptible to quick reversals. Traders operating on this timeframe would be looking for clear breaks of immediate support or resistance to initiate positions.
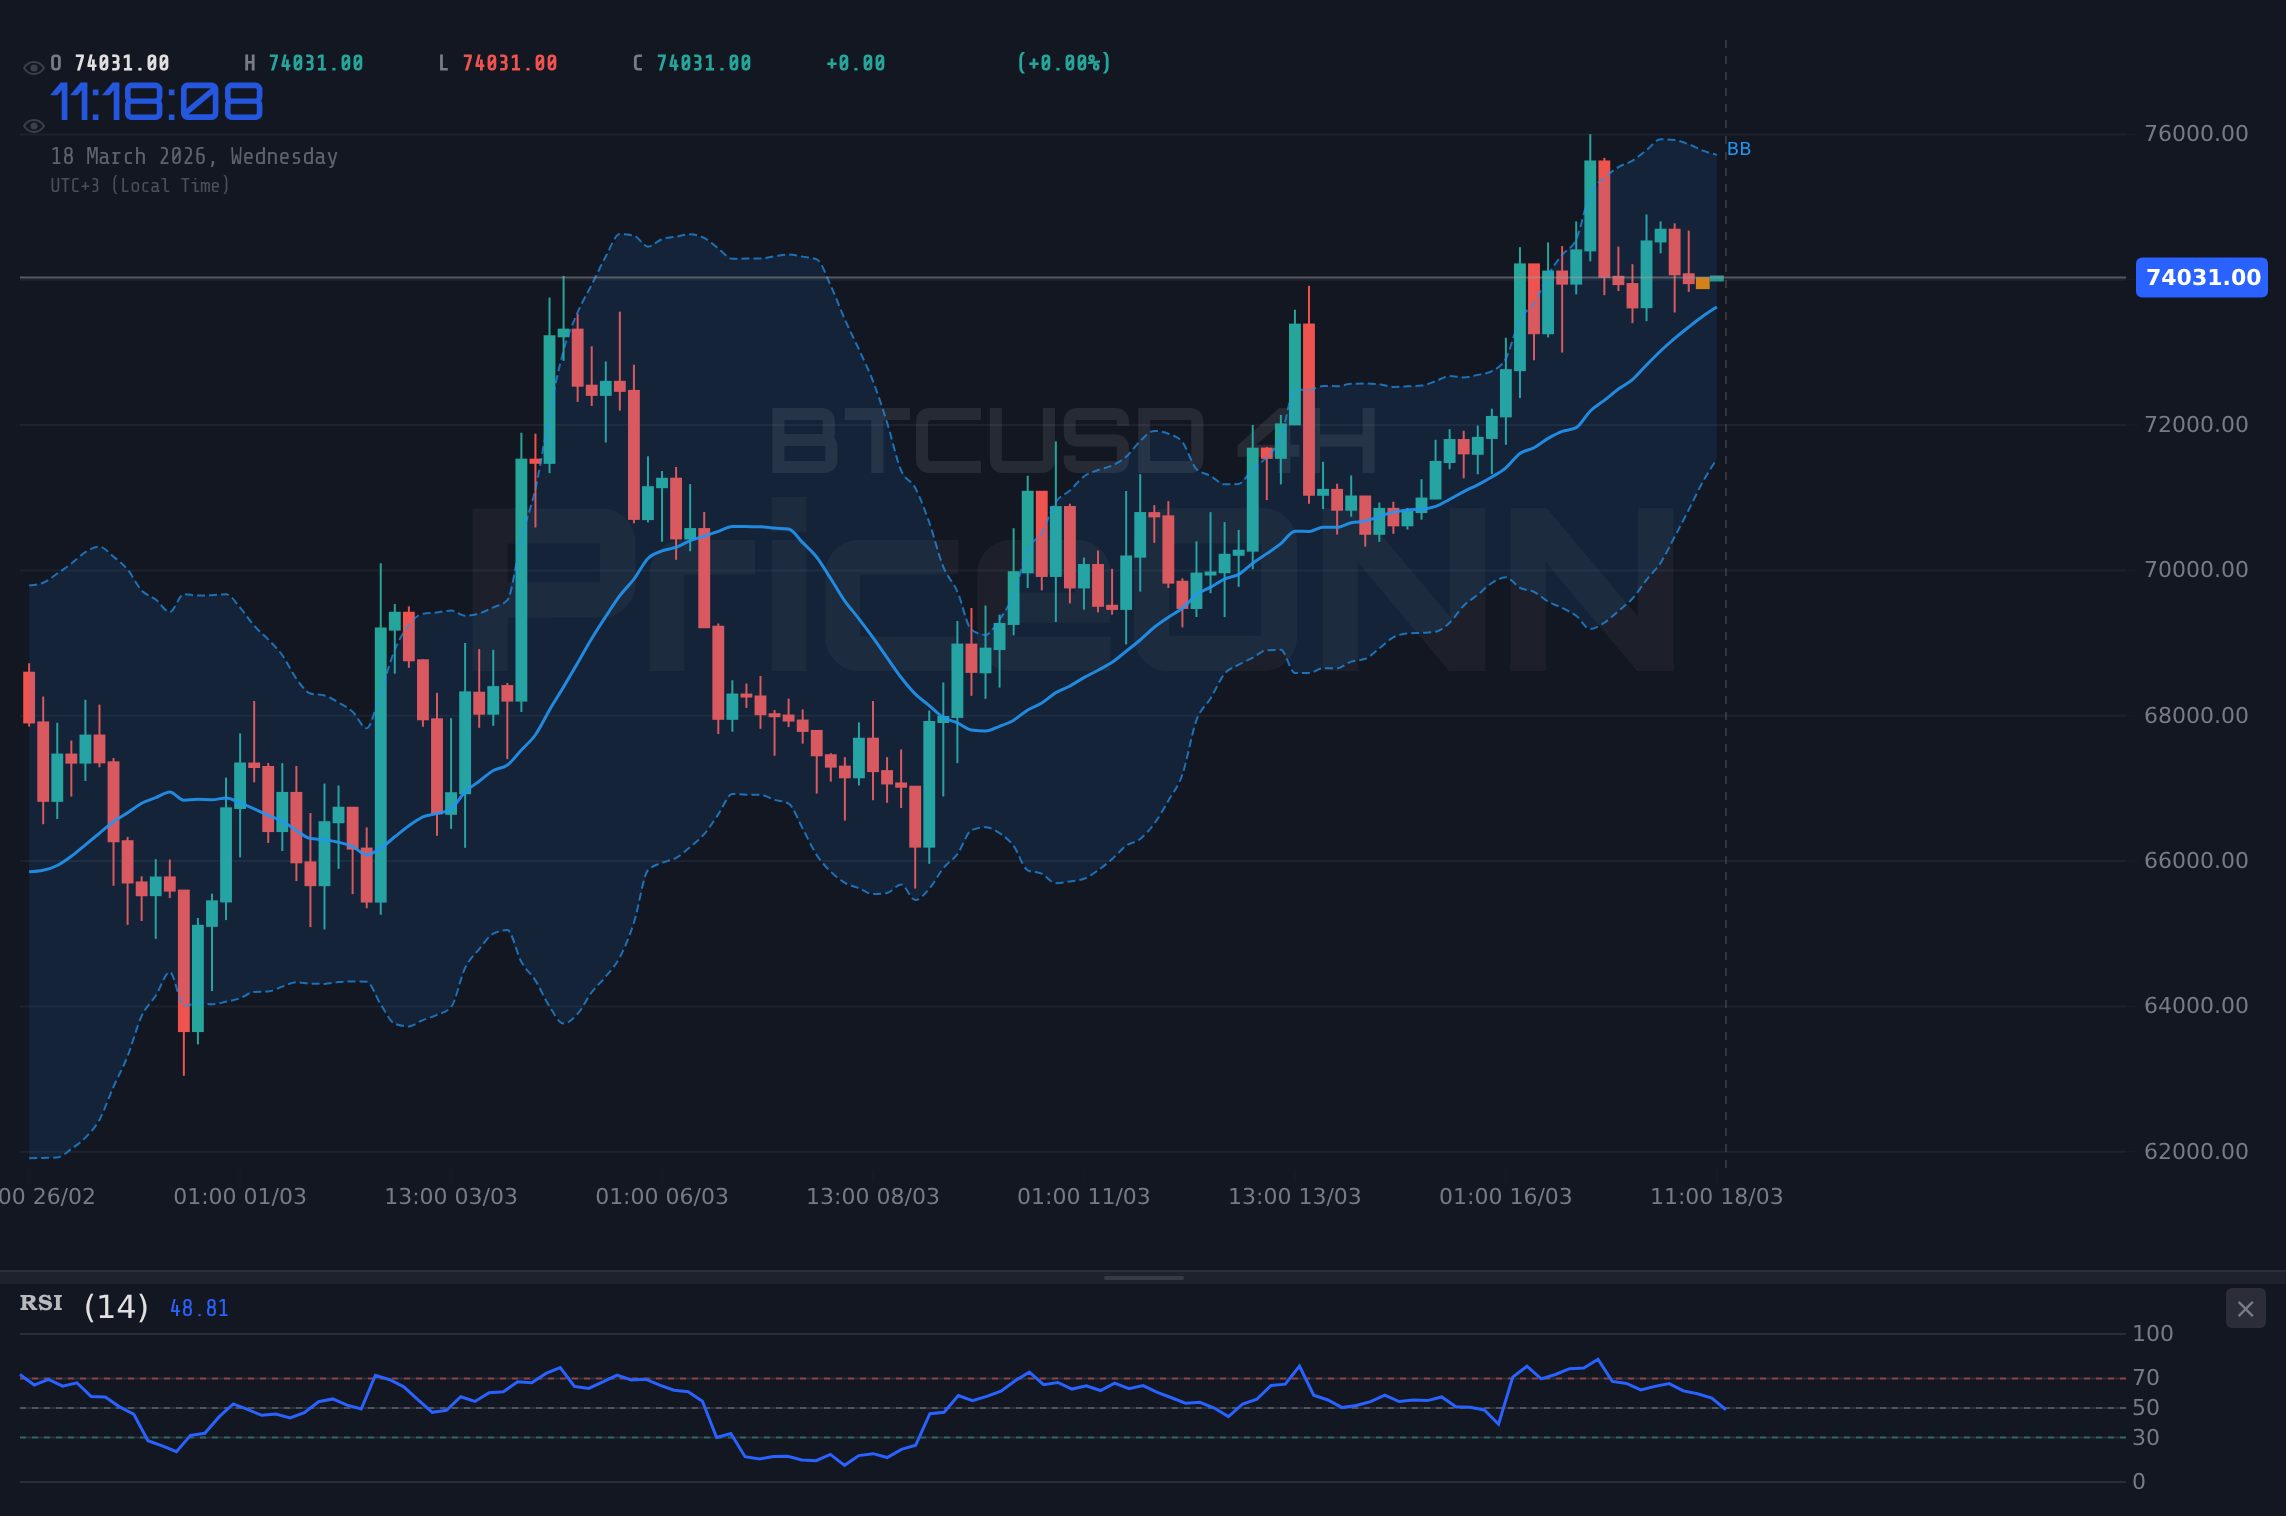
Transitioning to the 4-hour chart, the narrative shifts dramatically. Here, Bitcoin exhibits a strong upward trend with 50% strength, and the RSI at 56.96 is comfortably in neutral territory, leaning positive. The MACD is above its signal line, and crucially, the ADX at 41.79 signals a strong trend, albeit one that might be consolidating rather than accelerating sharply. The Stochastic Oscillator, however, shows a potential dip, with %K below %D, but still in the upper half of its range. This strong trend reading on the 4H chart is significant. It suggests that the underlying sentiment on a medium-term basis is still bullish, even if the very short-term (1H) shows signs of hesitation or consolidation. This divergence between the 1H and 4H charts is precisely where skilled traders find opportunities – identifying whether the short-term weakness is a precursor to a deeper correction or merely a pause before the next leg up.
The daily chart offers a longer-term perspective. Here, Bitcoin's trend is classified as neutral with 50% strength. The RSI at 58.32 is in the upper neutral zone, indicating a positive but not yet overbought condition. The MACD is showing positive momentum, trading above its signal line, which is a bullish sign. The ADX at 27.62 indicates a strong trend, aligning with the 4H timeframe's bullish sentiment. However, the Stochastic Oscillator on the daily chart is showing %K above %D, but it's in the overbought territory (K=85.58, D=73.73). This combination of a strong daily trend and overbought stochastic suggests that while the longer-term picture remains constructive, the market could be due for a pullback or consolidation phase to reset the oscillators before potentially moving higher. This daily perspective is crucial for understanding the broader context in which the shorter-term fluctuations are occurring.
Key Levels and Trade Setups: Charting the Course for BTCUSD
Support and Resistance: Defining the Battlegrounds
Understanding the critical support and resistance levels is paramount for any trader looking to navigate the volatility of Bitcoin. On the 1-hour chart, immediate support is found at $73,855.67, followed by $73,754.33 and $73,567.67. These levels represent areas where buying pressure has historically emerged, potentially halting or reversing downward price movements. Resistance, on the other hand, is stacked at $74,143.67, $74,330.33, and $74,431.67. A decisive break above these resistance points could signal the continuation of an upward trend, while a failure to hold support might lead to a test of lower levels. The current price of $74,003 sits precariously between these immediate 1H levels, highlighting the tight range and potential for sharp moves on a breakout or breakdown.
Looking at the 4-hour timeframe, the support levels are more substantial, starting at $73,490, then $72,905, and further down at $72,262. These represent firmer floors that would require significant selling pressure to breach. Resistance on the 4H chart is located at $74,718, $75,361, and $75,946. These higher resistance points are the next logical targets for bulls if the current upward momentum can be sustained. The fact that the 4H ADX is at 41.79, indicating a strong trend, suggests that once a direction is established, the move could be significant. The daily chart provides even broader perspective, with support at $73,392.33, $72,096.67, and $70,791.33. Resistance on the daily scale is formidable, starting at $75,993.33, then $77,298.67, and reaching towards $78,594.33. These levels are critical for longer-term trend assessment. The current price of $74,003 is nestled between the 1H resistance and the 4H support, creating a zone of immediate interest.
Crafting a Trade Plan: The Path to Profit
Given the strong upward trend indicated by the 4-hour ADX (41.79) and the daily ADX (27.62), coupled with positive MACD signals on these longer timeframes, a bullish bias appears warranted, albeit with caution due to the neutral-to-bearish signals on the 1H chart. A high-probability trade setup would involve waiting for confirmation of strength. The primary trigger for a long position would be a decisive close above the 1-hour resistance at $74,431.67, ideally with increasing volume. This would signal a potential breakout from the current consolidation range and align with the bullish sentiment on the 4H and daily charts. The initial target would be the next significant resistance level on the 4H chart, at $74,718. A secondary target could be set at the daily resistance level of $75,993.33, representing a more ambitious upside potential.
The invalidation level for this bullish trade would be a close below the 4-hour support at $73,490. A break of this level would suggest that the short-term bearish signals are gaining traction and that the underlying trend might be shifting. In this scenario, the alternative setup would be a short trade, targeting the 4H support at $72,905, with a further target at the daily support of $72,096.67. The probability of the bullish scenario playing out, given the conflicting signals between timeframes but the stronger trend on longer charts, is estimated at around 60-65%. The risk management aspect is crucial: a stop-loss for the long trade should be placed just below the invalidation level, perhaps around $73,400, to manage risk effectively. This approach prioritizes capitalizing on the established trend while respecting the potential for short-term pullbacks.
The Role of Indicators: Decoding the Signals
The Relative Strength Index (RSI) provides a nuanced view across timeframes. On the 1H chart, the RSI at 45.14 is in neutral territory but leaning bearish, suggesting some selling pressure is present. However, the 4H RSI at 56.96 is more positive, indicating a healthy momentum that isn't overextended. The daily RSI at 58.32 further supports a constructive outlook, sitting comfortably in neutral territory and far from overbought conditions that might signal exhaustion. This divergence in RSI readings highlights the choppy nature of the current market; the short-term might see dips, but the medium-to-long-term remains positive. This is a classic scenario where traders might look for pullbacks to the $73,500-$73,800 area as buying opportunities, aligning with the more optimistic RSI readings on higher timeframes.
The MACD indicator offers further insight. On the 1H chart, it shows negative momentum, with the MACD line below the signal line. This aligns with the short-term bearish sentiment. However, both the 4H and daily MACD indicators display positive momentum, with the MACD line above the signal line. This is a key confluence point: the longer-term trend indicators are bullish, while the very short-term indicator suggests caution. This scenario often plays out in trending markets where minor consolidations occur before the primary trend resumes. The ADX, as discussed, is a strong indicator of trend strength. The 4H ADX at 41.79 and daily ADX at 27.62 both confirm a strong trend is in play. The 1H ADX at 13.84, however, points to a lack of clear direction on that very short timeframe. This suggests that while a trend exists, the immediate path might be less defined, requiring patience for a clear breakout signal.
Correlations and Wider Market Impact
The Dollar's Shadow: DXY and its Influence
The US Dollar Index (DXY) is a critical component in understanding Bitcoin's price action, especially given the current macroeconomic backdrop. As the DXY hovers around 99.37, its slight upward movement on the 1H chart, coupled with a neutral reading on the 4H, suggests a mixed but potentially strengthening dollar. Historically, a rising DXY often puts downward pressure on risk assets like Bitcoin, as a stronger dollar makes dollar-denominated assets more expensive for holders of other currencies. Conversely, a weakening dollar can fuel demand for cryptocurrencies as investors seek alternative stores of value or higher yields. Today, the DXY's 0.2% daily change is not drastic, but it does indicate underlying strength. If this strength continues, particularly if driven by renewed Fed hawkishness or global uncertainty, it could act as a significant headwind for BTCUSD, potentially pushing it towards the lower support levels. Traders are watching the DXY's ability to hold above its key support levels closely, as a sustained rise could quickly alter the sentiment for Bitcoin.
Equity Markets and Risk Sentiment
The performance of major US equity indices, the S&P 500 and Nasdaq, provides a broader context for risk sentiment. With both indices showing positive daily changes - S&P 500 up 0.51% at 6752.55 and Nasdaq up 0.59% at 24944.75 - there is an apparent appetite for risk in traditional markets. The strong 1H trend strength (100%) in both indices suggests underlying bullish momentum. This generally bodes well for Bitcoin, as it often trades with a higher beta to equity markets, meaning it can amplify upward (or downward) movements. However, it's crucial to monitor for potential divergences. If equities continue to rally while Bitcoin struggles or pulls back, it could signal a weakening correlation or a shift in market focus towards crypto-specific factors. For now, the positive equity market performance offers a supportive, though not decisive, backdrop for Bitcoin bulls. The key will be whether this risk-on sentiment in equities can translate into sustained buying pressure above Bitcoin's immediate resistance levels.
Energy Prices and Inflationary Echoes
The price of oil, both Brent and WTI, remains a significant factor, primarily through its influence on inflation expectations and geopolitical risk. Brent crude is trading down 0.98% at $102.57, while WTI is down 1.75% at $93.92. The daily charts for both show a strong upward trend, indicating that despite today's dip, the longer-term trajectory is bullish. This persistent strength in oil prices, even with today's retracement, carries inflationary implications. Higher energy costs can contribute to broader inflation, which in turn influences central bank policy. If inflation remains stubbornly high, it could delay anticipated interest rate cuts, potentially impacting risk assets like Bitcoin negatively. Geopolitical tensions, often a driver of oil price spikes, also contribute to broader market uncertainty, sometimes leading to a flight to safety, which can indirectly affect Bitcoin depending on whether it's perceived as a risk-on or safe-haven asset in that specific context. The current price action in oil suggests that while there might be short-term profit-taking, the underlying bullish trend persists, keeping inflation concerns on the table.
The Road Ahead: Outlook and Investor Considerations
Interpreting the Signals: A Balanced Perspective
The current technical and macro picture for Bitcoin presents a complex but navigable landscape. The 4H and daily charts strongly suggest an underlying bullish trend, supported by positive MACD momentum and robust ADX readings. However, the short-term 1H chart exhibits weakness, with lower RSI and MACD signals, alongside a neutral trend. This divergence implies that while the longer-term outlook remains constructive, the immediate path could be volatile, with potential for pullbacks towards key support levels like $73,567.67. The Stochastic Oscillator's readings also present a mixed bag, showing potential for bounces on the 1H and 4H charts while nearing overbought territory on the daily. Traders must weigh these conflicting signals carefully. A breakout above the immediate 1H resistance at $74,431.67, confirmed by volume and sustained price action, would likely validate the bullish thesis and open the door for targets at $74,718 and potentially higher.
Conversely, a failure to hold the $73,490 support level on the 4H chart would invalidate the immediate bullish setup and could signal a deeper correction, potentially targeting $72,905 and below. The correlation with the DXY and equity markets adds another layer of complexity. A strengthening dollar or a risk-off turn in equities could exacerbate any downward pressure on BTCUSD. Investors should remain disciplined, adhering to risk management principles and waiting for clear trade setups. The current market environment rewards patience and a data-driven approach, rather than impulsive decisions based on short-term fluctuations. The battle between the bulls and bears at these current levels around $74,003 is a testament to Bitcoin's dynamic nature, offering both challenges and opportunities for astute market participants.
Navigating Volatility: A Trader's Compass
In times of such technical ambiguity and macro uncertainty, the importance of a well-defined trading plan cannot be overstated. For those looking to capitalize on the potential upside, waiting for a confirmed breakout above $74,431.67 is crucial. This entry trigger, combined with a stop-loss below $73,490, provides a defined risk-reward profile. The primary target at $74,718 offers a near-term objective, while the secondary target at $75,993.33 represents the potential for a more significant move if the broader trend reasserts itself strongly. For those anticipating a bearish turn, a break and hold below the $73,490 support level would serve as the trigger, with targets at $72,905 and $72,096.67. It is essential to remember that market conditions can change rapidly, influenced by news events, central bank commentary, or unexpected geopolitical developments. Therefore, continuous monitoring and adaptability are key.
Frequently Asked Questions: BTCUSD Analysis
What happens if BTCUSD breaks above the $74,431.67 resistance level?
A confirmed break above $74,431.67 on increased volume would likely trigger a bullish scenario, aligning with the stronger 4H and daily trends. This could lead to a rapid ascent towards the $74,718 target, and potentially challenge the $75,993.33 resistance level.
Is the current RSI of 47.63 on the 1H chart a sell signal for BTCUSD at $74,003?
While the 1H RSI at 47.63 indicates some waning short-term momentum, it is not yet in oversold territory. Coupled with the more positive RSI readings on the 4H (56.96) and daily (58.32) charts, this suggests short-term weakness might be a consolidation rather than a reversal signal. Patience for further confirmation is advised.
How will the DXY's current level around 99.37 affect BTCUSD trading near $74,003?
The DXY hovering around 99.37 suggests a mixed but potentially strengthening dollar. If the dollar continues to gain, it could exert downward pressure on BTCUSD, potentially pushing it towards the lower support levels around $73,500. Conversely, any dollar weakness could provide a tailwind for Bitcoin.
Should I consider buying BTCUSD if it pulls back to $73,500 levels given the mixed signals?
A pullback to the $73,500-$73,800 area could present a buying opportunity if it holds as support, aligning with the more optimistic RSI and MACD signals on the 4H and daily charts. However, confirmation of support holding, perhaps with a bullish candlestick pattern or a bounce in oscillators, would be prudent before entering a long position.
The path forward for Bitcoin hinges on its ability to overcome immediate resistance levels and maintain bullish momentum across higher timeframes. While short-term fluctuations are to be expected, the underlying trend on the 4-hour and daily charts remains a key focus. For investors, a disciplined approach centered on defined risk levels and clear entry/exit strategies will be paramount. As the market digests incoming economic data and central bank signals, Bitcoin's resilience and correlation dynamics will continue to offer valuable insights. Patience, coupled with a keen eye on the $74,003 price point and its surrounding key levels, will likely be the most rewarding strategy in the current environment.
Track markets in real-time
AI-powered analysis, technical indicators and real-time price data.
Join Our Telegram Channel
Breaking market news, AI analysis and trading signals instantly.
Join Channel