NZDUSD Tests Resistance Near $0.59128: What's Next?
NZDUSD is hovering near $0.59128 resistance. With mixed signals across timeframes, traders await a clear directional cue. This analysis dives into the technicals and potential scenarios.
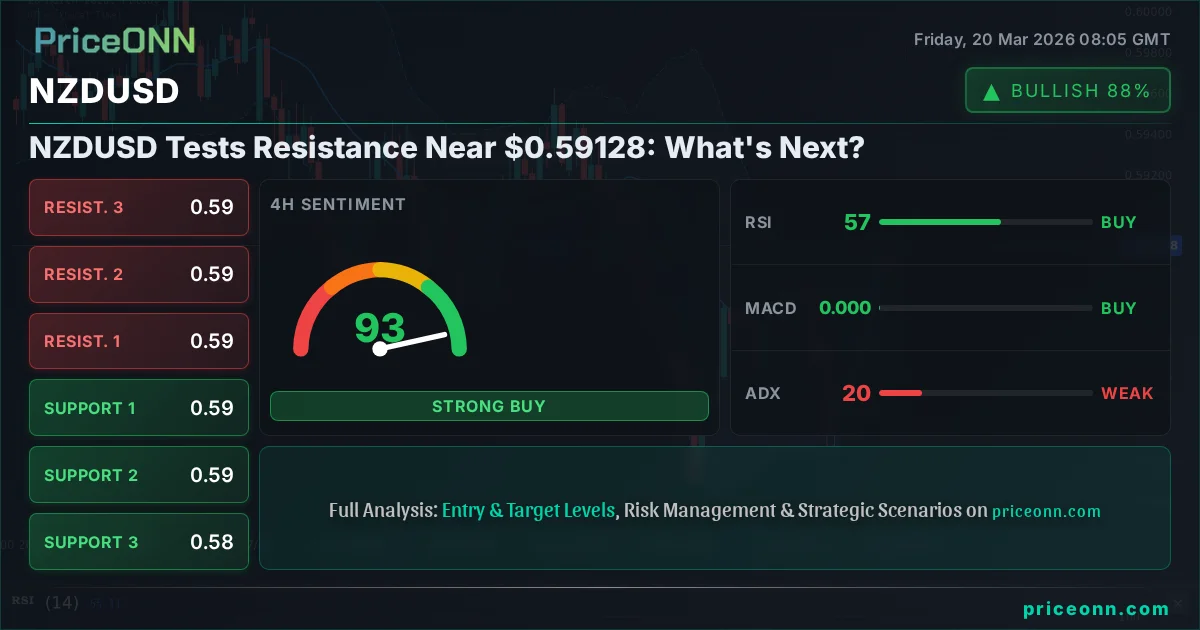
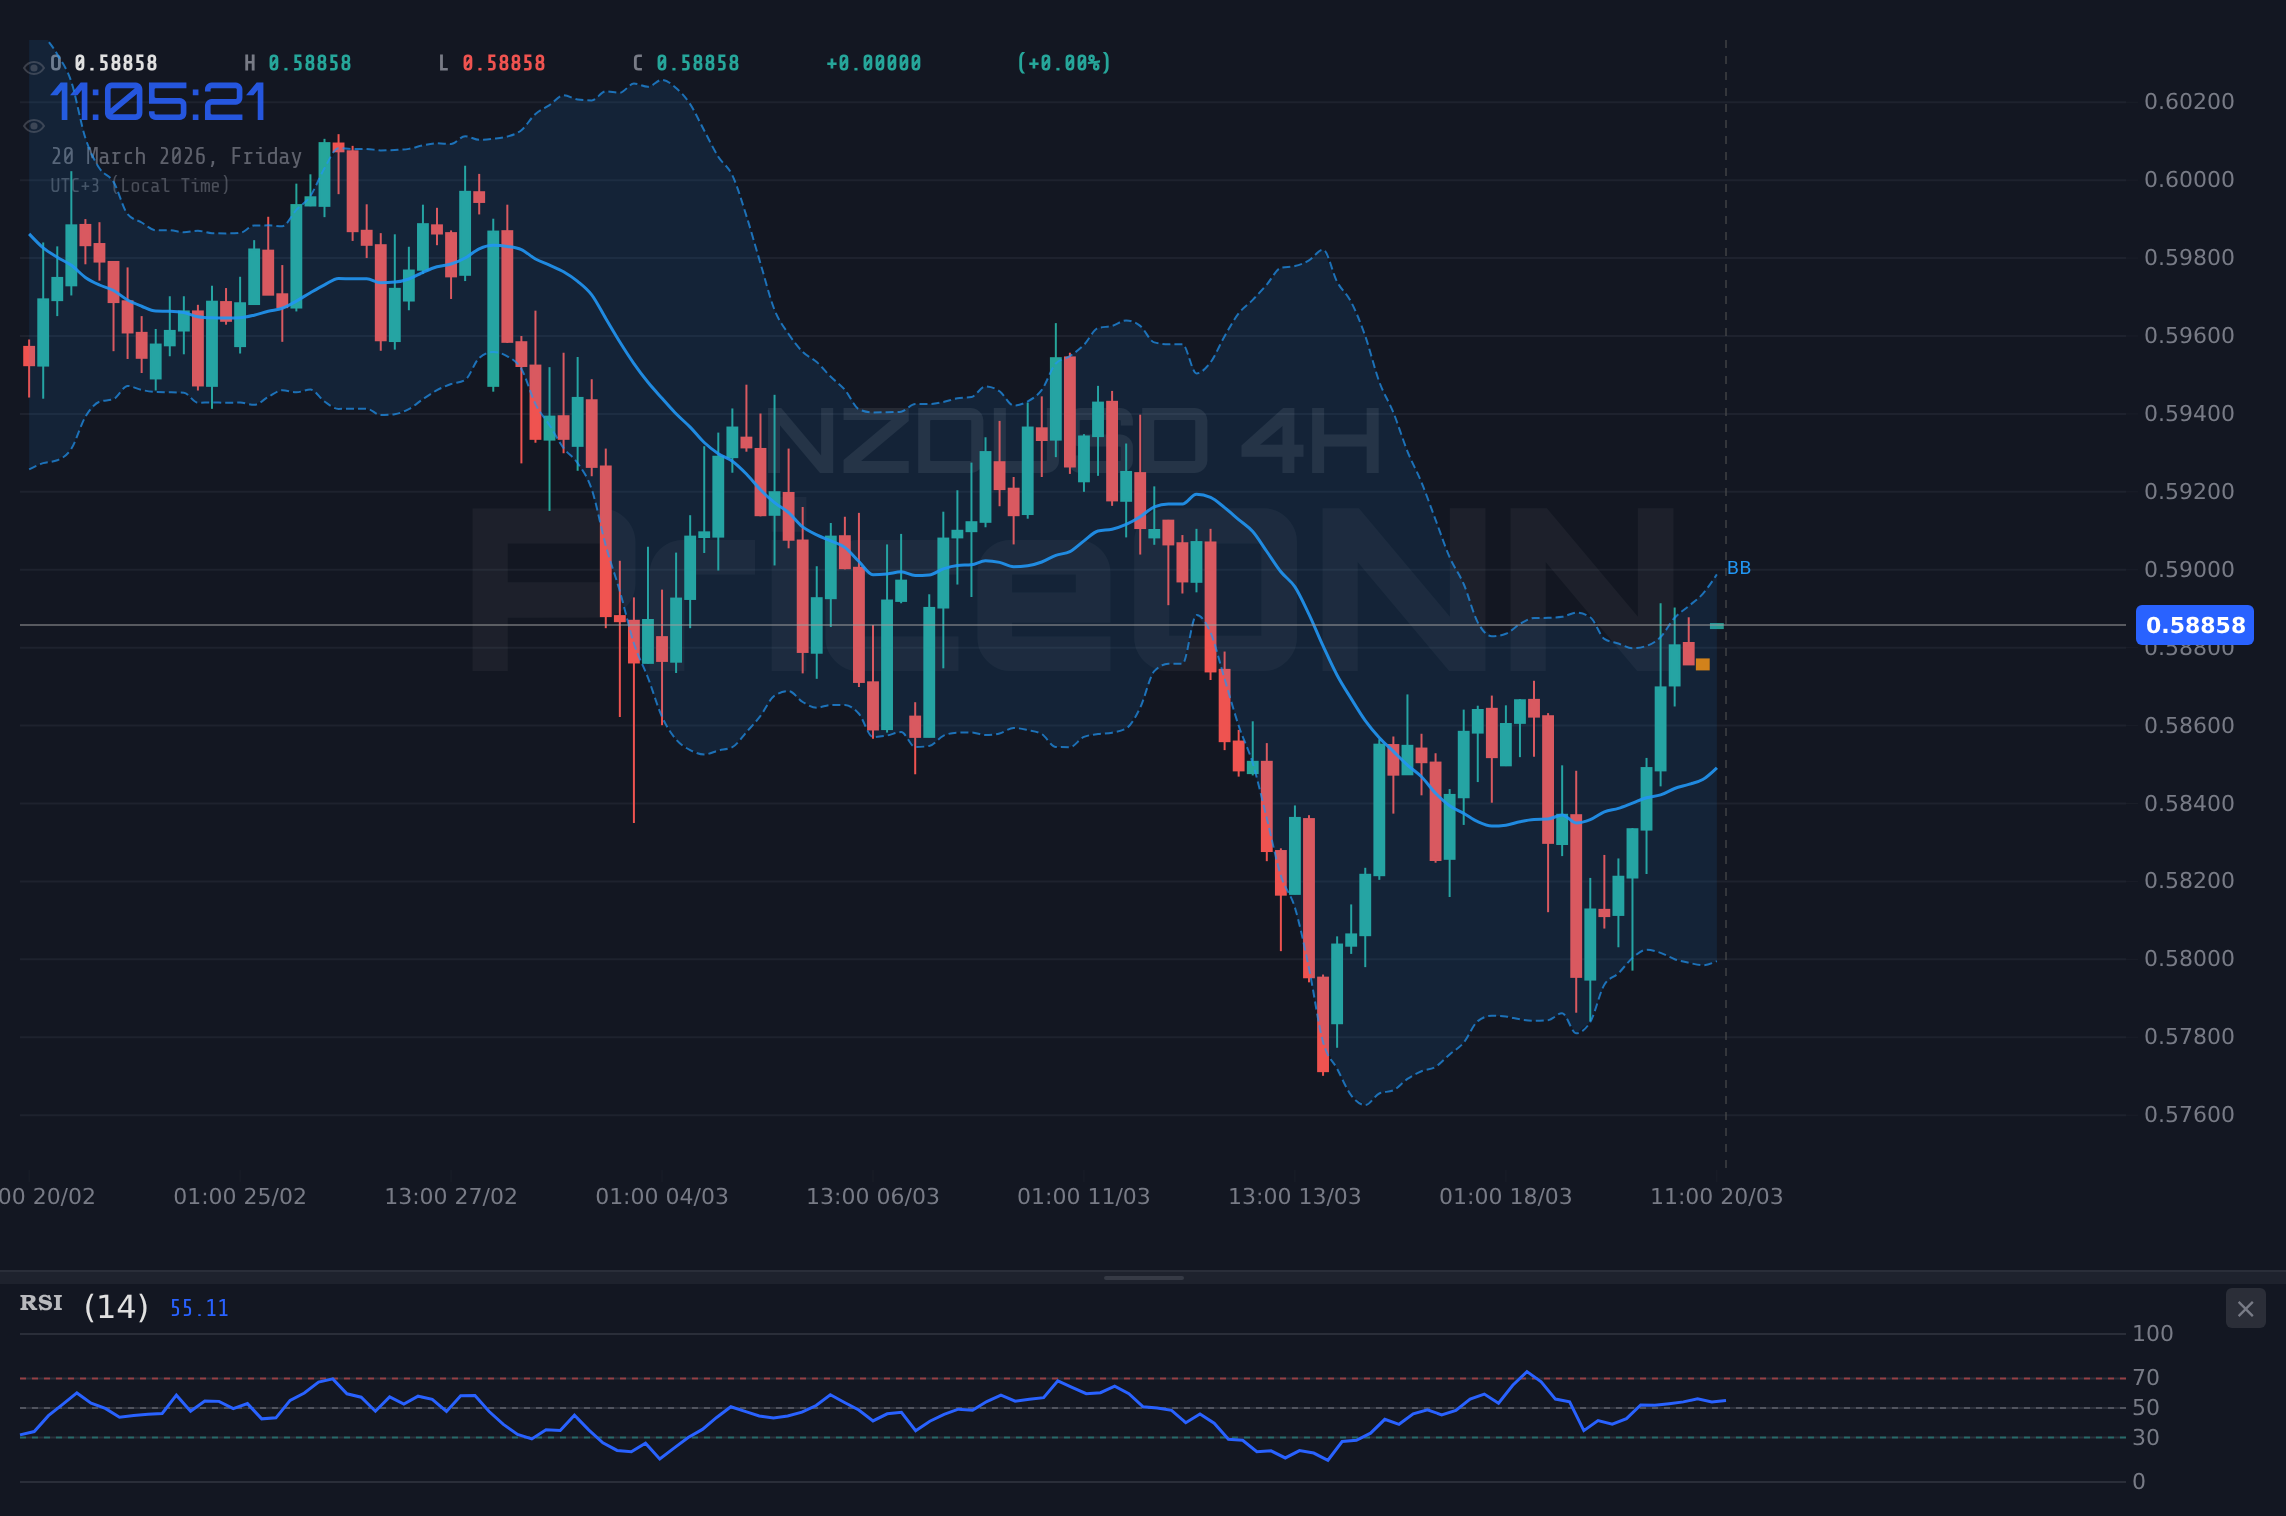
The New Zealand Dollar (NZDUSD) is currently facing a critical juncture, hovering just below the key resistance level of $0.59128. After a recent push higher, the pair now sits at $0.58883, presenting a complex picture for traders caught between conflicting technical signals. Understanding the nuances of its current technical setup is paramount for navigating the potential volatility ahead. This analysis delves into the multi-timeframe technicals, explores the most probable trading scenarios, and identifies the key triggers that could dictate the NZDUSD's next significant move.
- NZDUSD is testing resistance near $0.59128, currently trading at $0.58883.
- The 1-hour chart shows bullish momentum, while the 4-hour and daily charts lean bearish, creating a mixed technical picture.
- ADX readings suggest choppy, range-bound conditions on lower timeframes, but strong trend signals on daily charts warrant caution.
- A daily close above $0.59128 is needed to confirm a bullish continuation, targeting higher resistance levels.
The Bull's Roadmap: Breaking Above $0.59128
For the bulls to regain firm control of the NZDUSD narrative, a decisive break and hold above the $0.59128 resistance level is essential. The 1-hour timeframe offers some solace, with a General Signal of 'BUY' and indicators like RSI at 67.22 suggesting upward momentum is present. The MACD is also showing positive momentum, and Stochastic is in a bullish configuration on this timeframe, albeit with %K below %D, hinting at potential slowing. However, this short-term optimism is tempered by the daily chart's 'SELL' signal, with RSI at 48.21 and MACD exhibiting negative momentum. A sustained move above $0.59128, confirmed by increasing volume and a break of the 4H resistance at $0.59040, would be the first step. If this bullish momentum can carry through, the next significant target would be the $0.59557 level, followed by the more substantial resistance at $0.60201. The ADX on the 1-hour chart at 34.79 indicates a strong trend is present, but this needs to be validated by the longer timeframes to be truly convincing. Without a clear break and follow-through, this bullish scenario remains speculative.
A sustained daily close above the $0.59128 mark would be crucial. This would not only negate the bearish sentiment on the daily chart but also suggest a potential shift in trend. The market would then be looking towards the 4H resistance at $0.5923, followed by the daily resistance at $0.59557. If this bullish breakout gains traction, it could pave the way for a move towards the $0.60201 level, a significant psychological and technical barrier. However, the current divergence between short-term and long-term timeframes means that any bullish move needs to be treated with caution. Traders will be watching for confirmation from other correlated assets, such as the DXY, which is currently showing a mixed signal across timeframes but a strong daily uptrend. A weakening DXY would typically support a move higher in NZDUSD, but the current data presents a complex interplay.
The path for the bulls is not straightforward. While the 1H chart offers some positive signals, the dominant bearish sentiment on the daily timeframe cannot be ignored. For a bullish scenario to materialize, we need to see a clear shift in momentum across all major timeframes. This means the daily RSI needs to climb decisively above 50, and the MACD must generate a bullish crossover. Until then, any upward movement is susceptible to sharp reversals. The key level to watch remains $0.59128; a failure to decisively break this could lead to a sharp pullback, testing the lower support levels mentioned in the bearish outlook.
Where Bears Take Control: The $0.58669 Support Test
On the flip side, the bears have a more compelling case based on the longer-term technical picture. The 4-hour and daily charts both exhibit a predominantly bearish outlook, with the daily chart showing a strong downtrend (90% power) and a 'SELL' signal. The daily RSI at 48.21 is nearing the midpoint, and the MACD is firmly in negative territory, below its signal line, indicating bearish momentum. The Stochastic on the daily chart, with %K at 41.56 and %D at 29.14, shows a potential for upward movement but remains below the overbought territory, suggesting it could be a 'dead cat bounce' before further declines. The ADX on the daily chart at 28.29 confirms a strong downtrend is in play.
The immediate support level to monitor is $0.58669 on the 4-hour chart. A decisive break below this level would confirm the bearish bias and open the door for further downside. The first target in such a scenario would be the 4H support at $0.58532, followed by the daily support at $0.58055. A more aggressive move could see prices testing the $0.57411 level. On the 1-hour timeframe, the General Signal is 'BUY', but this is overshadowed by the longer-term bearish trend. If the bearish momentum from the daily chart takes hold, the 1H 'BUY' signal will likely be invalidated, leading to a cascade of selling pressure. The key factor here is the failure to break above the $0.59128 resistance. If price fails to sustain its current levels and begins to roll over, the $0.58669 support becomes the immediate focus.
The prevailing risk-off sentiment, potentially fueled by global economic uncertainties or a strengthening US Dollar (DXY), could further exacerbate any downturn in NZDUSD. The DXY's daily trend is strongly bullish at 99.09, which typically exerts downward pressure on risk-sensitive currencies like the NZD. If the DXY continues its ascent, it would provide a strong tailwind for the bearish scenario. The current price of $0.58883 sits precariously between the 1H resistance at $0.58792 and the 4H support at $0.58669. A breakdown below $0.58669 would likely trigger stop-loss orders, accelerating the move towards the lower targets.
The Waiting Game: Navigating the Choppy Waters of $0.58883
Given the conflicting signals across different timeframes, a period of consolidation or range-bound trading around the current price of $0.58883 is a highly plausible scenario. The ADX indicator provides crucial insight here. On the 1-hour chart, ADX is 34.79, suggesting a strong trend, but on the 4-hour chart, it drops to 19.97, indicating a weak trend and potential for sideways movement. The daily ADX at 28.29 also points to a reasonably strong trend, but the divergence in lower timeframes suggests indecision in the market. This conflict often leads to price action chopping between support and resistance levels without a clear directional commitment.
In a neutral scenario, NZDUSD would likely remain confined within the bounds set by the immediate 1H resistance at $0.58792 and the 4H support at $0.58669. Price might oscillate within this tight range, with brief spikes testing higher levels or dipping lower, only to be pulled back into the established band. This kind of chop can be frustrating for traders looking for clear trends, often leading to whipsaws if stop-losses are too tight. The Stochastic indicator on the 1-hour chart showing %K < %D and the daily chart showing %K > %D further exemplifies this indecision. The market is essentially waiting for a catalyst – either a strong economic data release, a significant geopolitical event, or a clear shift in central bank sentiment – to break this stalemate.
During this consolidation phase, volume might remain relatively low, and volatility could decrease. Traders might choose to step aside, waiting for a more defined setup. However, those looking to trade within the range could target the edges: buying near the lower bound of $0.58669 and selling near the upper bound of $0.58792, always with tight stop-losses to protect against a breakout. The key is that neither the bulls nor the bears can establish firm dominance. This 'waiting game' could persist until a more significant market driver emerges, forcing a decisive move out of the current range. The lack of strong conviction across all timeframes supports this neutral outlook as a strong possibility.
The Most Likely Scenario: A Bearish Lean Amidst Daily Downtrend
While the 1-hour chart presents a tempting bullish picture, the dominant bearish signals on the 4-hour and daily timeframes give the bearish scenario a higher probability. The daily chart's ADX of 28.29 and the 'SELL' signal, coupled with the RSI below 50 and negative MACD momentum, strongly suggest that the prevailing trend is downwards. The current price of $0.58883 is trapped between short-term bullish indicators and long-term bearish ones, a classic setup for a potential continuation of the downtrend after a brief corrective rally.
The probability assigned to the bearish scenario is 65%. This is primarily driven by the stronger bearish conviction on the daily chart and the persistent strength of the US Dollar Index (DXY), which shows a bullish daily trend. A failure to decisively break the $0.59128 resistance, especially with the DXY at 99.09, increases the likelihood of a pullback. The market sentiment appears to be leaning towards caution, especially with the conflicting economic signals globally. The critical support at $0.58669 on the 4-hour chart is the key level to watch. A break below this would likely confirm the bearish bias and open the path towards the $0.58055 and $0.57411 targets.
The bullish scenario, while possible, carries a lower probability of 25% due to the lack of confirmation across longer timeframes. It hinges on a decisive breakout above $0.59128, which has yet to materialize convincingly. The neutral scenario, with a 10% probability, reflects the current indecision but is less likely to persist if the dominant daily trend asserts itself. Therefore, the primary focus remains on the downside, with any upward movements potentially serving as selling opportunities unless key resistance levels are convincingly breached.
The conflicting signals between short-term (1H) and long-term (4H, 1D) timeframes pose a significant risk. A premature move based on 1H signals could lead to being caught on the wrong side if the daily trend reasserts itself. Always wait for confirmation across multiple timeframes and manage risk tightly.
Trading Scenarios: Mapping the Path Forward
The Bear's Descent: Below $0.58669
65% ProbabilityThe Bull's Ascent: Above $0.59128
25% ProbabilityConsolidation Zone: Stuck Between Levels
10% ProbabilityWhat I'm Watching This Week
The key to navigating NZDUSD in the coming days lies in observing specific price action and confirmations. Firstly, the daily close relative to the $0.59128 resistance is paramount. A failure to break this level, especially accompanied by rising DXY, would strongly favor the bearish scenario. Secondly, the $0.58669 support level on the 4-hour chart is critical. A decisive breach here would likely trigger further downside, validating the bearish outlook. Finally, I'll be monitoring the correlation with the DXY. If the dollar index continues its strong daily uptrend, it will add significant weight to potential NZDUSD weakness.
The technical indicators present a divided picture, but the weight of evidence, particularly from the daily chart, leans towards a bearish bias. The current price of $0.58883 sits at a critical crossroads. Traders should exercise caution and await clear signals. A confirmed break above $0.59128 would shift the bias, but until then, the risk of a downturn towards $0.58055 remains elevated. Patience and risk management will be key in navigating this choppy market condition.
Frequently Asked Questions: NZDUSD Analysis
What happens if NZDUSD breaks decisively above the $0.59128 resistance level?
A sustained daily close above $0.59128, confirmed by strong volume, would invalidate the immediate bearish outlook. This would likely trigger a move towards the next resistance levels at $0.59557 and potentially $0.60201, indicating a shift in market sentiment.
Should I consider buying NZDUSD at current levels near $0.58883 given the 1H bullish signals?
Buying at current levels is risky due to conflicting signals. While the 1H chart shows bullish momentum (RSI 67.22), the daily chart remains bearish. A more prudent approach would be to wait for a confirmed break above $0.59128 or a clear test and hold of support near $0.58669, with tight risk management.
Is the RSI at 48.21 on the daily chart a strong sell signal for NZDUSD?
An RSI below 50 on the daily chart indicates bearish momentum but isn't an outright sell signal on its own. It suggests that sellers have more control than buyers. This reading, combined with negative MACD momentum, reinforces the bearish bias, especially if price fails to break higher resistance.
How will the DXY's bullish trend impact NZDUSD this week?
The DXY's strong daily uptrend (currently at 99.09) typically exerts downward pressure on risk-sensitive currencies like the NZD. If the DXY continues to strengthen, it increases the probability of NZDUSD falling towards its support levels, making the bearish scenario more likely.
Track markets in real-time
AI-powered analysis, technical indicators and real-time price data.
Join Our Telegram Channel
Breaking market news, AI analysis and trading signals instantly.
Join Channel