XAGUSD: Volatile Run Tests $72.6 Support as Selloff Continues
Silver's volatile run sees prices testing critical support at $72.6. The selloff continues amid strong DXY and Fed hawkishness. See analysis and scenarios.
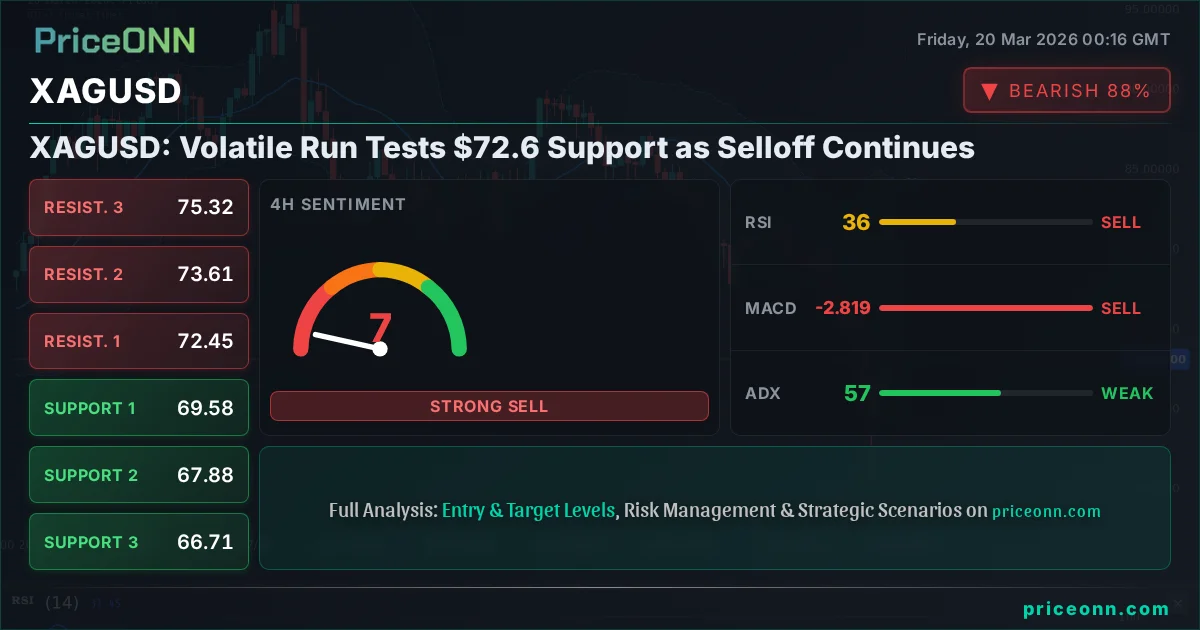
The relentless volatility in precious metals continues to capture market attention, and silver, or XAGUSD, is currently at the epicenter of this storm. Trading at $73.20, the white metal is navigating a challenging period, with its recent bearish run testing key support levels. The dramatic price action underscores the intricate dance between macroeconomic forces, geopolitical tensions, and investor sentiment. As traders scrutinize every tick, understanding the underlying drivers and potential future paths becomes paramount. This analysis dives deep into the technical landscape of XAGUSD, dissecting indicator readings, support and resistance zones, and the crucial interplay with broader market indices to paint a comprehensive picture of where silver might be headed next.
- RSI at 40.31 on the 1H chart signals waning momentum, suggesting potential consolidation or a brief pause in the downtrend.
- Critical support sits at $72.60, a level that has seen significant price action and will be key to watch for any potential reversal or further downside.
- The ADX at 56.51 on the 4H chart indicates a very strong downtrend, suggesting that any counter-trend moves may be short-lived.
- Correlation with DXY at 99.09 shows the dollar's recent weakness is not yet providing a strong tailwind for silver, highlighting underlying bearish pressure.
The Bear's Grip Tightens: Analyzing the XAGUSD Selloff
A Deep Dive into the 1-Hour Technicals
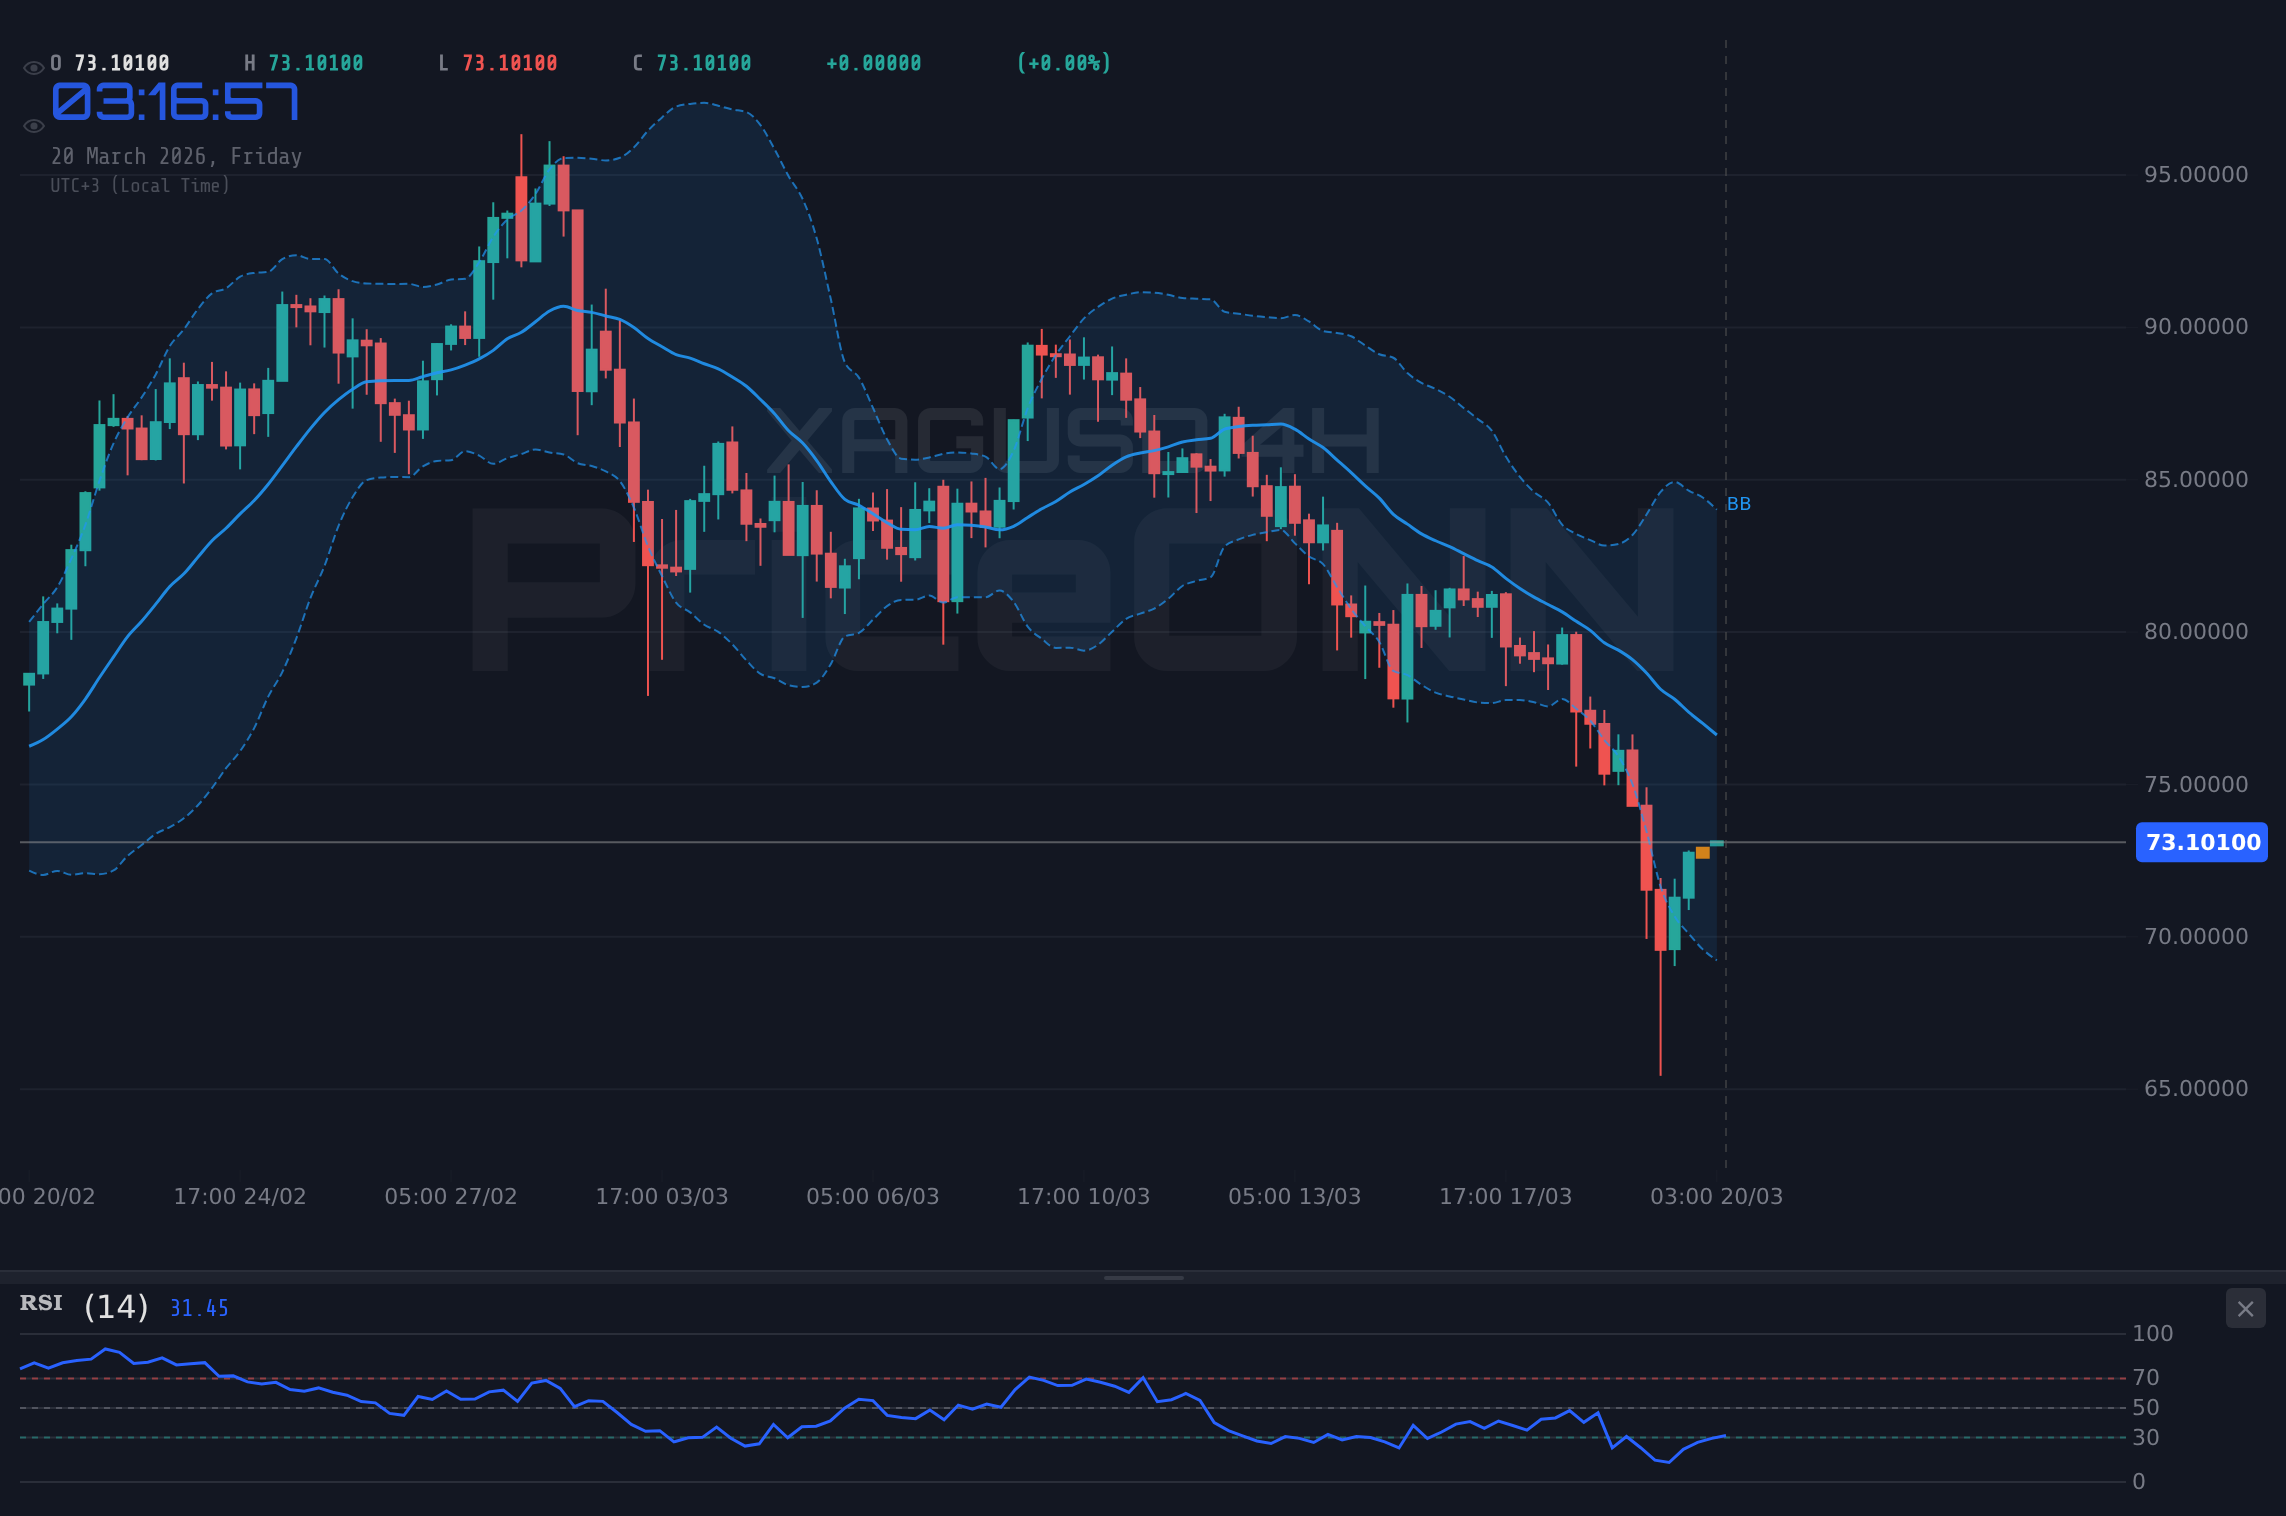
On the 1-hour timeframe, XAGUSD presents a mixed, albeit predominantly bearish, picture. The current price of $73.20 is hovering near the lower end of its daily range, which has spanned from $65.44 to $76.65. The trend is officially neutral, with a strength of 50%, indicating indecision in the very short term. However, this neutrality is overshadowed by a falling RSI(14) at 40.31, which, while not yet oversold, suggests that downward momentum is present and bulls are struggling to gain traction. MACD shows positive momentum, which seems contradictory, but it's crucial to note that this can occur during pullbacks within a larger downtrend. The Bollinger Bands are printing below the middle band, reinforcing the bearish inclination. Stochastic, on the other hand, is showing a bullish signal with K at 85.08 and D at 64.04, indicating a potential short-term bounce is brewing, perhaps a relief rally before the next leg down. However, the ADX at a towering 58.21 paints a stark reality: the downtrend is incredibly strong. This high ADX value suggests that any upward movements might be temporary, quickly getting absorbed by stronger selling pressure. The overall signal leans towards 'SELL', with 5 'Sell' signals against 3 'Buy' signals, reflecting this prevailing bearish sentiment.
The 4-Hour Chart: Confirming the Downtrend
Shifting to the 4-hour chart, the narrative becomes clearer and more decisively bearish. Here, the trend is unequivocally classified as 'Downtrend' with a strength of 100%. This timeframe is crucial for identifying intermediate-term movements. The price is currently battling around the $73.20 mark, with immediate support identified at $71.74, followed by $71.32 and $70.48. Resistance levels loom at $73.84, $74.26, and $75.32. The RSI(14) here is a significant indicator, sitting at a low 24.51. This reading places XAGUSD deep into oversold territory, historically a zone where significant price reversals can occur. This is the primary signal for potential buyers looking for an entry. However, one must be cautious; oversold conditions can persist, especially in strong downtrends. The MACD is firmly in negative momentum, with the histogram below the signal line, confirming the bearish conviction. Bollinger Bands are also hugging the lower band, indicating significant selling pressure. Stochastic is showing a potential bullish reversal signal, with K (40.37) crossing above D (19.69), echoing the 1-hour chart's observation of a possible short-term bounce. Yet, the ADX at an even higher 62.5 is the dominant factor, confirming an extremely strong downtrend. The overwhelming 'SELL' signal (6 Sell, 2 Buy) from this timeframe underscores the dominant bearish force at play, suggesting that despite oversold indicators, the path of least resistance remains downwards for now.
The Daily Perspective: A Wider Lens on Bearish Pressure
Zooming out to the daily chart offers a broader context, revealing that the current downtrend, while strong on shorter timeframes, is part of a larger, more complex picture. The daily trend is currently neutral, with strength at 50%, suggesting a potential pause or consolidation after a significant move. The price of $73.20 is well below the daily resistance levels of $78.68, $82.00, and $83.86, but also above the key daily support at $73.50, $71.65 and $68.32. The RSI(14) at 38.04 is in the neutral zone, leaning towards the lower end, indicating room for further downside before reaching extreme oversold conditions. MACD continues to show negative momentum, consistent with the downtrend observed on the 4-hour chart. Bollinger Bands are trading below the middle band, indicating bearish pressure, and are also showing signs of widening, which can precede sharp moves. Stochastic is deep in oversold territory, with K at 12.77 and D at 17.77, flashing a strong buy signal for contrarian traders. However, the ADX at a relatively low 17.05 suggests that the trend strength on the daily is weakening, pointing towards a potential period of consolidation or a less directional market. The overall signal here is still 'SELL' (6 Sell, 2 Buy), but the weakening ADX hints that the conviction behind the downtrend might be diminishing on this longer timeframe, opening the door for range-bound trading or a potential bottoming process.
Correlation Analysis: DXY, Equities, and the Price of Silver
The Dollar's Shadow: DXY's Influence on XAGUSD
The relationship between the US Dollar Index (DXY) and silver prices is often inversely correlated, though not always perfectly. When the dollar strengthens, typically due to rising US interest rate expectations or safe-haven demand, commodities like silver tend to face pressure as they become more expensive for holders of other currencies. Conversely, a weaker dollar often provides a tailwind for precious metals. Currently, the DXY is trading around 99.09, showing a daily decline of -0.84%. This weakness in the dollar, paradoxically, has not translated into a significant rally for XAGUSD. The 1-hour chart shows the DXY's RSI at 36.53, indicating bearish momentum, and ADX at 33.42 confirms a strong downtrend in the dollar. This suggests that while the dollar is weakening, other factors are exerting stronger downward pressure on silver. The fact that silver is falling despite a weaker dollar highlights the intensity of the bearish sentiment specifically within the silver market, possibly driven by factors beyond currency fluctuations, such as technical breakdowns or shifts in physical demand.
Risk Appetite: SP500 and Nasdaq's Role
The performance of major stock indices like the S&P 500 (SP500) and Nasdaq 100 (Nasdaq) serves as a barometer for overall market risk appetite. Typically, a decline in these indices signals a 'risk-off' environment, where investors flee riskier assets like stocks and move towards perceived safe havens such as gold, US Treasuries, or sometimes the dollar. Currently, the SP500 is trading at 6626.05, up 0.24% for the day, while the Nasdaq is at 24417.62, also up 0.15%. On the 4-hour charts, both indices exhibit a downtrend (SP500 at 86% strength, Nasdaq at 84% strength), and their daily charts are decisively bearish (SP500 100% strength, Nasdaq 97% strength). This divergence between short-term gains and longer-term bearish technicals in equities is intriguing. While the immediate price action shows some resilience, the underlying trend on longer timeframes suggests caution. If these indices were to experience a more significant breakdown, we would typically expect a flight to safety, potentially benefiting silver. However, the current price action in XAGUSD, which is also in a strong downtrend, suggests that the market is currently prioritizing other bearish factors over a traditional risk-off rally in precious metals. It's possible that the selling pressure in silver is so acute that it's overshadowing any potential safe-haven bid from a weakening equity market.
Inflationary Signals: Brent Crude's Impact
Oil prices, particularly Brent Crude (Brent), often act as a leading indicator for inflation expectations. Rising oil prices can fuel inflation, prompting central banks to adopt more hawkish monetary policies (higher interest rates), which typically pressure non-yielding assets like silver. Brent Crude is currently trading at $107.81, down 1.69% for the day. However, its longer-term trend on the daily chart is strongly bullish (100% strength), with RSI at 80.31 indicating extreme overbought conditions. The 1-hour chart shows a bearish signal (ADX 32.95), while the 4-hour shows a bullish trend (94% strength). This mixed picture in oil prices reflects broader market uncertainty. Despite the intraday dip, the strong bullish trend on the daily chart suggests that upward pressure on oil, and by extension inflation, remains a significant underlying theme. If oil prices were to resume a strong upward trajectory, it could create a complex scenario for silver: higher inflation might normally support gold and silver as an inflation hedge, but it could also lead to more aggressive central bank tightening, which would be a headwind.
Scenario Analysis: Mapping XAGUSD's Potential Paths
The Bullish Scenario: A Rebound Above Resistance
For a bullish reversal to gain traction, XAGUSD needs to overcome immediate resistance and demonstrate sustained buying pressure. The most critical hurdle is the 1-hour resistance at $73.84. A decisive break and hold above this level, ideally accompanied by increasing volume, would signal a short-term shift in sentiment. Confirmation would come from the RSI moving above 50 and the ADX showing a decrease in trend strength, suggesting the downtrend is losing steam. The next significant resistance is at $74.26, followed by the 4-hour resistance at $75.32. If bulls can successfully navigate these levels, the psychological barrier at $75.00 would be a key psychological level to watch. A sustained move above $75.32 could open the door for a more significant recovery, potentially targeting the daily support turned resistance at $78.68. The invalidation for this scenario would be a failure to break above $73.84 and a subsequent drop back below the crucial $72.60 support level. This bullish outlook is currently the least probable, given the overwhelming bearish technicals on the 4-hour and daily charts, but it remains a possibility if market sentiment shifts dramatically or if a significant geopolitical event spurs safe-haven demand.
The Bearish Scenario: Downside Continues
The bearish outlook remains the most probable scenario, supported by strong technical indicators across multiple timeframes. The immediate price action at $73.20 is already testing the 1-hour support at $72.58. A break below this level would confirm the continuation of the selloff, targeting the next 1-hour support at $71.32. The 4-hour support levels at $71.74, $71.32, and $70.48 are critical zones to watch. A decisive close below $70.48 on the 4-hour chart would significantly increase the probability of a further move towards the daily support at $68.32. The ADX readings (58.21 on 1H, 62.5 on 4H) suggest that the downtrend has considerable momentum, and any bounces are likely to be short-lived profit-taking opportunities. The RSI on the 4-hour chart at 24.51 indicates oversold conditions, which could lead to a temporary technical bounce, but the strong ADX implies this bounce might not last. Invalidation for this bearish scenario would occur if XAGUSD decisively breaks and holds above the 1-hour resistance at $73.84, and subsequently clears the $75.32 resistance on the 4-hour chart. The probability of this scenario remains high due to the confluence of strong downtrend signals and the overall negative market sentiment.
The Neutral Scenario: Consolidation Around Key Levels
A neutral or range-bound scenario is also plausible, especially given the conflicting signals between shorter and longer timeframes. The 1-hour chart shows potential for a bounce, while the 4-hour and daily charts exhibit strong bearish pressure but with weakening trend strength on the daily (ADX 17.05). This could lead to a period of consolidation where XAGUSD trades sideways, oscillating between the immediate support at $72.60 and resistance at $73.84. Such a range could persist if key economic data releases are mixed or if geopolitical tensions remain elevated but without a clear escalation. In this scenario, traders would look for opportunities at the edges of the range, buying near support and selling near resistance. The daily chart's neutral trend (50% strength) and the presence of multiple support and resistance levels within a relatively tight range support this possibility. This scenario becomes more likely if neither the bulls nor the bears can decisively break through the key levels mentioned above, leading to a period of indecision before the next significant move. The invalidation for this scenario would be a clear break above $75.32 (bullish) or a decisive drop below $70.48 (bearish).
Bearish Continuation: The Path of Least Resistance
65% ProbabilityBullish Reversal: A Potential Bounce
15% ProbabilityConsolidation Phase: Waiting Game
20% ProbabilityKey Drivers and What to Watch Next
The Fed's Stance and Inflation Fears
Recent commentary from Federal Reserve officials has significantly dampened expectations for interest rate cuts in 2026, leaning towards a more hawkish stance. This shift in monetary policy outlook is a critical factor influencing XAGUSD. Higher-for-longer interest rates increase the opportunity cost of holding non-yielding assets like silver, making them less attractive to investors. The market is now pricing in a lower probability of rate cuts, which supports a stronger dollar (DXY) and puts pressure on commodities. Any further hawkish signals from the Fed, or persistent inflation data that justifies this stance, will likely continue to weigh on silver prices. Conversely, any indication of a softening stance or unexpected economic weakness that forces a policy pivot could provide a reprieve for XAGUSD.
Geopolitical Tensions and Safe-Haven Flows
The ongoing geopolitical landscape remains a significant wildcard. Rising tensions in the Middle East and other global hotspots can spur safe-haven demand, traditionally benefiting gold and, to some extent, silver. While silver's role as a safe haven is less pronounced than gold's, significant geopolitical escalations could still lead to a flight towards precious metals. News reports indicate that Bitcoin whales are moving significant amounts of capital amidst rising geopolitical tensions, and crude oil prices have spiked. While silver's price action has been predominantly bearish, a sudden geopolitical shock could override technicals, leading to a sharp reversal. Traders must remain vigilant, monitoring headlines for any developments that could trigger such a shift in market sentiment.
Economic Calendar Watchlist
Looking ahead, several key economic data releases could influence XAGUSD's trajectory. While specific upcoming events for the next 7 days are not detailed in the provided data, typical market-moving releases include inflation reports (CPI, PPI), employment figures (Non-Farm Payrolls, unemployment rate), and manufacturing/services PMIs. On the 1H chart, the RSI is at 40.31 and the ADX is 58.21, indicating a strong downtrend but with some room for a bounce. On the 4H, RSI is at 24.51, deep in oversold territory, signaling a potential for a technical rebound, but the ADX at 62.5 confirms the trend's strength. The daily chart shows a neutral trend (ADX 17.05), suggesting that while shorter timeframes are bearish, the longer-term trend might be losing steam. The key levels to watch remain the $72.60 support and $73.84 resistance on the 1H chart. A break below $72.58 invalidates the bullish potential and targets $71.32 and $70.48. Conversely, a break above $73.84 could target $74.26 and potentially $75.32, invalidating the bearish outlook.
What I'm Watching This Week
This week, my focus is on the $72.60 support level. A decisive break below this psychological and technical level would confirm the continuation of the bearish trend, opening the door for targets at $71.32 and $70.48. Conversely, any sustained move above the immediate 1-hour resistance at $73.84 would be the first sign of a potential bullish correction, with eyes then turning to $74.26 and $75.32. Given the strong bearish signals on the 4-hour chart, particularly the high ADX, the path of least resistance still appears to be downwards. However, the oversold RSI on the 4H chart suggests that a short-term bounce is possible. Therefore, I'll be watching for confirmation: a break of resistance for bullish continuation, a break of support for bearish continuation, or consolidation within the range if neither side can gain control. Patience and strict risk management will be key in navigating this volatile environment.
Frequently Asked Questions: XAGUSD Analysis
What happens if XAGUSD breaks below the $72.58 support level?
If XAGUSD breaks decisively below the $72.58 support on the 1-hour chart, it would confirm the bearish scenario. This would likely trigger further selling pressure, targeting the next key support levels at $71.32 and potentially $70.48 on the 4-hour timeframe.
Should I buy XAGUSD at current levels around $73.20 given the oversold RSI on the 4H chart?
Buying at current levels around $73.20 is a high-risk contrarian trade. While the 4-hour RSI at 24.51 is deeply oversold, the extremely strong ADX of 62.5 indicates a powerful downtrend. A more prudent approach would be to wait for confirmation, such as a clear break above resistance or a more robust bullish signal, before considering a long position.
Is the RSI at 40.31 on the 1H chart a sell signal for XAGUSD right now?
An RSI of 40.31 on the 1-hour chart is not an extreme sell signal but indicates bearish momentum. It suggests that sellers are in control, but the level is not yet in oversold territory, leaving room for further downside or a brief consolidation before any potential bounce.
How will the Fed's hawkish stance affect XAGUSD this week?
The Fed's hawkish stance, which dampens rate cut expectations, generally supports the US Dollar (DXY) and puts pressure on commodities like silver. If this stance persists, it is likely to act as a headwind for XAGUSD, potentially reinforcing the current bearish trend, especially if the DXY strengthens.
Track markets in real-time
AI-powered analysis, technical indicators and real-time price data.
Join Our Telegram Channel
Breaking market news, AI analysis and trading signals instantly.
Join Channel