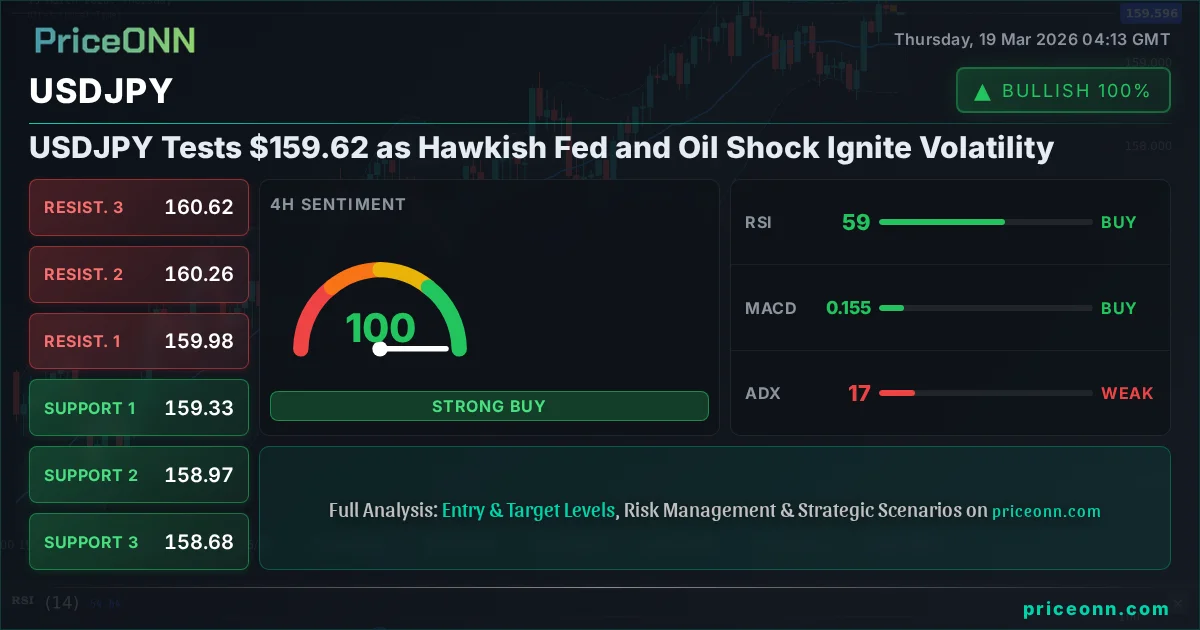
USDJPY Tests $159.62 as Hawkish Fed and Oil Shock Ignite Volatility
USDJPY hovers near $159.62 amid a hawkish Fed stance and surging oil prices. Technicals show mixed signals, with key levels at $159.33 and $160.20.
The currency markets are on edge as USDJPY finds itself at a critical juncture, flirting with the psychologically significant 160 level. This pivotal moment arrives on the heels of a hawkish Federal Reserve policy announcement and a dramatic surge in oil prices, creating a potent cocktail of volatility and uncertainty. The dollar's strength, buoyed by these factors, is clashing with the yen's traditional safe-haven appeal, leaving traders scrambling to decipher the next move. The current price of $159.62 is not just a number; it's a battleground where macroeconomic forces and technical indicators are locked in a fierce contest.
- USDJPY is trading at $159.62, with the 4-hour chart showing a ADX of 16.67, indicating choppy market conditions.
- Critical resistance looms at $160.20, while key support is found at $159.33.
- The Stochastic %K is 49.23 and %D is 72.77, suggesting a potential downward shift from current levels.
- Fed's hawkish signals and rising Brent crude at $112.59 are driving USD correlation with DXY, currently at 99.94.
The narrative driving USDJPY's current position is complex, blending monetary policy expectations with acute geopolitical and energy market shocks. The Federal Reserve, in its latest pronouncements, has signaled a more cautious approach to rate cuts than previously anticipated, with some projections even suggesting as few as one cut this year. This hawkish undertone strengthens the dollar, as higher-for-longer interest rates make dollar-denominated assets more attractive. This aligns with the DXY's current price of 99.94, which has been climbing steadily, indicating a broader dollar strength across major currency pairs. The yen, meanwhile, often acts as a barometer for global risk sentiment. When geopolitical tensions flare, as they have in the Middle East, the yen typically strengthens. However, the current environment sees the dollar's resilience overshadowing the yen's safe-haven status, a divergence that warrants close examination.
The Dollar's Resilience Amidst Shocks
The recent surge in Brent crude prices to $112.59 per barrel is a significant development, primarily due to escalating Middle East tensions and potential supply disruptions. Higher oil prices have a dual effect: they can fuel inflation, prompting central banks to maintain tighter monetary policies, and they can also dampen global economic growth. For the US, which is a major oil producer, the inflationary impact might be somewhat mitigated, but the overall effect on global demand and risk appetite is undeniable. This inflationary pressure reinforces the Federal Reserve's hawkish stance. The market is now pricing in a lower probability of aggressive rate cuts, which directly benefits the US dollar. The RSI(14) on USDJPY's 1-hour chart is at 57.89, suggesting upward momentum, though not yet in overbought territory. This aligns with the broader dollar strength narrative.
The correlation between USDJPY and the Dollar Index (DXY) is a crucial element to watch. Historically, a stronger dollar typically translates to a stronger USDJPY pair. With the DXY currently trading at 99.94 and showing upward momentum across multiple timeframes, the pressure on USDJPY to push higher is significant. The 4-hour ADX for USDJPY stands at 22.45, indicating a moderate downtrend, which seems counterintuitive to dollar strength. However, this can also reflect consolidation within a broader trend, where short-term fluctuations occur before a more decisive move. The MACD on the 1-hour chart shows negative momentum, but it's above the signal line, hinting at a potential shift.
Technical Crossroads: $159.33 vs. $160.20
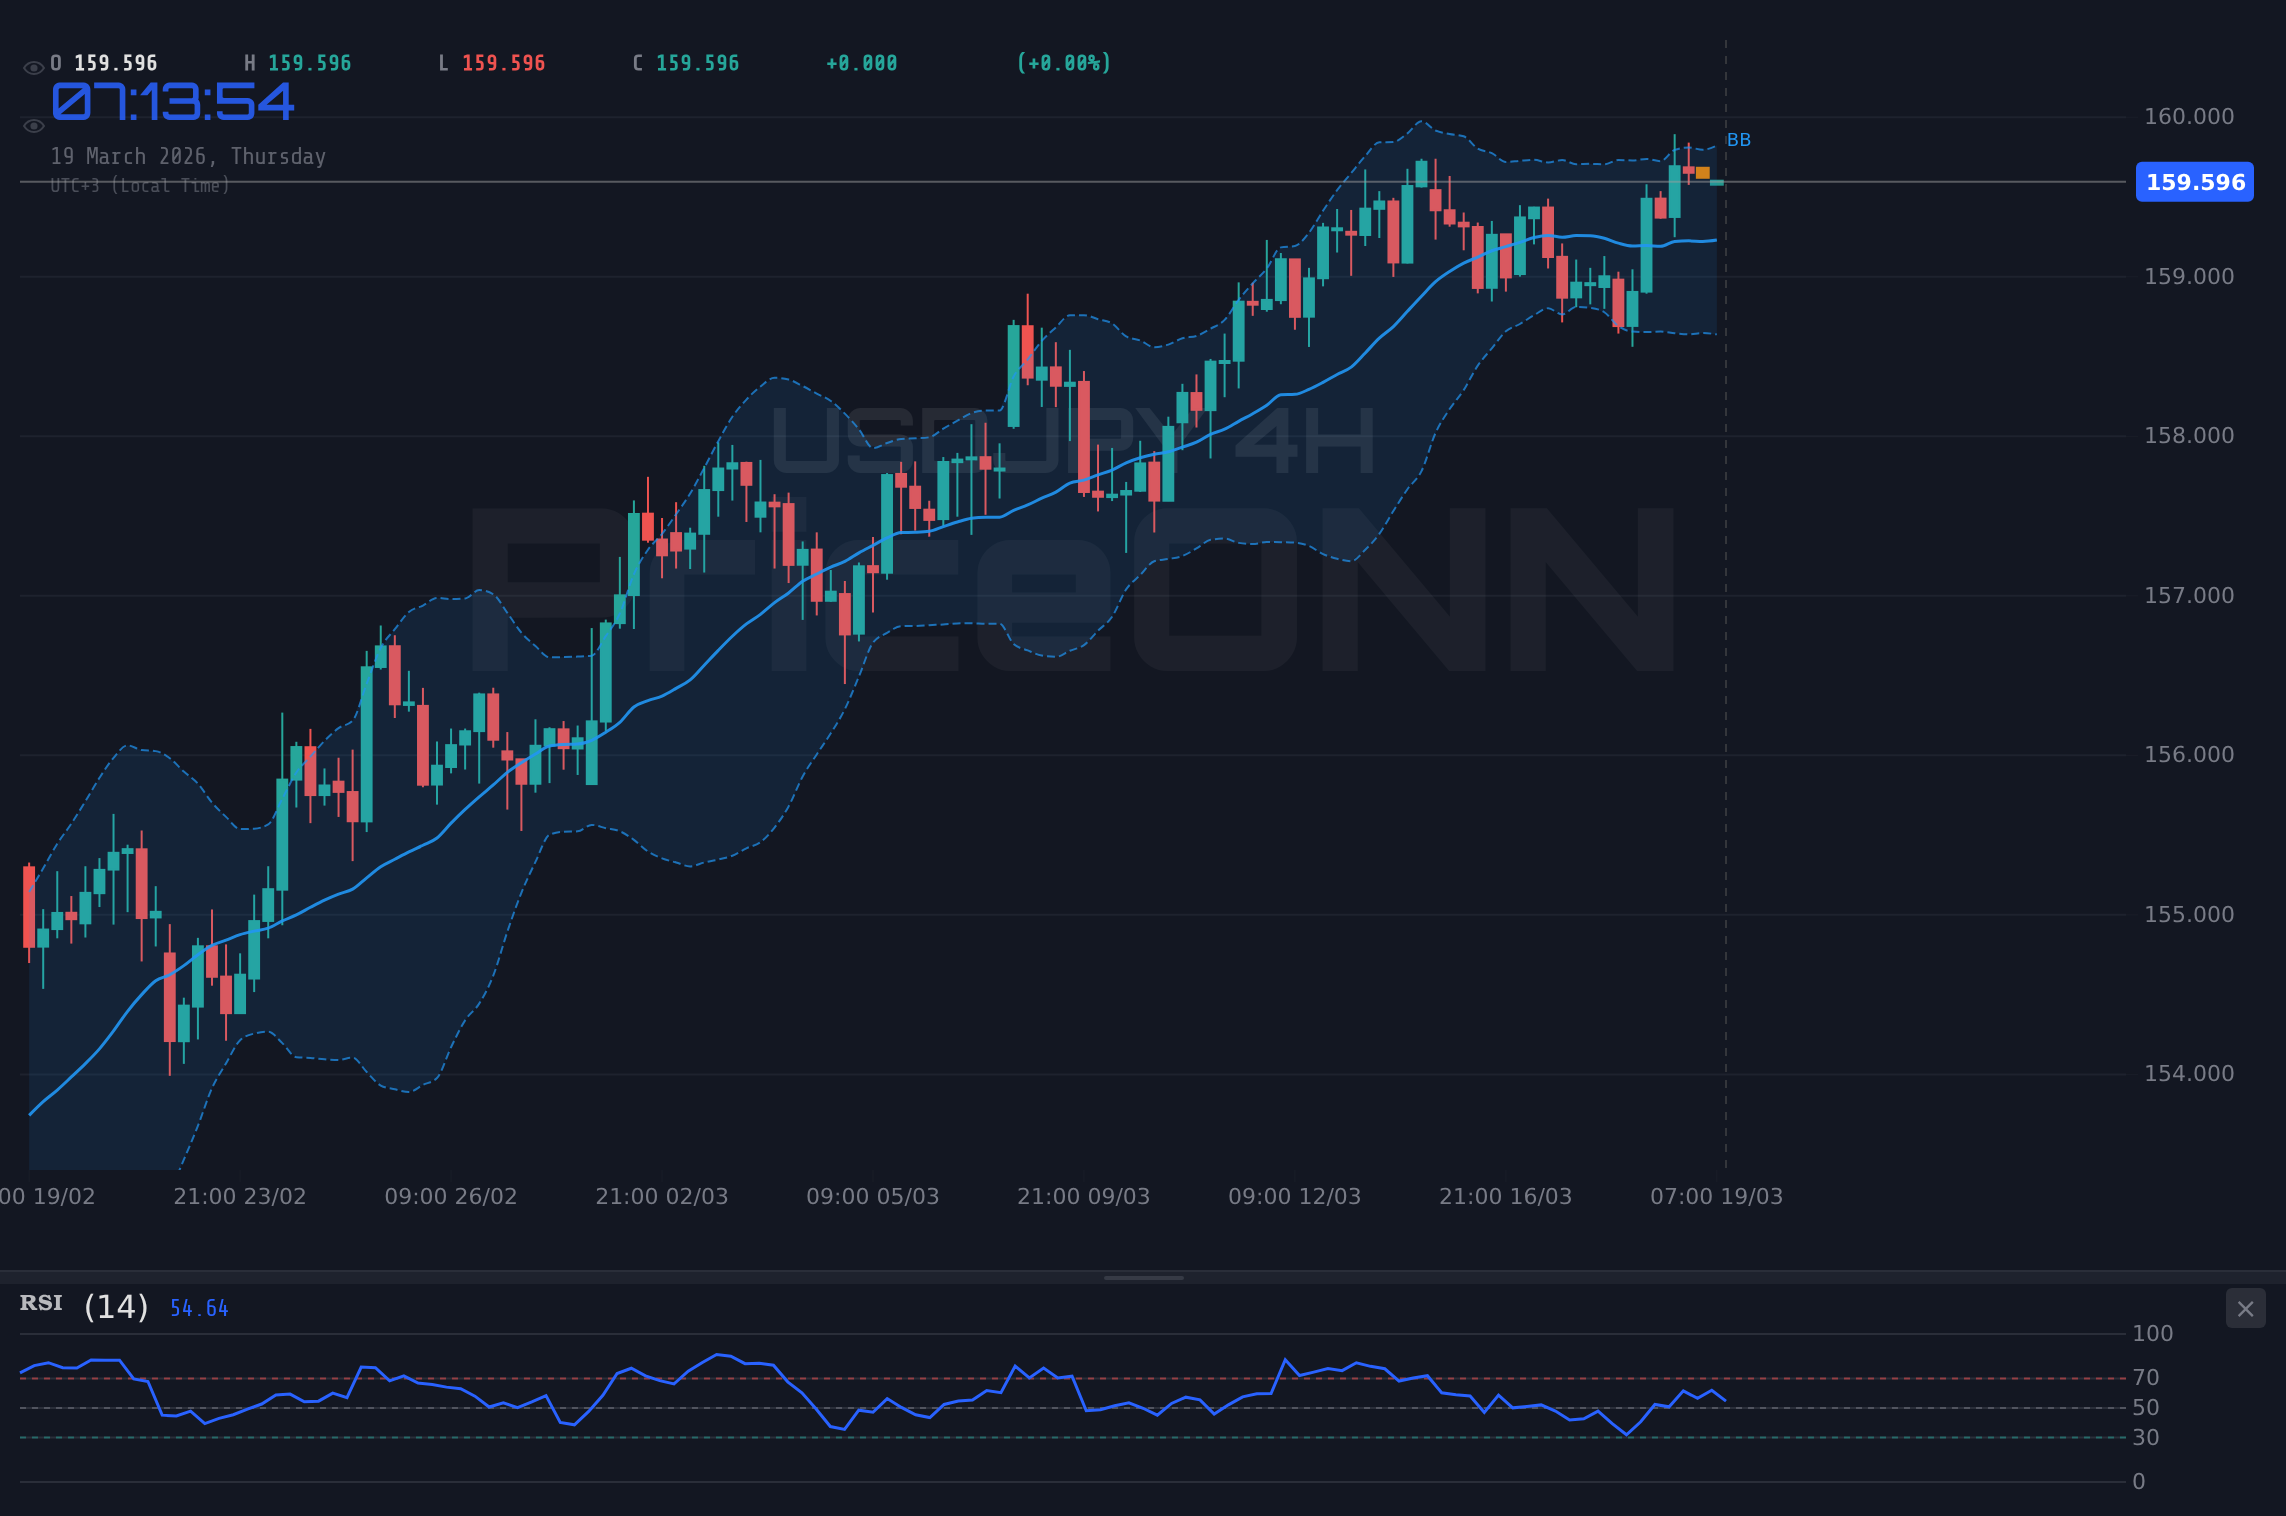
From a technical standpoint, USDJPY is navigating a complex landscape. The current price of $159.62 places it squarely between key support and resistance levels. On the 1-hour chart, immediate support is identified at $159.56, followed by $159.465 and $159.395. Conversely, resistance is stacking up around $159.725, $159.795, and the significant psychological barrier at $159.89. The daily ADX reading of 15.81 suggests a weak overall trend, pointing towards a potentially ranging or consolidating market in the longer term, despite the intraday volatility.
The divergence in signals across different timeframes adds to the complexity. While the 1-hour chart shows some upward momentum with an RSI of 57.89, the 4-hour chart paints a more cautious picture. The 4-hour RSI is at 42.11, and the Stochastic shows %K at 31.15 and %D at 66.22, indicating a bearish signal with %K below %D. The overall signal on the 4-hour timeframe is SAT (Sell), with only one neutral reading. This suggests that the short-term bullish pressure might be fading, and a move towards the support levels could be more probable in the medium term.
On the daily chart, the picture becomes even more nuanced. The daily RSI is 66.14, indicating a strong upward trend but approaching overbought territory. The Stochastic is in the overbought zone with %K at 86.1 and %D at 88.38, signaling a potential pullback or consolidation. The ADX at 23.99 suggests a moderately strong uptrend, but the overbought Stochastic is a warning sign. This confluence of indicators suggests that while the bulls have been in control, the pair might be due for a pause or a retracement before attempting to decisively break above the 160 mark. The Bollinger Bands on the 1-hour chart are above the middle band, supporting the upward bias, but the daily Bollinger Bands are also above the middle band, indicating an uptrend.
Navigating the Uncertainty: Scenarios Ahead
Given the conflicting signals and the high-impact macroeconomic backdrop, a scenario-based approach is essential for navigating USDJPY. The decision score of 1/8 for WATCH_ZONE, driven by the weak ADX of 16.67 on the daily chart, highlights the current choppy nature of the market. This suggests that while directional signals exist, the conviction might be lacking, making any trade a high-risk proposition without further confirmation.
Bearish Scenario: Profit-Taking and Fed Confirmation
65% ProbabilityNeutral Scenario: Consolidation Around 159.50
25% ProbabilityBullish Scenario: Breakout Above 160
10% ProbabilityThe bearish scenario appears most probable in the short to medium term. The Stochastic %K at 49.23 and %D at 72.77 on the 1-hour chart, coupled with the 4-hour RSI of 42.11, suggests waning bullish momentum. A break below the $159.33 support level could trigger a sell-off towards $158.966. This would be amplified if the Fed maintains its hawkish rhetoric in subsequent communications, or if oil prices continue to climb, further pressuring global growth and risk appetite.
Conversely, the bullish scenario hinges on a decisive break above the $160.20 resistance. This would require significant follow-through buying, possibly driven by unexpected dovish signals from the Fed or a de-escalation of geopolitical tensions. The daily chart's ADX of 23.99 indicates a trend is present, but the daily Stochastic's overbought readings (K=86.1, D=88.38) suggest that such a breakout would likely face immediate profit-taking. The neutral scenario anticipates a period of consolidation, likely between $159.33 and $159.795, as the market digests the latest news and awaits clearer direction.
What to Watch Next
The coming days will be crucial for USDJPY. Traders will be closely monitoring any further commentary from Federal Reserve officials for clues about the future path of interest rates. Any hint of a shift towards a more accommodative stance could put immediate pressure on the dollar and USDJPY. Similarly, developments in the Middle East and their impact on oil prices will remain a key focus. A sustained rise in oil prices could lead to renewed inflation concerns, potentially reinforcing the Fed's hawkish bias. The 1-hour RSI at 57.89 and the daily RSI at 66.14 show room for upward movement, but the overbought Stochastic on the daily chart acts as a significant headwind for any sustained rally above 160.
From a technical perspective, the current daily ADX of 15.81 indicates a lack of strong directional conviction in the longer term. This implies that while short-term volatility might persist, a significant breakout requires more than just the current macro drivers. Traders should pay close attention to volume on any moves towards the $160.20 resistance level. High volume on a breakout would lend more credibility to the bullish scenario, while low volume might signal a 'bull trap'. Conversely, a decisive break below $159.33 with increasing volume could confirm the bearish outlook, targeting lower support levels. The 4-hour chart's general signal of SAT (Sell) reinforces the caution needed for any long positions above the current price.
Frequently Asked Questions: USDJPY Analysis
What happens if USDJPY breaks above the $159.89 resistance level?
A confirmed break above $159.89, especially on high volume, could trigger a move towards the $160.20 resistance. This bullish scenario is currently assigned a 10% probability due to prevailing headwinds.
Is USDJPY a buy at current levels near $159.62 given the hawkish Fed?
Buying at $159.62 is risky. While the Fed's hawkish stance supports the dollar, the 4-hour RSI is only 42.11 and the daily Stochastic is overbought. A more prudent approach would be to wait for a confirmed break above $160.20 or a pullback to support levels like $159.33.
What does the ADX reading of 16.67 on the daily chart mean for USDJPY?
An ADX of 16.67 on the daily chart suggests a weak trend and potentially a ranging market. This indicates that while intraday moves can be volatile, there is a lack of strong directional conviction, making breakouts less reliable until confirmed by other indicators and price action.
How will rising Brent crude prices at $112.59 impact USDJPY's trend?
Rising oil prices to $112.59 can fuel inflation, reinforcing the Fed's hawkish stance. This indirectly supports USDJPY by strengthening the dollar. However, if oil prices surge excessively, they could also dampen global growth, potentially increasing risk aversion and benefiting the yen, creating conflicting pressures on the pair.
| Indicator | Value | Signal | Interpretation |
|---|---|---|---|
| RSI (14) | 57.89 | Neutral | Suggests upward momentum, but nearing overbought on longer timeframes. |
| MACD Histogram | -0.05 | Neutral | Negative momentum present on 1H, but above signal line. |
| Stochastic | K=49.23, D=72.77 | Bearish | %K below %D indicates potential downward shift. |
| ADX | 15.81 (1D) | Weak | Daily trend is weak, suggesting consolidation or ranging market. |
| Bollinger Bands | Middle Band | Watch | Price is above middle band on 1H and 1D, indicating uptrend bias. |
The interplay between the Federal Reserve's policy path and the energy market's volatility creates a complex environment for USDJPY. While the dollar shows resilience, the technical picture suggests caution is warranted. A break below $159.33 could initiate a downward move, while a sustained push above $160.20 would signal a significant bullish shift. For now, the daily ADX of 15.81 suggests traders should anticipate range-bound conditions until a clearer catalyst emerges.
Track markets in real-time
AI-powered analysis, technical indicators and real-time price data.
Join Our Telegram Channel
Breaking market news, AI analysis and trading signals instantly.
Join Channel