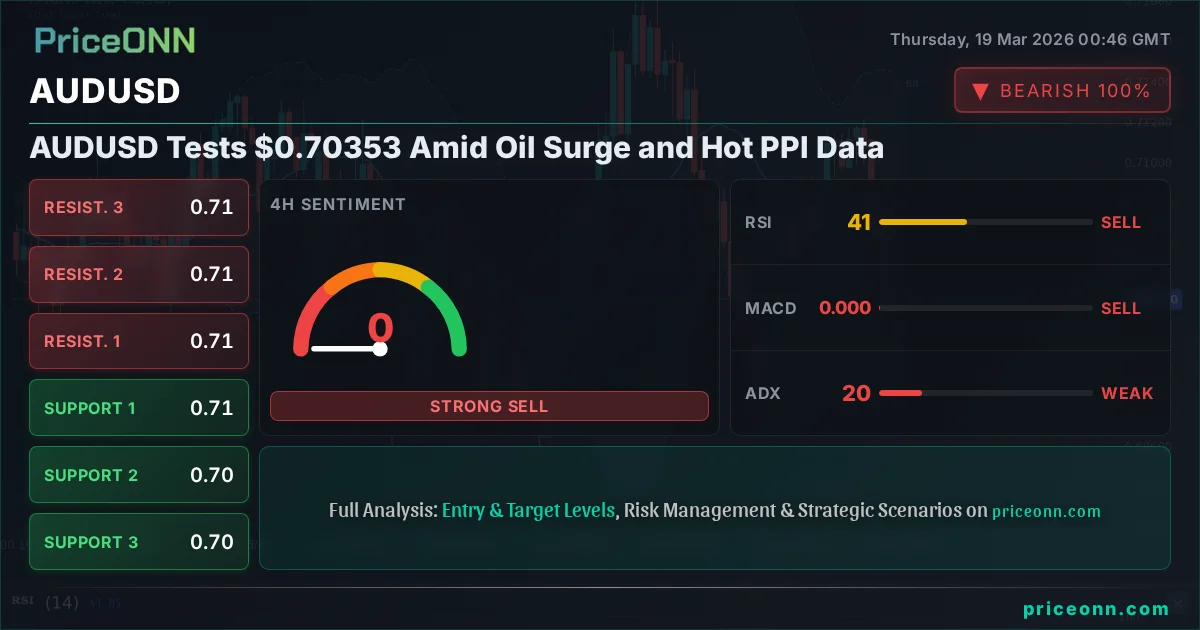
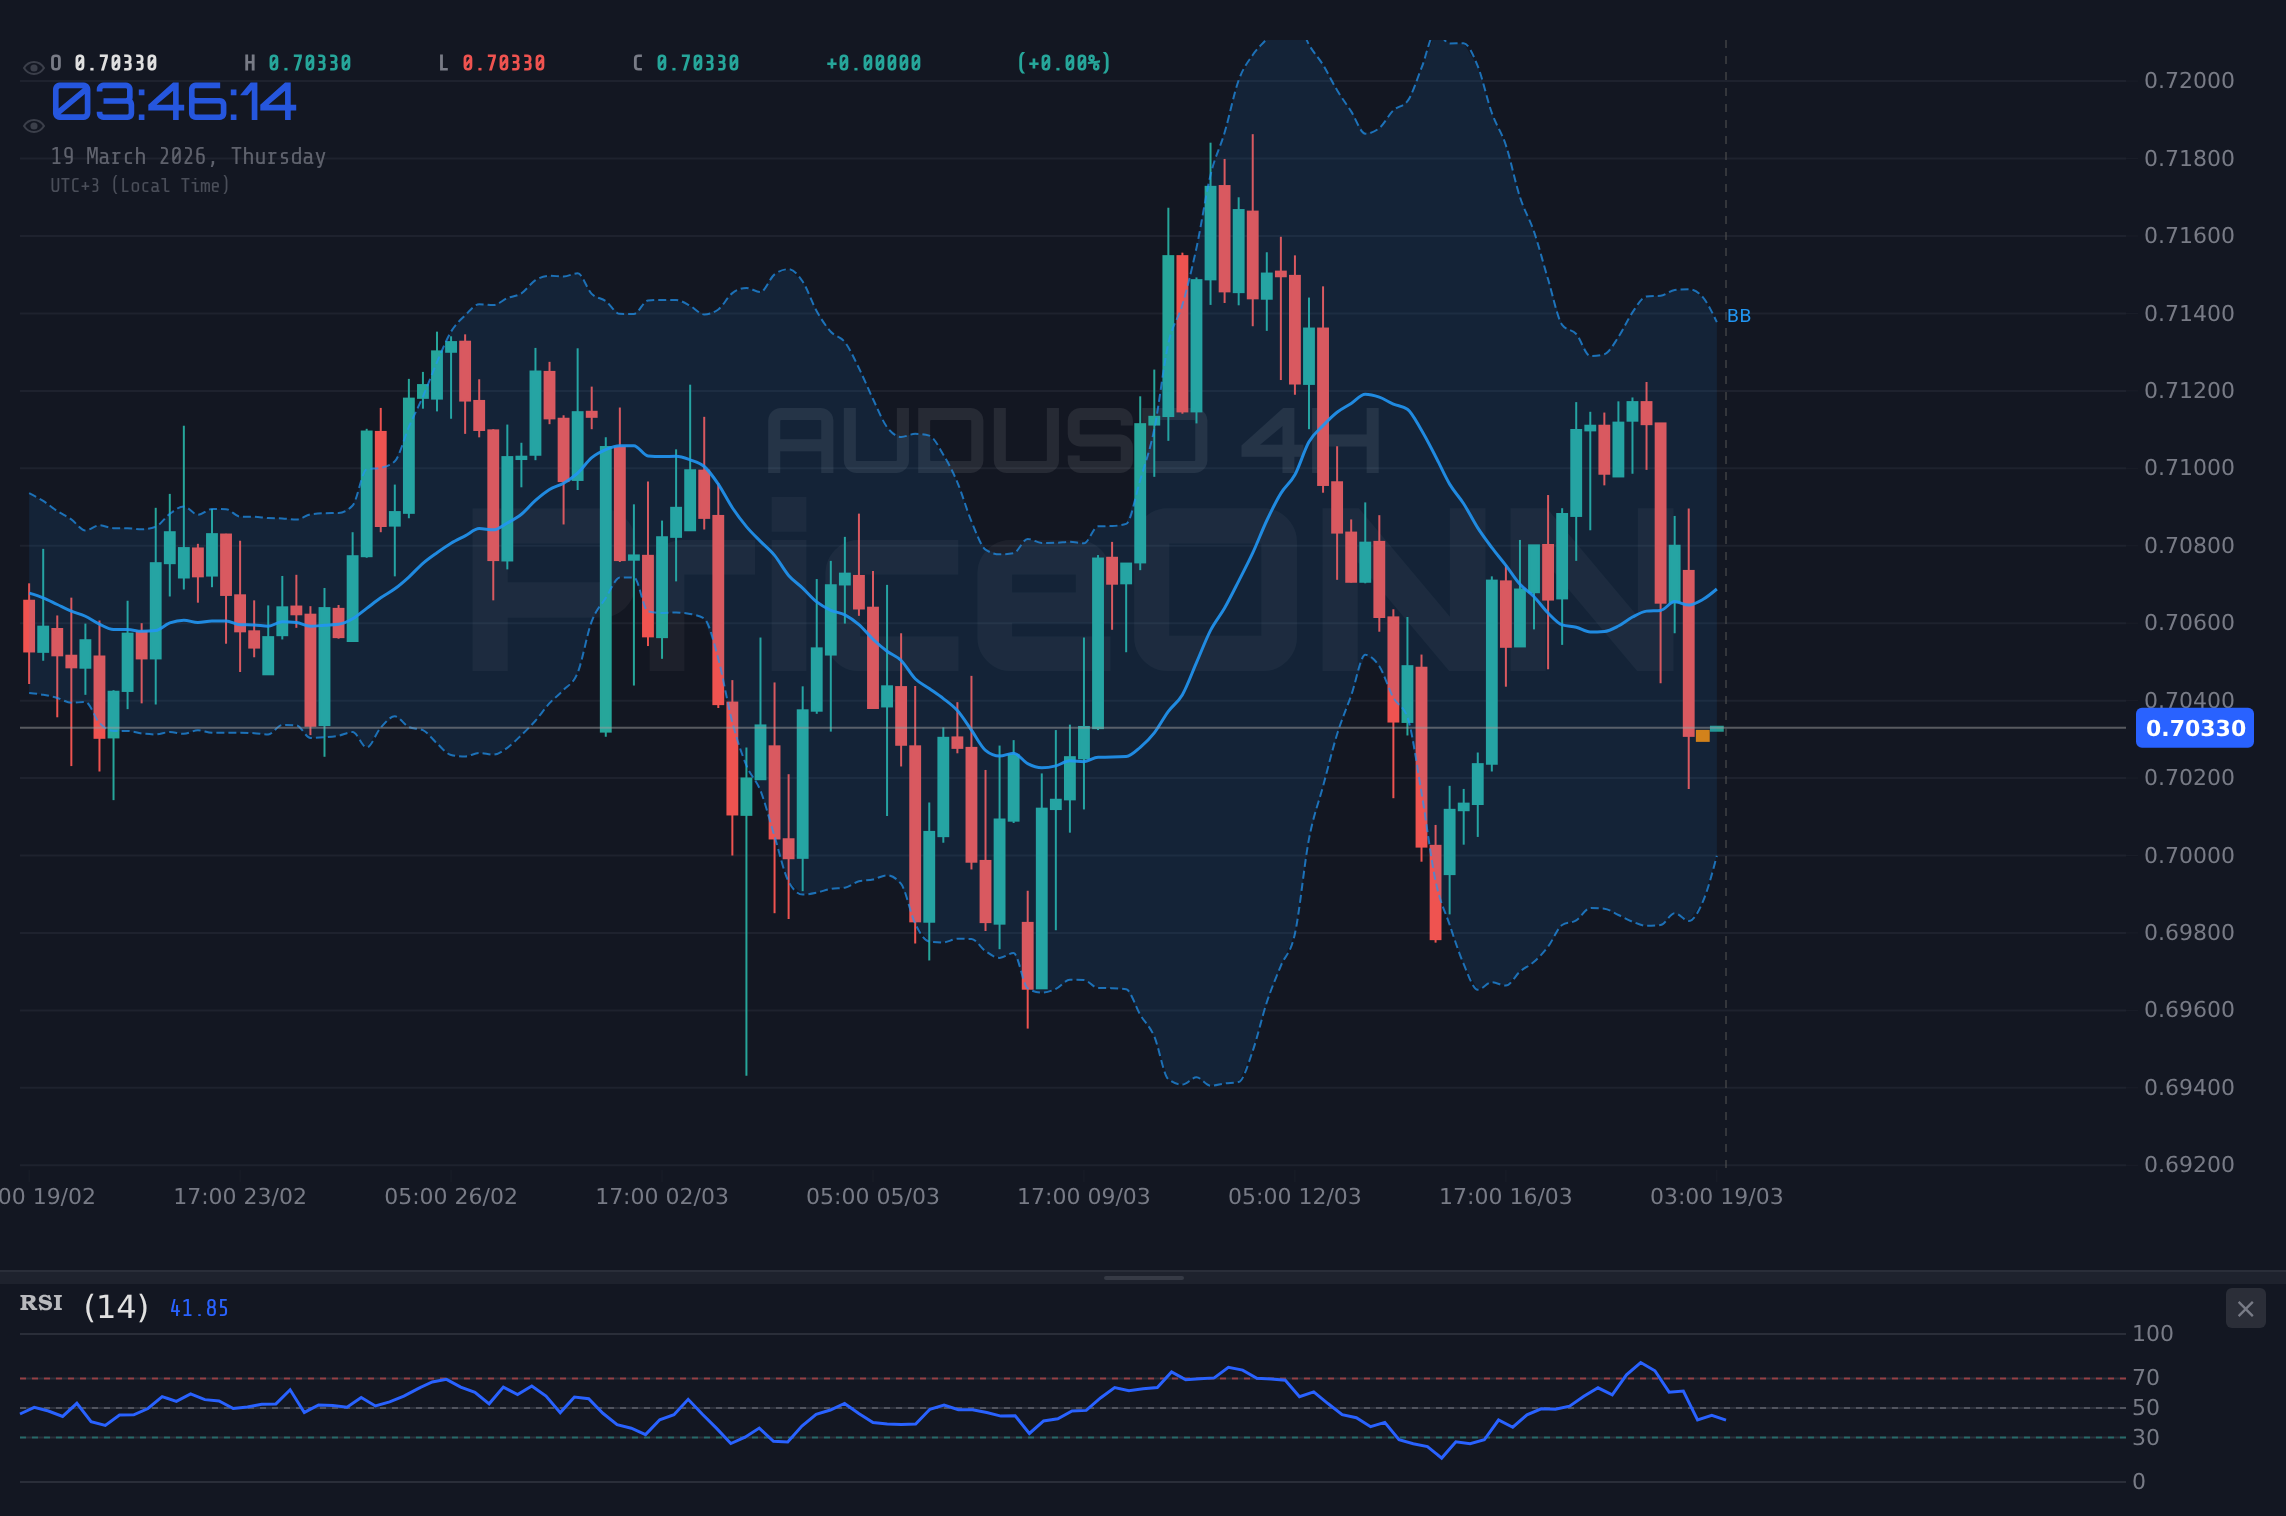
AUDUSD Tests $0.70353 Amid Oil Surge and Hot PPI Data
AUDUSD hovers at $0.70353 as Brent crude rallies past $109 and US PPI data shocks markets, creating tension ahead of the Fed decision.
Is AUDUSD on the verge of a significant move? The pair is currently locked in a tense battle around the $0.70353 mark, caught between a surging oil price and unexpectedly hot US PPI data. This volatility paints a complex picture as traders brace for the Federal Reserve's upcoming policy decision. The Australian dollar faces headwinds from a strengthening US Dollar Index (DXY), currently at 99.96, which typically pressures risk-sensitive currencies like the AUD. However, the dramatic spike in Brent Crude oil prices to $109.87 and the robust US PPI figures are injecting a new layer of uncertainty, potentially influencing central bank narratives and market sentiment. This analysis dives deep into the bull and bear arguments for AUDUSD, dissecting the technical indicators and fundamental drivers to understand where this pair might be headed next.
- AUDUSD is trading at $0.70353, with key support at $0.70182 and resistance at $0.70297 on the 1H chart.
- US PPI data came in hot, increasing inflation concerns and supporting a stronger USD (DXY at 99.96).
- Brent Crude surged to $109.87, a significant inflationary driver that could impact RBA/Fed policy divergence.
- The 1H RSI at 32.73 suggests bearish momentum, but Stochastic shows a potential oversold bounce signal (%K: 14.13, %D: 16.41).
- The ADX at 32.87 on the 1H chart indicates a strong downtrend, adding to the bearish technical picture.
The Bull Case: Can AUDUSD Find Footing?
On one side of the AUDUSD tug-of-war are the bulls, clinging to the hope that current levels might offer a floor. The Australian dollar, despite its recent struggles, is not without its potential catalysts. One primary argument for a bullish turnaround stems from the sheer extent of the recent sell-off. With the 1H RSI dipping to 32.73 and the 1D RSI at 49.1, the pair is certainly not in overbought territory. In fact, on the 1H chart, the Stochastic Oscillator is flashing a potential buy signal with %K (14.13) crossing above %D (16.41) from oversold conditions. This technical divergence, while nascent, suggests that the selling pressure might be exhausting itself. Furthermore, the AUDUSD is currently testing crucial support levels. On the 1H chart, $0.70182 stands out as the immediate floor, followed by $0.70135. A hold above these levels, especially if accompanied by a pickup in buying volume, could initiate a short-term recovery. The 4H chart also shows support at $0.70624, $0.70447, and $0.70321 – the latter being very close to the current price, highlighting the critical nature of the $0.70353 level.
Fundamentally, while the strong US PPI data and a rising DXY (currently 99.96) present immediate challenges, the narrative could shift. If the Federal Reserve, despite the hot inflation print, signals a more cautious approach to future rate hikes or maintains its current stance, it could provide some relief to risk assets and currencies like the AUD. The market is highly sensitive to Fed rhetoric, and any hint of a less aggressive tightening path could see the DXY pull back, creating breathing room for AUDUSD. Moreover, the surge in Brent Crude to $109.87, while inflationary, also highlights potential geopolitical tensions that can sometimes lead to a flight to perceived 'safer' risk assets, or at least a temporary pause in risk aversion if central banks appear to have inflation under control. The RBA's stance and future policy expectations also play a crucial role; any indication that the Reserve Bank of Australia might be more hawkish than anticipated could bolster the AUD independently of broader market sentiment.
The Stochastic crossover on the 1H chart, moving from oversold conditions, is the most compelling bullish technical signal right now. However, it needs confirmation from price action holding above the immediate support at $0.70182 and a broader shift in risk sentiment, potentially triggered by a less hawkish Fed tone.
The Bear Case: Downside Risks Mount
Conversely, the bears have a formidable case, bolstered by both technical indicators and recent fundamental developments. The prevailing trend across multiple timeframes is decidedly bearish. The 1H chart shows a strong downtrend with an ADX reading of 32.87, indicating significant trend strength. The 4H ADX at 46.68 and the 1D ADX at 16.6 (though weaker, suggesting consolidation) paint a picture where bearish momentum has been dominant. The current price of $0.70353 sits precariously close to the 1H support at $0.70321, and a break below this level could accelerate the decline. The immediate 1H resistance is at $0.70297, followed by $0.70365 and $0.70412. If the price fails to break higher and instead pushes through the $0.70321 support, the next targets would be the lower 1H supports at $0.70182, $0.70135, and $0.70067.
The fundamental backdrop strongly favors the bears. The US Dollar Index (DXY) is showing robust strength, currently trading at 99.96 and aiming to reclaim the 100.00 level, as reported by news outlets. This strength is largely fueled by the surprisingly high US PPI data released on March 18th, which showed inflation pressures intensifying. This increases the likelihood that the Federal Reserve might adopt a more hawkish stance, potentially keeping interest rates higher for longer, or even considering further hikes if inflation proves persistent. Such a scenario would typically lead to capital flowing into the greenback, putting significant downward pressure on riskier currencies like the Australian dollar. The correlation between DXY and AUDUSD is undeniable; as the dollar strengthens, the AUDUSD pair tends to fall. The sharp decline in gold prices (XAUUSD down 3.3% below $5,000) also reflects a potential shift towards a 'risk-off' sentiment or a de-emphasis on safe-haven assets, which can sometimes accompany a strong dollar environment.
Furthermore, the correlation with major equity indices like the SP500 (currently 6611.6) and Nasdaq100 (24373.24), both experiencing significant drops (-1.59% and -1.71% respectively), suggests a broader 'risk-off' sentiment in the market. When global risk appetite wanes, the Australian dollar, often considered a risk-on currency, tends to underperform. The high oil prices, while beneficial for commodity exporters, also contribute to inflation fears, potentially leading to tighter monetary policy globally, which can dampen economic growth expectations and weigh on currencies sensitive to global demand.
The confluence of strong bearish signals across multiple timeframes - high ADX, bearish MACD momentum, and prices below the middle Bollinger Band - suggests that the downside risk is significant. A break below the $0.70321 support level on the 1H chart could trigger a rapid move lower.
Bridging the Divide: What the Charts and Data Say
Examining the technical landscape reveals a battleground where conflicting signals are present, but the overall bearish bias is hard to ignore. On the 1H chart, the RSI at 32.73 hovers near oversold territory, hinting at potential for a bounce. However, the MACD remains firmly in negative territory, with its histogram below the signal line, indicating persistent selling momentum. The Stochastic Oscillator's crossover (%K > %D) is a bullish sign, but its position in the oversold zone means it could either signal a reversal or simply precede further downside if the trend remains strong. The ADX at 32.87 confirms a strong existing downtrend, making any counter-trend moves susceptible to quick reversals. The price action is currently hugging the lower Bollinger Band, a sign of bearish pressure.
On the 4H timeframe, the picture darkens further. The RSI at 31.43 for XAGUSD (a related metal, but indicative of commodity sentiment) and 39 for AUDUSD itself, both point to a neutral-to-bearish bias, far from oversold conditions that might signal a strong reversal. The MACD is also negative, reinforcing the bearish momentum. The ADX here is even stronger at 46.68 for XAGUSD and 21.38 for AUDUSD, indicating a solid downtrend is in play on this timeframe. The Stochastic on the 4H AUDUSD chart shows %K (41.03) below %D (75.94), a clear bearish signal. The price is trading below the middle Bollinger Band, suggesting a continuation of the downward trend. Even the daily chart, while showing a weaker ADX of 14.48 for XAUUSD and 16.6 for XAGUSD, indicating potential consolidation, still has RSI readings below 50 and MACD in negative territory for AUDUSD (33.76 RSI, negative MACD), suggesting that any upside is likely to face resistance.
The correlation with the DXY at 99.96 is critical. As the dollar index shows strength and aims for the 100.00 mark, AUDUSD faces direct selling pressure. The hot PPI data is a significant factor that could embolden the Fed, leading to further dollar strength and AUDUSD weakness. The surge in Brent Crude to $109.87, while positive for commodity currencies in theory, is currently overshadowed by inflation fears and the resulting hawkish central bank expectations, which tend to favor the dollar.
The Verdict: Bears in Control, But Watch for Fed Signals
The prevailing technical and fundamental evidence leans heavily towards a bearish outlook for AUDUSD in the short term. The strong downtrend indicated by the ADX across multiple timeframes, coupled with negative MACD momentum and prices consistently trading below key moving averages (as seen on the Bollinger Bands), suggests that downside risks are more pronounced than upside potential. The immediate support at $0.70321 on the 1H chart is critical; a decisive break below this level could open the door for a rapid move towards $0.70182 and potentially lower. The strengthening DXY, driven by hot US PPI data, further reinforces this bearish narrative, as the dollar's upward trajectory typically comes at the expense of riskier currencies like the AUD.
However, the market is rarely a one-way street. The oversold conditions on the 1H Stochastic Oscillator and the RSI hovering near the 30 level present a flicker of hope for the bulls. A significant catalyst would be required to reverse the current trend. This could come in the form of a surprisingly dovish tone from the Federal Reserve following their upcoming policy meeting, or a significant de-escalation of geopolitical tensions in the Middle East that currently drive oil prices higher. If the Fed signals a pause or a slower pace of tightening, the DXY could retreat, allowing AUDUSD to recover. Similarly, if the market begins to price in a more aggressive RBA stance relative to the Fed, it could provide underlying support for the Australian dollar.
For now, traders should remain cautious. The strength of the current downtrend suggests that any rallies might be short-lived profit-taking opportunities rather than the start of a sustained recovery. The key levels to watch remain the immediate 1H support around $0.70321 and the corresponding resistance near $0.70297. A clear break and hold above resistance, confirmed by increasing volume and a shift in broader market sentiment, would be needed to invalidate the bearish thesis. Conversely, a break below support could confirm the continuation of the downtrend, targeting the next levels detailed in the scenario cards below. The upcoming Fed announcement will be pivotal in shaping the immediate direction.
Bearish Scenario: Downside Momentum Continues
70% ProbabilityNeutral Scenario: Consolidation Around $0.70353
20% ProbabilityBullish Scenario: Technical Bounce and USD Weakness
10% ProbabilityFrequently Asked Questions: AUDUSD Analysis
What happens if AUDUSD breaks below the $0.70321 support level amid strong DXY momentum?
A break below $0.70321 would likely accelerate the bearish trend, driven by the strong DXY at 99.96 and hawkish Fed expectations. The immediate target would be $0.70182, with further downside potential towards $0.70067 if selling pressure intensifies.
Should I consider buying AUDUSD at current levels around $0.70353 given the Stochastic crossover signal?
While the 1H Stochastic shows a potential oversold crossover, the overall bearish trend and strong DXY make this a high-risk entry. A confirmation would require a decisive close above $0.70365 resistance, ideally coupled with a dovish Fed signal, giving it only a 10% probability.
Is the RSI at 32.73 a sell signal for AUDUSD, or does it indicate a potential bottom?
An RSI of 32.73 on the 1H chart suggests bearish momentum is strong but approaching oversold territory. It's not a direct sell signal itself but indicates that the market is under pressure. A sustained move below 30 would strengthen the bearish case, while a bounce from this level would require confirmation from other indicators and price action.
How will the hot US PPI data and rising Brent Crude prices impact AUDUSD ahead of the Fed decision?
The hot PPI data strengthens the case for a hawkish Fed, likely boosting the DXY and pressuring AUDUSD. While rising oil prices ($109.87 Brent) can support commodity currencies, the immediate inflationary impact and Fed reaction seem to be dominating market sentiment, favoring the dollar.
| Indicator | Value | Signal | Interpretation |
|---|---|---|---|
| RSI (14) | 32.73 | Bearish | Approaching oversold, potential bounce zone |
| MACD Histogram | -0.00XX | Bearish | Negative momentum persists |
| Stochastic | K: 14.13, D: 16.41 | Bullish Crossover | Potential oversold bounce signal |
| ADX | 32.87 | Strong Trend | Confirms strong downtrend |
| Bollinger | Mid Band | Below | Price under pressure |
Track markets in real-time
AI-powered analysis, technical indicators and real-time price data.
Join Our Telegram Channel
Breaking market news, AI analysis and trading signals instantly.
Join Channel