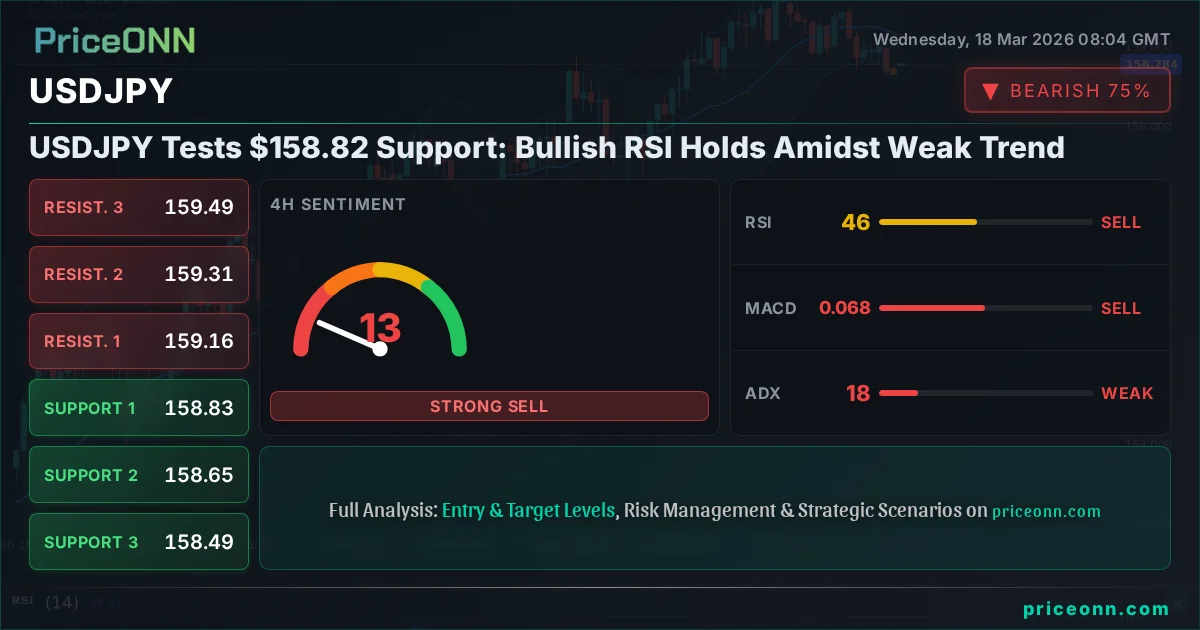
USDJPY Tests $158.82 Support: Bullish RSI Holds Amidst Weak Trend
USDJPY hovers around $158.82, testing key support. While the 1D ADX shows a weak trend, a bullish RSI divergence on the daily chart offers a glimmer of hope for bulls. Can this support hold?
The relentless march of USDJPY has paused, with the pair currently testing critical support levels around the $158.82 mark. This moment of consolidation presents a fascinating battleground for traders: do the bulls have enough firepower to defend this level, or will the prevailing downward momentum on shorter timeframes overwhelm the more constructive signals emerging on the daily chart? A close look at the technical indicators, particularly the RSI divergence, alongside the broader market context, is crucial for navigating this pivotal juncture. The market's reaction here will likely set the tone for the pair's immediate future.
- USDJPY is currently trading at $158.82, testing significant support.
- The 1-Day ADX reading of 13.43 indicates a weak trend, suggesting choppiness ahead.
- A bullish divergence is emerging on the 1-Day RSI (46.52), hinting at potential underlying strength despite the current price action.
- The DXY is showing strength, trading at 99.39, which typically adds pressure to USDJPY.
The Tug-of-War at $158.82: A Technical Showdown
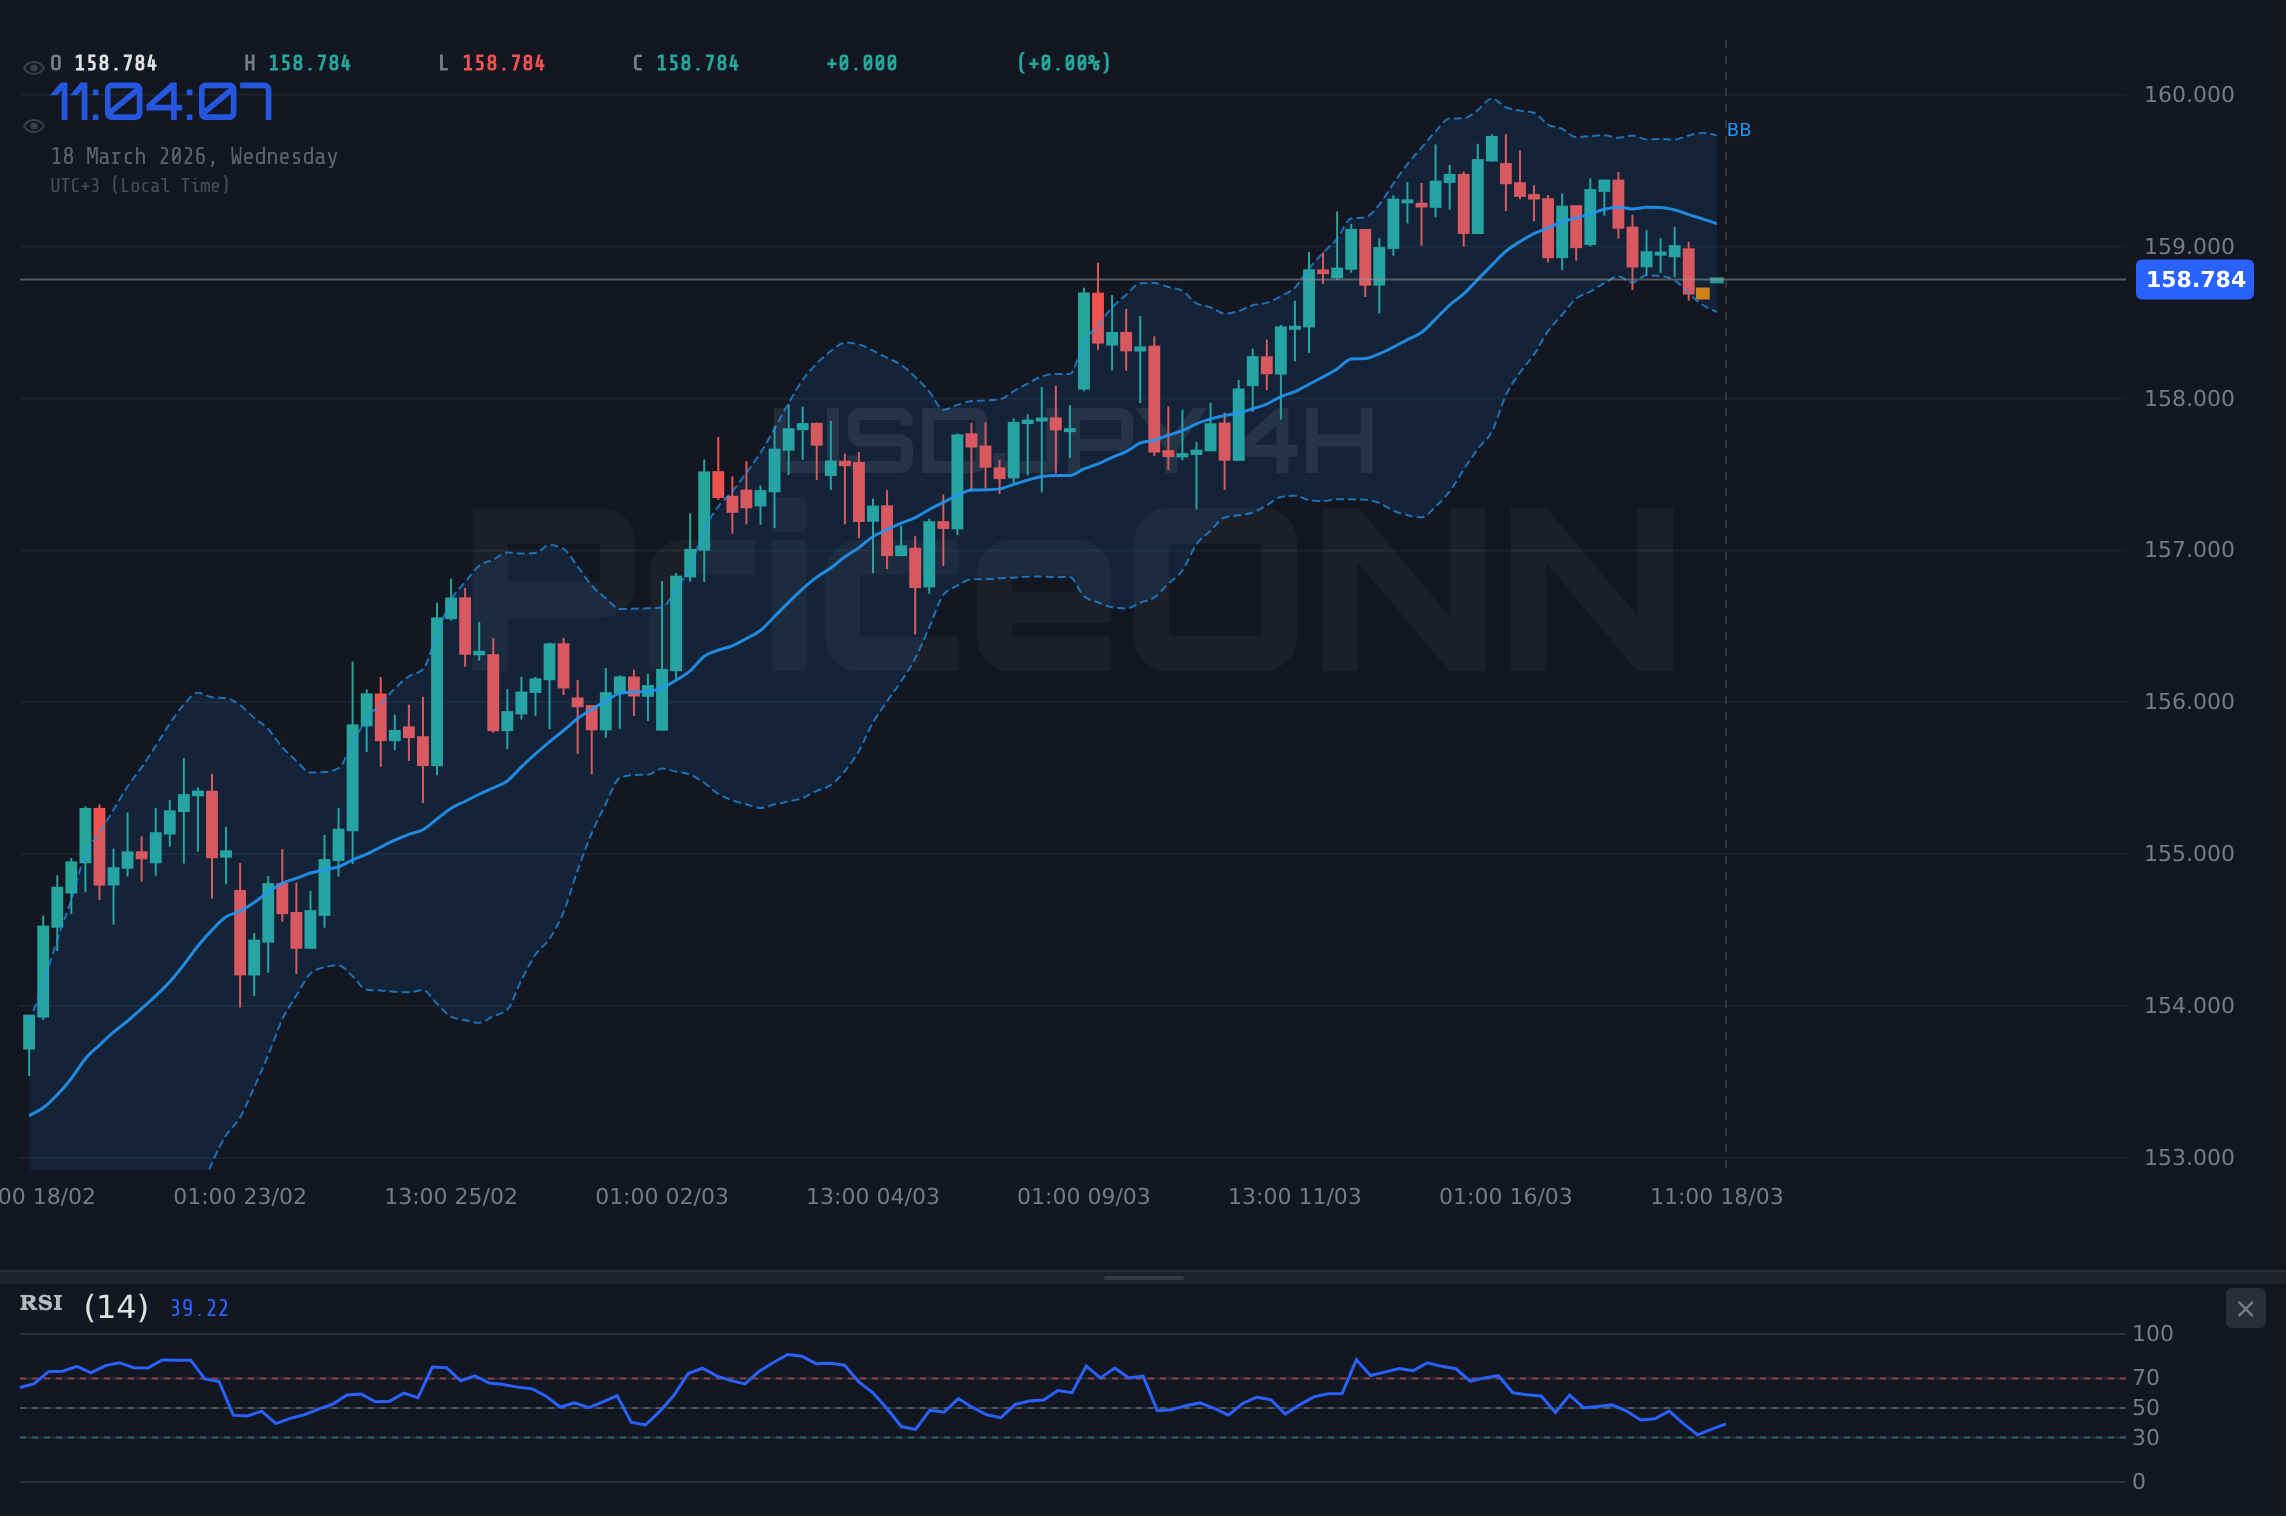
The currency markets are rarely static, and the USDJPY pair is currently at a crucial crossroads. Having experienced a significant upward trend, the pair is now facing a period of consolidation and, more importantly, testing key support levels. At $158.82, this isn't just another price point; it represents a level where previous buying interest emerged, making it a psychologically significant area. The tension between the bulls, hoping to defend this floor and resume the uptrend, and the bears, aiming to push through and extend the recent pullback, is palpable. Understanding the nuances of the technical indicators across different timeframes is paramount to deciphering which side might be gaining the upper hand.
The data paints a mixed picture, which is precisely why this level is so critical. On the shorter timeframes, like the 1-hour and 4-hour charts, the signals lean towards caution or even a bearish bias. The 1-hour chart shows a downward trend with an ADX of 29.45, indicating a reasonably strong bearish momentum. Similarly, the MACD is below its signal line, and the Stochastic is giving a sell signal. However, the daily chart introduces a different narrative. While the ADX at 13.43 suggests a generally weak trend on the daily timeframe, meaning less conviction behind any move, the RSI at 46.52, despite being in neutral territory and showing a slight downward tendency, is forming a subtle bullish divergence. This means that as price has been making lower lows or consolidating, the RSI might be making higher lows, often a precursor to a potential reversal or at least a stabilization.
The Bull Case: Betting on Divergence and Daily Support
For the bulls, the argument hinges on the resilience of the $158.82 support level and the nascent signs of strength on the daily chart. Historically, price action around this figure has seen buyers step in, and the current setup might be no different. The daily RSI, currently at 46.52, is hovering in a neutral zone but is showing signs of divergence. This divergence, where price action might be weak or trending down slightly, but the oscillator is starting to climb, is often interpreted as a sign that the selling pressure is exhausting. If this daily RSI divergence plays out, we could see a stabilization around $158.82, followed by a move higher.
Furthermore, the 4-hour chart, despite its overall bearish leanings, does show some conflicting signals. The Stochastic, for instance, is in the oversold territory and showing a potential crossover, which could precede a bounce. Even the 1-hour chart, while predominantly bearish, has a Stochastic that is moving upwards from lower levels, suggesting that short-term bounces are possible. The key for the bulls is to see a firm hold above $158.82, ideally followed by a decisive break above the immediate resistance at $158.823. A daily close above this level would be a significant confirmation, signaling that the short-term bearish pressure is subsiding and that the pair is ready to re-test higher grounds, potentially targeting the $159.395 resistance level.
The broader market context also offers some support for a USDJPY bounce. While the DXY is currently strong at 99.39, its own daily chart shows a somewhat mixed picture with ADX at 34.21 suggesting a strong trend but Stochastic showing a potential dip. If the DXY falters slightly or consolidates, it could provide some breathing room for USDJPY. The fact that the daily trend strength for USDJPY is only 50% suggests that the market is currently indecisive on the larger timeframe, making a bounce from a key support level a more plausible scenario than a sharp breakdown.
The Bear Case: Momentum and Macro Headwinds
On the flip side, the bears have compelling arguments, primarily rooted in the momentum seen on the shorter timeframes and the persistent strength of the US Dollar. The 1-hour and 4-hour charts are flashing clear bearish signals. The 1-hour trend is decidedly downwards, supported by an ADX of 29.45, indicating a solid trend. The MACD is below its signal line, and the Stochastic is giving a sell signal, all pointing towards further downside pressure. If USDJPY fails to hold $158.82, the next logical target would be the 4-hour support at $158.608, followed by $158.494. Breaking below these levels would significantly increase the probability of a deeper correction.
The daily chart, despite the RSI divergence, also presents challenges for the bulls. The ADX at 13.43 signifies a weak trend, meaning that even if a bounce occurs, it might lack the strength to sustain significant upward momentum. Moreover, the Dollar Index (DXY) is currently showing strength, trading at 99.39 and with a strong daily uptrend signal. A stronger dollar typically exerts downward pressure on USDJPY, making it harder for the pair to rally unless there are specific JPY-weakening factors at play. The current market sentiment, as indicated by the SP500's upward move (6750.4) and Nasdaq's rise (24939.74), suggests a risk-on environment, which might normally favor USDJPY, but the dollar's own strength is a counteracting force.
The technical indicators on the daily timeframe, apart from the RSI divergence, are not exactly screaming 'buy'. The MACD is showing negative momentum, and the Bollinger Bands are suggesting a bearish bias by keeping the price below the middle band. Stochastic, while potentially giving a buy signal as %K crosses above %D, is still in oversold territory, indicating that the downward momentum could continue before any significant rebound. The bears' primary objective is to see a decisive break below $158.82, followed by a failure to reclaim it. If this happens, the path towards the next daily support at $158.619, and potentially lower, becomes much clearer.
The Verdict: A Watch Zone Requiring Patience
Given the conflicting signals across different timeframes and the current market structure, USDJPY is entering a critical 'watch zone'. The ADX readings, particularly the weak trend on the daily chart (ADX: 13.43) and the moderate strength on the 1-hour chart (ADX: 29.45), indicate that the market lacks strong conviction. This choppiness makes any trade plan inherently risky without further confirmation. The current price of $158.82 acts as a crucial inflection point.
For a valid bullish setup to emerge, we need to see USDJPY decisively hold above the $158.82 support. This would ideally be confirmed by a daily close above this level, or at least a sustained bounce that pushes the price towards the immediate 1-hour resistance at $158.823 and then the 4-hour resistance at $159.156. The bullish RSI divergence on the daily chart would then gain more credibility. Conversely, a breakdown below $158.82, followed by a failure to reclaim it, would strengthen the bearish case, opening the door for a move towards the $158.608 support level. Until one of these scenarios plays out with greater conviction, patience is the optimal strategy. Managing risk and waiting for a clearer directional signal will be key for any trader looking to engage with USDJPY at these levels.
The interplay between the dollar's strength, the Bank of Japan's policy stance (or lack thereof), and broader risk sentiment will continue to dictate the direction. While the technical picture is currently ambiguous, the market always provides opportunities. The $158.82 level is where the next chapter will be written, and observing how price reacts here will be more informative than any indicator alone. For now, it's a waiting game, but one that could offer significant rewards for those who heed the signs.
Frequently Asked Questions: USDJPY Analysis
What happens if USDJPY breaks below the $158.82 support level?
If USDJPY closes decisively below $158.82, the bearish case strengthens significantly. The next key support level to watch would be S1 at $158.619, followed by $158.279. A break below these levels would indicate further downside potential, driven by stronger selling momentum.
Should I buy USDJPY at current levels around $158.82 given the RSI at 46.52?
Buying at $158.82 is a high-risk strategy due to conflicting short-term signals. While the daily RSI divergence (46.52) suggests potential, the 1-hour and 4-hour charts show bearish momentum. A confirmation, such as a daily close above $158.82 or a clear break of immediate resistance at $158.823, would be needed to validate a bullish entry with higher probability.
Is the RSI at 46.52 a sell signal for USDJPY right now?
An RSI of 46.52 on the daily chart is not a direct sell signal; it sits in neutral territory. While it shows a slight downward tendency, the potential bullish divergence is more significant. On shorter timeframes, however, indicators like the 1-hour Stochastic are giving sell signals, suggesting downward pressure could persist in the very short term.
How will the DXY strength at 99.39 affect USDJPY this week?
The DXY's strength at 99.39 typically exerts downward pressure on USDJPY, as a stronger dollar makes yen-denominated assets relatively more expensive. However, the DXY's own daily trend strength is only moderate (ADX: 34.21), suggesting it might consolidate. If the DXY pulls back slightly, it could provide USDJPY with room to bounce from its current support.
Technical Outlook Summary
| Indicator | Value | Signal | Interpretation |
|---|---|---|---|
| RSI (14) | 46.52 | Neutral | Potential bullish divergence on daily; slight downtrend. |
| MACD Histogram | -0.139 | Bearish | Negative momentum on daily, below signal line. |
| Stochastic | K=34.06, D=26.2 | Bullish | Daily crossover from oversold; 1H/4H also showing upward movement. |
| ADX | 13.43 | Weak Trend | Daily trend lacks conviction, suggesting range-bound conditions. |
| Bollinger Bands | Middle Band | Watch | Price below middle band on daily, indicating bearish pressure. |
Track markets in real-time
AI-powered analysis, technical indicators and real-time price data.
Join Our Telegram Channel
Breaking market news, AI analysis and trading signals instantly.
Join Channel