EURUSD Dips to $1.15775: Can Support Hold Amidst Fed Uncertainty?
EURUSD sees a sharp dip to $1.15775. With RSI at 45.12 and ADX strong, traders eye key support levels. Is this a setup for a bounce or further decline?
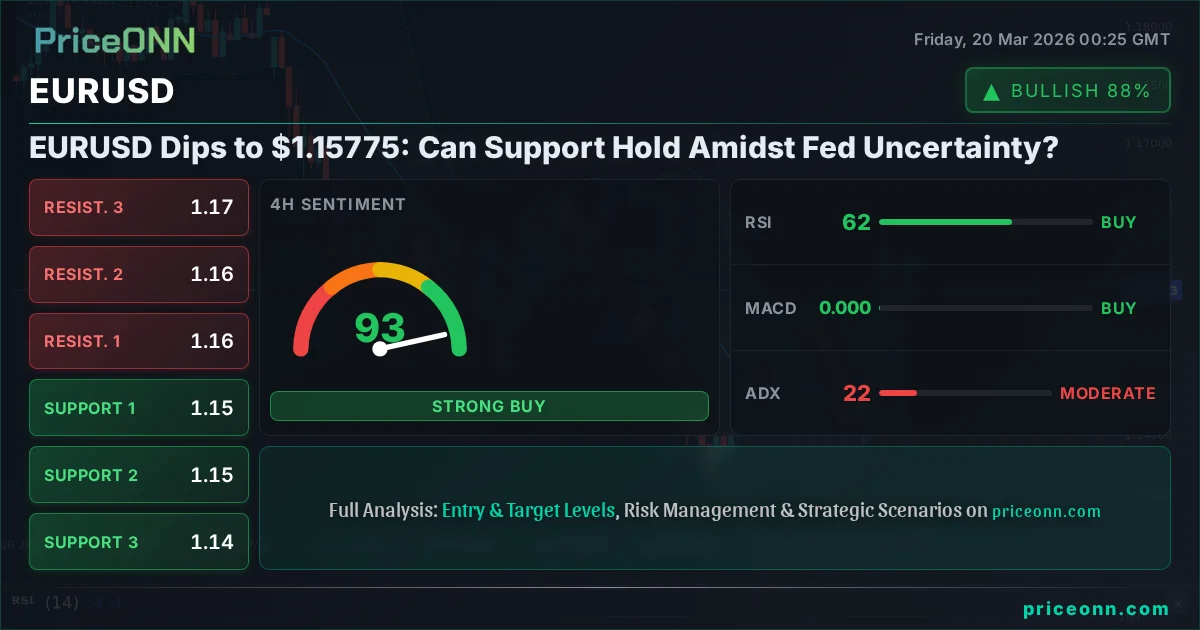
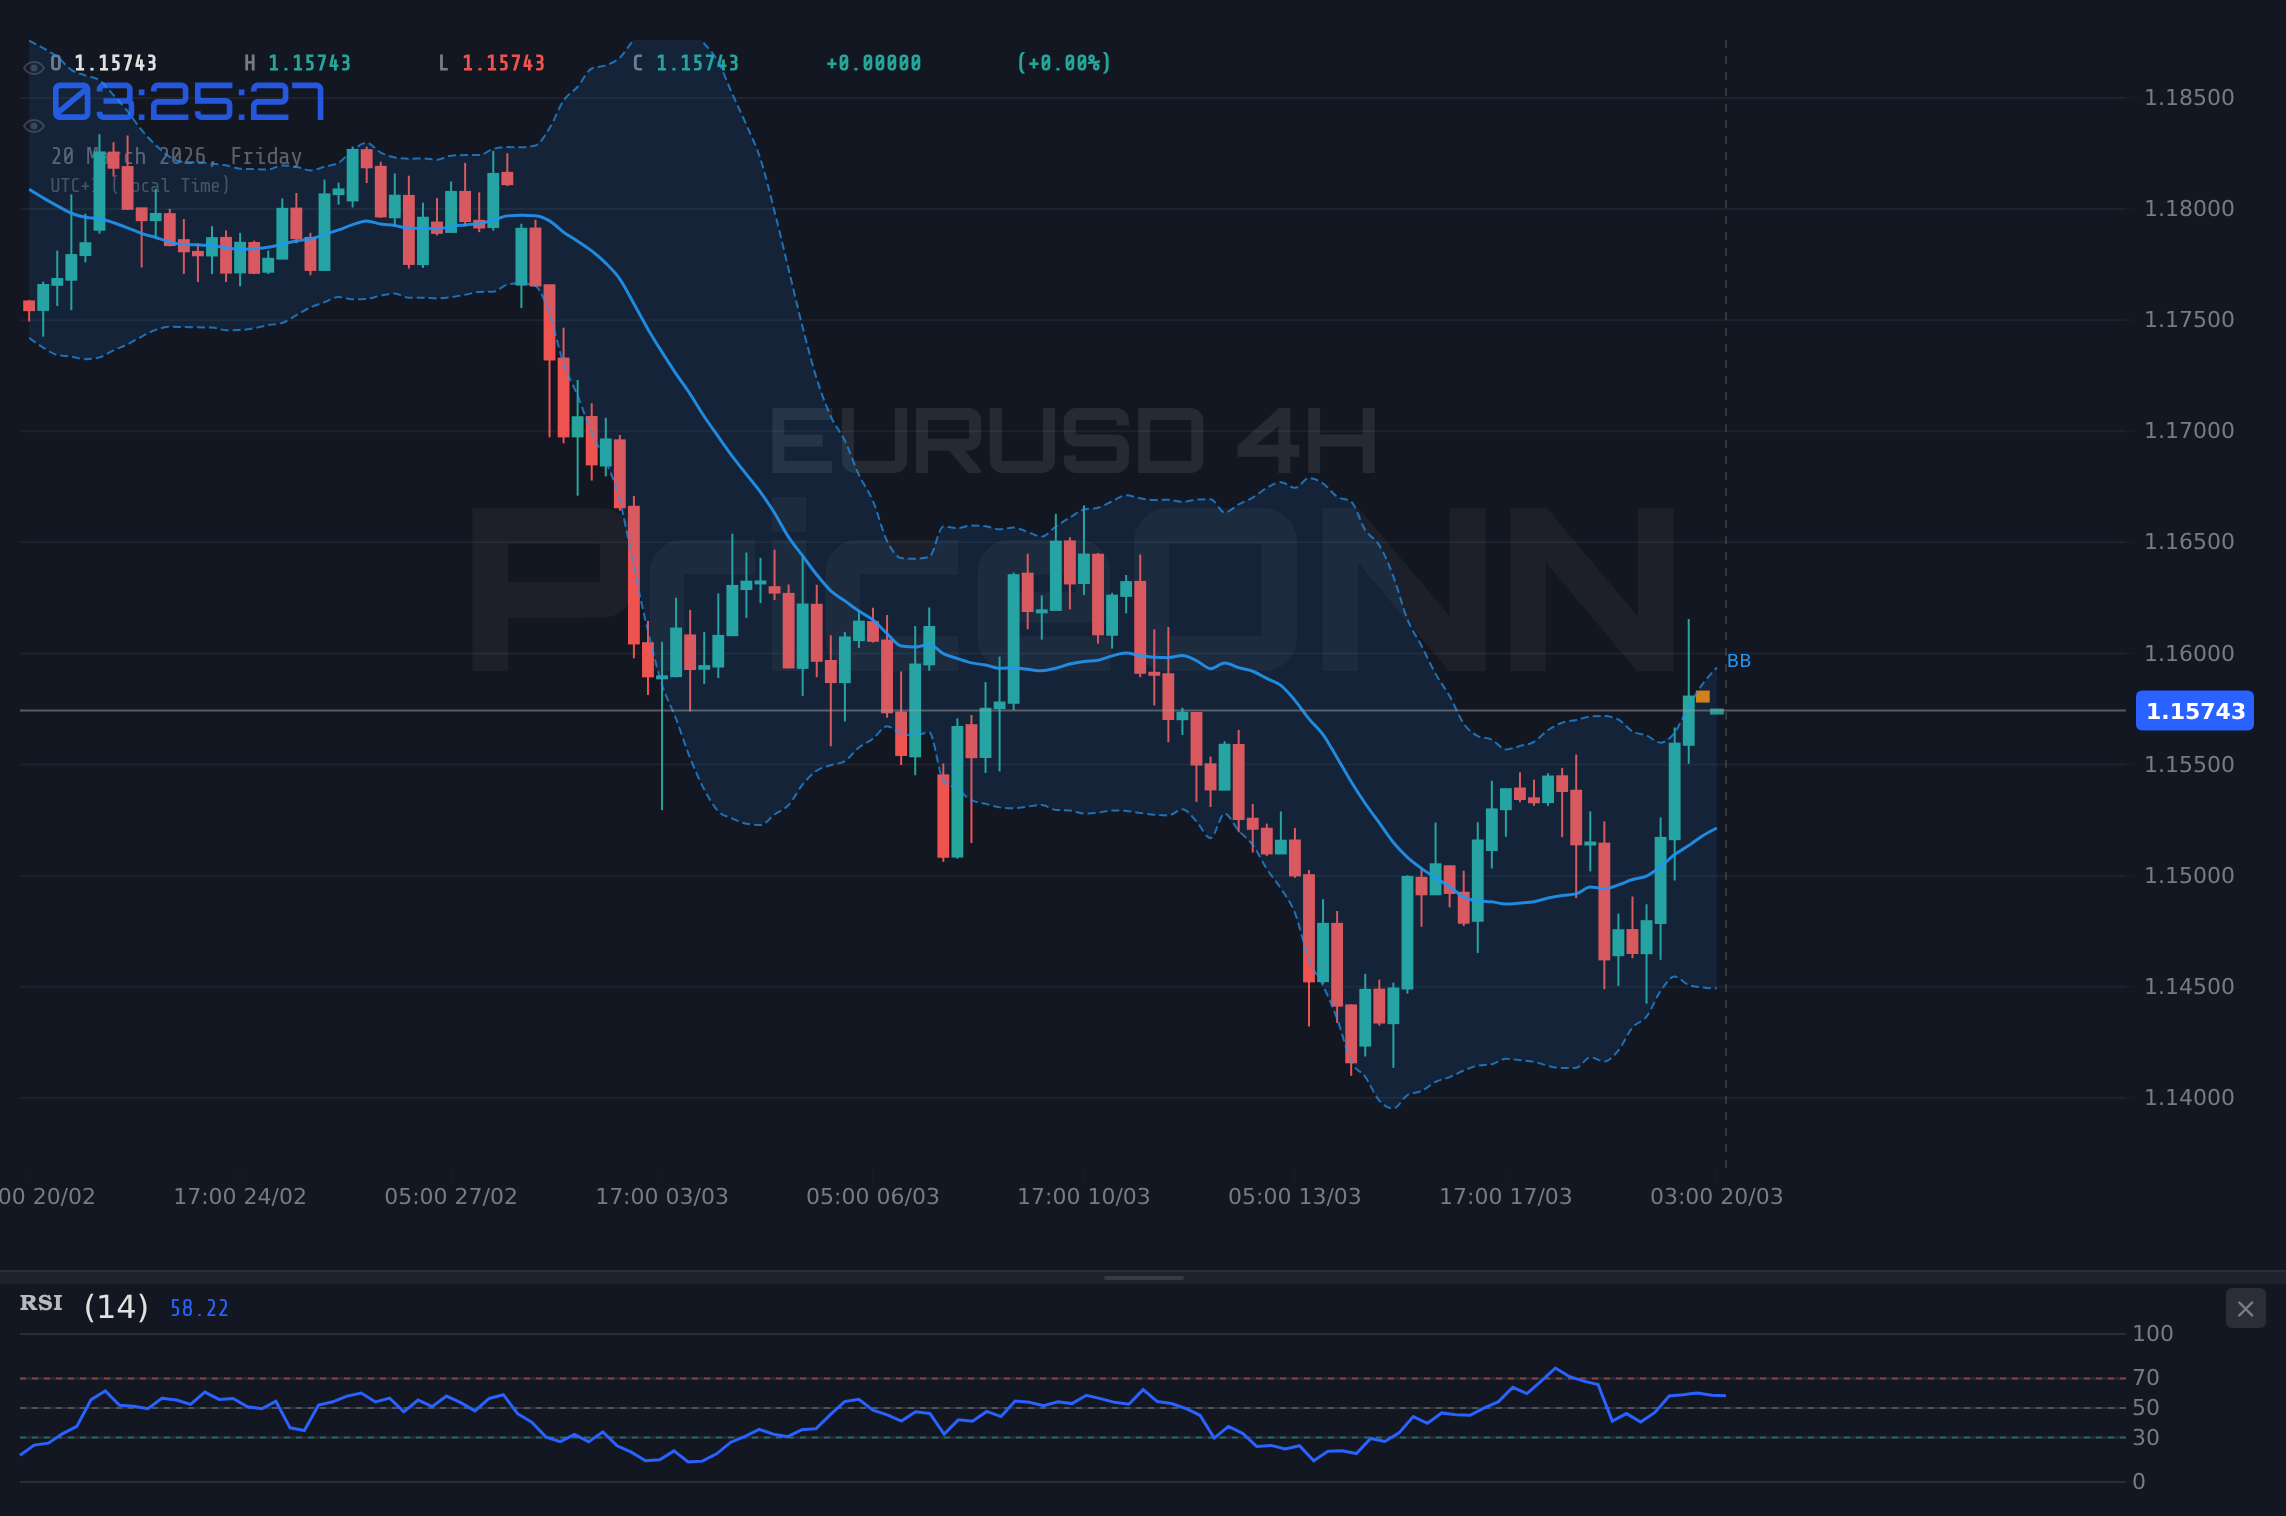
EURUSD is currently trading at $1.15775, marking a notable dip from recent highs. This move comes as traders digest mixed signals from the global economic landscape, particularly concerning Federal Reserve policy expectations and ongoing geopolitical tensions. The pair has experienced a significant daily change of -1.01%, settling $0.01152 lower. While the 1-hour chart shows a bullish trend with an ADX of 40.3, the daily timeframe presents a more complex picture with a strong downtrend (ADX 37.45) and RSI hovering at 45.12, suggesting a cautious approach is warranted. This analysis delves into the technical indicators, key price levels, and market sentiment to understand the potential path forward for EURUSD.
- EURUSD currently trades at $1.15775, experiencing a daily decline of 1.01%.
- Critical support for EURUSD is identified at $1.15716, with further levels at $1.15656 and $1.15544.
- The daily RSI at 45.12 suggests a bearish lean, while the 1-hour ADX at 40.3 indicates a strong trend is in play.
- Geopolitical tensions and shifting Fed rate expectations are influencing EURUSD, creating correlation with DXY's movements.
The recent slide in EURUSD brings its price back towards significant support zones, prompting a closer look at the technical landscape. On the 1-hour chart, the trend is decidedly bullish with a strong ADX of 40.3, suggesting momentum is on the rise. However, the Relative Strength Index (RSI) at 70.51 on this timeframe signals an overbought condition, hinting that the upward momentum might be losing steam and a pullback could be imminent. This divergence between the trend strength and the overbought RSI creates an immediate point of tension for intraday traders. The Stochastic Oscillator, with K at 70.08 and D at 83.08, also shows a bearish signal (%K < %D), reinforcing the idea that the short-term upward move might be due for a correction.
Diving deeper into the 4-hour timeframe, the trend shifts to neutral, with the ADX at a moderate 21.92. Here, the RSI sits at a more comfortable 61.9, indicating a healthy bullish tendency without extreme overbought conditions. The MACD is showing positive momentum, and the Bollinger Bands suggest an upward trend. However, the Stochastic Oscillator is in strongly overbought territory at K=80.17, which could foreshadow a reversal or consolidation. This mixed picture across different short-term timeframes highlights the importance of carefully observing price action around key levels. The market sentiment appears to be grappling with conflicting forces, making precise entry and exit points crucial for navigating this period.
Now, let's consider the daily chart, which paints a more bearish picture for EURUSD. The trend is firmly downwards, confirmed by a strong ADX of 37.45. The RSI is currently at 45.12, sitting in neutral territory but leaning towards bearish, indicating that sellers have a slight edge. The MACD is showing negative momentum, and the Bollinger Bands are positioned below the middle band, suggesting a bearish bias. The Stochastic Oscillator is also showing a bearish signal with K at 45.15 and D at 24.89. This daily perspective suggests that while short-term bounces might occur, the larger trend remains against the bulls, making any rallies a potential opportunity for sellers to re-enter the market at better prices.
Navigating the Support and Resistance Labyrinth
Understanding the critical price levels is paramount for any EURUSD trader right now. On the 1-hour chart, immediate support is found at $1.15716. A break below this level could quickly lead to the next support at $1.15656, and potentially further down to $1.15544. These levels represent areas where buying interest has historically emerged, but a decisive break could signal a shift in short-term sentiment. On the resistance side for the 1-hour timeframe, we're looking at $1.15888, followed by $1.16000, and then $1.16060. These are the immediate hurdles bulls need to clear to regain control in the short term.
Moving to the 4-hour chart, the support structure becomes more defined. The first significant support level is at $1.15159. Below that, we have $1.14724, and a more substantial test at $1.14470. These levels are crucial for determining the medium-term trend. On the upside, resistance is seen at $1.15848, $1.16102, and potentially $1.16537. A sustained move above these resistance points would signal a potential reversal of the current bearish sentiment on the daily chart, opening up further upside potential.
The daily chart presents even more critical levels. Support is located at $1.14226, $1.13830, and a more significant level at $1.13170. These are the areas where a larger trend change might be initiated or where a significant bounce could originate if the bearish momentum falters. Resistance on the daily chart is situated at $1.15282, $1.15942, and $1.16338. A clear break and hold above the $1.15282 resistance level could be the first sign of strength for EURUSD, potentially invalidating the bearish outlook on this timeframe.
The Dollar's Shadow: DXY Correlation
The DXY, or Dollar Index, plays a crucial role in the EURUSD's price action. Currently, the DXY is at 99.07, showing a slight bearish trend on the 1-hour chart (ADX 33.59) and a neutral stance on the 4-hour chart (ADX 21.58), but a strong bullish trend on the daily chart (ADX 34.58). This divergence highlights market indecision regarding the dollar's immediate direction. Generally, a strengthening dollar (rising DXY) tends to put pressure on EURUSD, leading to price declines. Conversely, a weakening dollar often supports EURUSD. Given the DXY's mixed signals across timeframes, its influence on EURUSD remains a key factor to monitor. The current price action shows EURUSD dipping despite a slightly weaker dollar on the 1-hour and 4-hour charts, suggesting other factors, like European Central Bank (ECB) policy outlook, might be temporarily outweighing dollar strength.
The market is keenly watching the Federal Reserve for any hints about future monetary policy. Recent commentary has dampened expectations for rate cuts in 2026, which would typically support the dollar. However, the ECB is also facing its own set of challenges, including inflation concerns and economic growth outlooks in the Eurozone. The recent news about potential rate holds from the SNB, BoE, and ECB suggests a period of policy stability, but communication from central bank officials remains critical. Any hawkish remarks from the Fed could further strengthen the dollar and push EURUSD lower, while dovish signals from the ECB could provide some respite for the pair.
Putting It All Together: The Trade Stance
Considering the data, the EURUSD presents a complex trading environment. The daily chart's bearish trend and RSI at 45.12 suggest that the path of least resistance is downwards. However, the 1-hour chart's bullish momentum and the 4-hour chart's neutral stance indicate potential for short-term bounces or consolidation. This creates a 'trading range' scenario where price might oscillate between key support and resistance levels.
For traders looking to capitalize on the downside, the key would be a decisive break below the $1.15716 support level on the 1-hour chart. Confirmation would come from a subsequent failure to reclaim this level and a continued move towards the $1.15159 support on the 4-hour chart. The bearish signals from the daily RSI and MACD would then be validated, aligning all timeframes for a potential downtrend continuation. Conversely, for those anticipating a bounce, holding the $1.15716 support is crucial. A move back above the $1.15888 resistance on the 1-hour chart, followed by a break of the $1.15942 daily resistance, would be needed to signal a potential reversal. The confirmation would come from an RSI moving above 50 and MACD turning positive on the daily chart.
Given the current technical setup, characterized by a strong daily downtrend but conflicting signals on shorter timeframes, a cautious approach is advised. The immediate focus remains on the $1.15716 support. A break below this level could trigger further downside, while holding it might lead to a temporary consolidation or a short-covering rally. The interplay between dollar strength, Fed policy expectations, and ECB's stance will be critical in determining the next significant move.
Bearish Scenario: Testing Lower Ichs
65% ProbabilityNeutral Scenario: Consolidation Play
25% ProbabilityBullish Scenario: Reversal Attempt
10% ProbabilityUpcoming economic events, such as central bank communications and key inflation data, could introduce significant volatility. Traders should exercise caution and manage risk appropriately, considering stop-loss orders and position sizing.
EURUSD Macroeconomic Factors in 2026
The macroeconomic landscape for EURUSD in 2026 is shaped by a complex interplay of global economic forces. On the one hand, the Federal Reserve's stance on interest rates remains a dominant factor. Recent commentary has signaled a potential delay in rate cuts, which typically strengthens the US dollar and exerts downward pressure on EURUSD. This expectation is reflected in the DXY's daily bullish trend, even amidst short-term fluctuations. The market is now pricing in a less dovish outlook from the Fed, influencing currency valuations across the board. Investors are closely monitoring Fed officials' speeches and economic data releases for further clues on the timing and pace of potential policy shifts.
On the other side of the Atlantic, the Eurozone economy faces its own set of challenges and opportunities. While inflation concerns persist, the European Central Bank (ECB) is also navigating the complexities of economic growth and employment. The SNB, BoE, and ECB are all expected to maintain current interest rates, suggesting a period of policy convergence or at least stability. However, the communication from these central banks will be pivotal. Any hints of a shift towards a more accommodative stance by the ECB could provide support for the Euro, potentially counteracting dollar strength and influencing EURUSD price action. The ongoing geopolitical situation, particularly in the Middle East, adds another layer of uncertainty, impacting energy prices and global trade, which in turn can affect inflation expectations and central bank responses.
The correlation between EURUSD and macroeconomic factors is dynamic. For instance, a stronger-than-expected US employment report or higher inflation figures could reinforce the Fed's hawkish stance, leading to a stronger dollar and a lower EURUSD. Conversely, signs of economic weakness in the US or a more hawkish tone from the ECB could bolster the Euro. The Australian Financial Review's recent focus on EURUSD forecast for March 2026 highlights the global interest in this currency pair's trajectory. Traders are actively seeking clarity on these macroeconomic drivers to position themselves effectively. The current technical setup, with EURUSD hovering near key support, makes these fundamental undercurrents even more critical in dictating the next significant price move.
Frequently Asked Questions: EURUSD Analysis
What happens if EURUSD breaks below the $1.15716 support level?
A break below $1.15716 on EURUSD would invalidate the short-term bullish setup and likely trigger further downside towards the $1.15159 support level. The daily chart's bearish bias would be confirmed, potentially leading to a move towards $1.14724.
Should I consider buying EURUSD at current levels around $1.15775 given the RSI at 45.12?
Buying at current levels requires caution. While the 1-hour chart shows bullish momentum, the daily RSI at 45.12 and ADX at 37.45 suggest a bearish trend. A confirmation of support holding at $1.15716, with a bounce towards $1.15888, would be a more prudent entry condition, offering a better risk-reward ratio.
Is the daily RSI at 45.12 a strong sell signal for EURUSD?
An RSI of 45.12 is not an extreme oversold or overbought condition, but it leans bearish, indicating that sellers have a slight advantage. It suggests a potential for further downside or consolidation rather than an immediate strong sell signal. Confirmation from MACD and price action is needed.
How might the ECB's expected rate hold affect EURUSD in the coming week?
If the ECB holds rates as expected and maintains a cautious tone, it might offer some support to EURUSD, especially if the Fed continues to signal a hawkish stance. However, the overall market sentiment and dollar strength will also play a significant role. Traders will look for any forward guidance from the ECB that could impact the pair.
| Indicator | Value | Signal | Interpretation |
|---|---|---|---|
| RSI (14) | 45.12 | Neutral | Leaning bearish, indicating slight seller advantage. |
| MACD Histogram | -0.003 | Bearish | Negative momentum suggests downward pressure. |
| Stochastic Oscillator | K:45.15, D:24.89 | Bullish signal (%K > %D) | Suggests potential short-term upward move or consolidation. |
| ADX | 37.45 | Strong Trend | Indicates a strong established trend (bearish on daily). |
| Bollinger Bands | Below Middle Band | Bearish | Price below the middle band suggests bearish momentum. |
Track markets in real-time
AI-powered analysis, technical indicators and real-time price data.
Join Our Telegram Channel
Breaking market news, AI analysis and trading signals instantly.
Join Channel