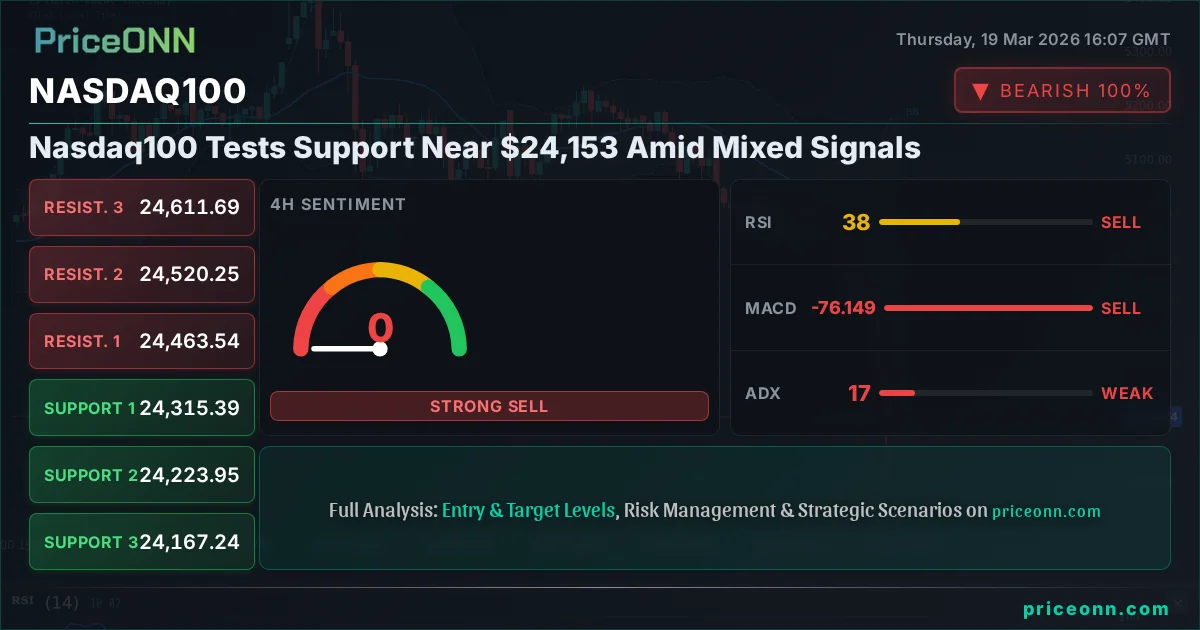
Nasdaq100 Tests Support Near $24,153 Amid Mixed Signals
Nasdaq100 hovers around $24,153, with RSI at 37 and ADX at 17. Bulls eye a rebound, while bears watch for a breakdown below key support.
The Nasdaq100 is currently navigating a critical juncture, hovering precariously near the $24,153 support level. This pivotal area represents a battleground where bulls and bears are locked in a tense standoff, with technical indicators flashing mixed signals. Understanding the nuances of this technical setup is paramount for traders seeking to navigate the choppy waters of the tech-heavy index. The question on many traders' minds is whether this support will hold, paving the way for a potential recovery, or if the bears will seize control and push the index lower. With the ADX reading at a subdued 17, the market is clearly in a consolidation phase, meaning that a decisive move is yet to materialize, and caution is the prevailing sentiment.
- The Nasdaq100 is testing support around $24,153, with the RSI indicator at 37, suggesting a neutral to slightly bearish momentum.
- The ADX reading of 17 indicates a weak trend, pointing towards consolidation rather than a strong directional move.
- A daily close above resistance at $24,794.44 would be needed to signal a bullish reversal, while a break below support at $23,512.44 could trigger further declines.
- Correlation with the DXY, currently at 99.42, suggests that dollar strength could continue to weigh on the Nasdaq100 if it persists.
The current market sentiment surrounding the Nasdaq100 is one of cautious observation. The index has experienced significant volatility, and traders are keenly watching key technical levels to gauge the next likely direction. This analysis delves into the intricate details of the Nasdaq100's current technical posture, examining multiple timeframes to paint a comprehensive picture. We will explore the arguments for both a potential bullish resurgence and a bearish continuation, underpinned by the latest market data. The interplay between risk appetite, as indicated by broader equity indices like the S&P 500, and the strength of the US Dollar, represented by the DXY, will also be crucial in understanding the forces shaping the Nasdaq100's trajectory. The ongoing debate about central bank policies, particularly the Federal Reserve's stance on interest rates, continues to be a significant macro driver influencing market sentiment and risk assets.
The Bullish Case: A Potential Rebound from Key Support
From a bullish perspective, the Nasdaq100 is approaching a significant support zone that has historically offered buying opportunities. The $24,153 level, along with subsequent support at $23,926.44 and $23,512.44, represents a confluence of technical indicators that could spark a reversal. On the 1-hour chart, the Stochastic indicator is showing a bullish signal with %K at 54.22 and %D at 37.07, suggesting that the index is moving out of oversold territory and could be poised for an upward correction. While the RSI(14) at 37.05 on the 1-hour chart is not yet indicating an oversold condition, it is far from extreme levels, leaving room for a potential bounce. The MACD on the 1-hour chart, while showing negative momentum, is positioned above its signal line, which could be interpreted as a precursor to a bullish crossover if buying pressure intensifies.
The 4-hour chart presents a slightly more nuanced picture. The Stochastic is in the oversold region with K=14.84 and D=22.94, hinting at a potential bounce. However, the RSI(14) at 37.49 still leans towards bearish momentum, and the MACD histogram is negative. The ADX on the 4-hour chart is 16.92, indicating a weak trend, which supports the idea of a ranging market or a potential reversal if strong buying emerges. The daily chart, while showing a bearish trend with RSI at 35.37, also has Stochastic readings of K=23.08 and D=32.74, which are approaching oversold levels. This suggests that while the overall trend is down, there might be a short-term opportunity for a technical bounce from these lower levels. For bulls, the key is to see a sustained hold above the $24,153 support. A daily close above the nearest resistance at $24,334.51 would be the first sign of strength, but a more convincing bullish signal would require breaking through the $24,794.44 resistance level.
The Bearish Case: Pressure Mounts on Nasdaq100
The bearish argument is compelling, primarily driven by the overall downward trend observed across multiple timeframes and the prevailing risk-off sentiment in the broader market. On the daily chart, the Nasdaq100 is firmly in a downtrend, with the RSI(14) at 35.37 indicating bearish momentum. The MACD is below its signal line, and the histogram is negative, reinforcing the bearish outlook. The Stochastic is also showing a bearish signal with K=23.08 and D=32.74, suggesting further downside potential. The ADX at 42.88 on the daily chart signifies a strong downtrend, underscoring the conviction of sellers in the market.
The 1-hour and 4-hour charts further support the bearish narrative. On the 1-hour chart, the ADX is a strong 45.43, indicating a powerful downtrend. The RSI at 37.05 and MACD's negative momentum reinforce this. Similarly, the 4-hour chart shows a bearish trend with RSI at 37.49 and negative MACD momentum. The Stochastic readings on both the 1-hour (K=54.22, D=37.07) and 4-hour (K=14.84, D=22.94) charts present a slight divergence, with the 1-hour showing a potential bounce, but the 4-hour signaling further weakness. However, the overriding signal from the daily timeframe is one of significant downward pressure. The critical support level to watch is $24,153. A decisive break and close below this level on the daily chart would likely trigger a cascade of selling, targeting the subsequent support levels at $23,926.44 and potentially $23,512.44. The increasing strength of the DXY, currently at 99.42, adds another layer of pressure, as a stronger dollar typically correlates with weaker risk assets like the Nasdaq100.
Technical Battleground: Indicators and Levels in Focus
The technical indicators present a conflicting yet revealing picture. On the 1-hour timeframe, the Stochastic is showing a bullish divergence, suggesting a potential short-term bounce. However, this is contradicted by the RSI(14) at 37.05 and the MACD's negative momentum, which point towards continued weakness. The ADX at 45.43 on this timeframe confirms a strong existing downtrend, implying that any bounce might be short-lived. Moving to the 4-hour chart, the Stochastic (K=14.84, D=22.94) is in oversold territory, hinting at a possible reversal, but the RSI(14) at 37.49 and negative MACD momentum suggest caution. The ADX here is weaker at 16.92, indicating less conviction in the trend.
The daily timeframe provides the most significant signals. The RSI(14) at 35.37 is in the neutral-to-bearish zone, not yet oversold but showing signs of exhaustion. The MACD is deeply negative, and the Stochastic (K=23.08, D=32.74) is approaching oversold conditions. Crucially, the ADX at 42.88 on the daily chart signifies a strong downtrend. This confluence of factors suggests that while there might be short-term fluctuations, the dominant trend remains bearish. The key levels to monitor are clear: support at $24,153, followed by $23,926.44 and $23,512.44. Resistance is faced at $24,334.51, then $24,794.44, and further up at $25,435.44. The market is essentially waiting for a catalyst to break this stalemate, with upcoming economic data and central bank commentary likely to play a significant role.
The Role of Macro and Correlation
The Nasdaq100's performance is intrinsically linked to broader macroeconomic trends and market correlations. The US Dollar Index (DXY), currently trading at 99.42, plays a crucial role. Historically, a strengthening dollar tends to put downward pressure on US equities, including the Nasdaq100, as it makes dollar-denominated assets more expensive for foreign investors. The current DXY level, while slightly off its highs, still indicates a dollar that is holding its ground, which could continue to act as a headwind for the index. Any sustained rally in the DXY would likely exacerbate the selling pressure on the Nasdaq100.
Furthermore, the correlation with broader risk sentiment, often reflected in the S&P 500, is vital. With the S&P 500 currently trading around 6595.85 and showing a bearish trend on multiple timeframes, this suggests a general risk-off environment. A decline in the S&P 500 often coincides with or precedes a downturn in the more growth-oriented Nasdaq100. The current readings on the S&P 500, with its RSI at 38.22 and ADX at 46.34 on the 1-hour chart, reinforce the bearish sentiment. Investors are closely monitoring the Federal Reserve's monetary policy signals. While the Fed has held rates steady for now, projections for future rate cuts are being recalibrated, potentially leading to higher-for-longer interest rate scenarios. Such a scenario typically dampens enthusiasm for growth stocks like those dominating the Nasdaq100, as it increases borrowing costs and reduces the present value of future earnings.
Trade Scenarios: Navigating the Uncertainty
Bearish Scenario: Breakdown Below Support
65% ProbabilityNeutral Scenario: Consolidation Around Support
25% ProbabilityBullish Scenario: Bounce from Support
10% ProbabilityFrequently Asked Questions: Nasdaq100 Analysis
What happens if the Nasdaq100 breaks below the $24,153 support level?
A break below $24,153 on a daily closing basis would likely trigger further selling pressure. The next significant support levels to watch would be $23,926.44, followed by $23,512.44, as indicated by the daily chart's technical structure.
Should I consider buying the Nasdaq100 at current levels around $24,153 given the oversold Stochastic on the 4H chart?
While the 4-hour Stochastic at K=14.84, D=22.94 suggests oversold conditions, the daily trend remains bearish with RSI at 35.37. A cautious approach is advised; wait for confirmation such as a hold above $24,153 and a bullish signal on higher timeframes before considering entry.
Is the RSI at 37 a sell signal for the Nasdaq100 right now?
An RSI of 37 is generally considered neutral to bearish, indicating a lack of strong buying momentum. It's not an outright sell signal but reinforces the prevailing bearish sentiment, especially when viewed alongside other bearish indicators on higher timeframes.
How will the current DXY level of 99.42 affect the Nasdaq100 this week?
A DXY level around 99.42 suggests a relatively strong dollar, which typically exerts downward pressure on risk assets like the Nasdaq100. If the dollar continues to strengthen, it could hinder any potential recovery attempts by the index.
The Nasdaq100 is currently at a critical juncture, with the $24,153 support level acting as a key determinant of its near-term direction. While technical indicators present a mixed bag, the prevailing bearish sentiment on higher timeframes, coupled with a strong dollar and a risk-off environment, suggests that the path of least resistance may be downwards. However, the presence of oversold signals on shorter timeframes cannot be entirely ignored, hinting at the possibility of a short-term bounce. Traders must remain vigilant, closely monitoring price action around the $24,153 mark. A decisive break below this level would likely confirm the bearish scenario, while a sustained hold and subsequent move above resistance at $24,334.51 could signal a temporary reprieve. Ultimately, patience and risk management will be key as the market digests these conflicting signals and awaits further clarity from macroeconomic developments.
| Indicator | Value | Signal | Interpretation |
|---|---|---|---|
| RSI (14) | 37.05 | Neutral | Lack of strong momentum |
| MACD Histogram | - | Bearish | Negative momentum |
| Stochastic | K=54.22, D=37.07 | Bullish | Potential bounce signal |
| ADX | 45.43 | Strong Trend | Dominant downtrend (1H) |
| ADX (1D) | 42.88 | Strong Trend | Dominant downtrend (1D) |
Track markets in real-time
AI-powered analysis, technical indicators and real-time price data.
Join Our Telegram Channel
Breaking market news, AI analysis and trading signals instantly.
Join Channel