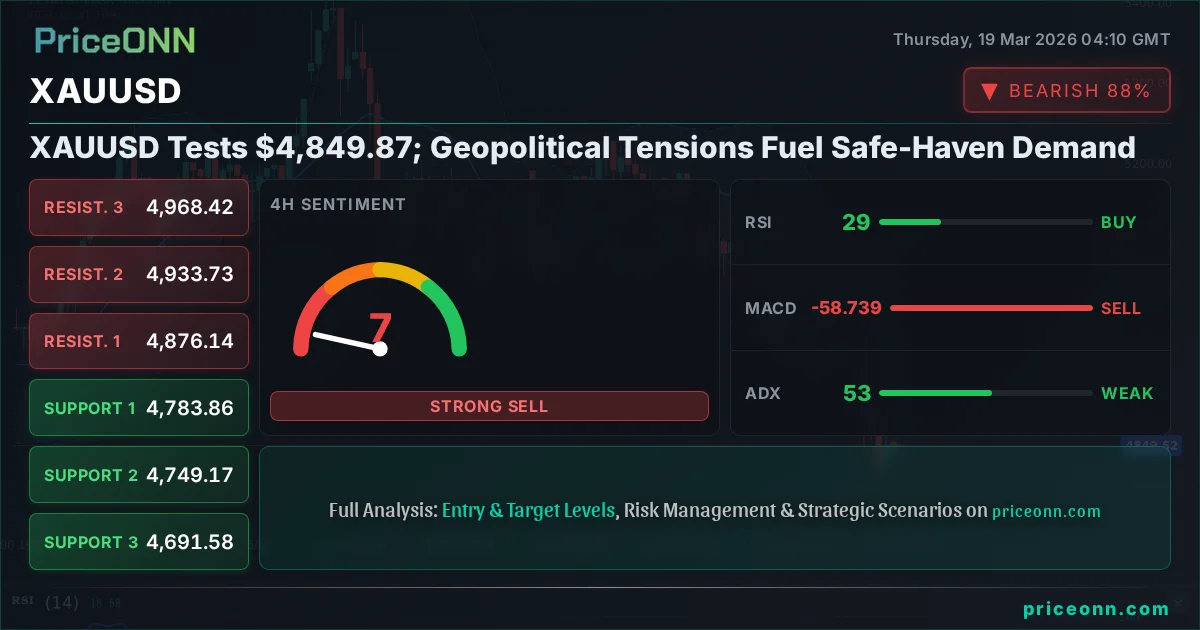
XAUUSD Tests $4,849.87; Geopolitical Tensions Fuel Safe-Haven Demand
Gold faces critical levels near $4,849.87 amid rising geopolitical risks and mixed technical signals. What's next for the precious metal?
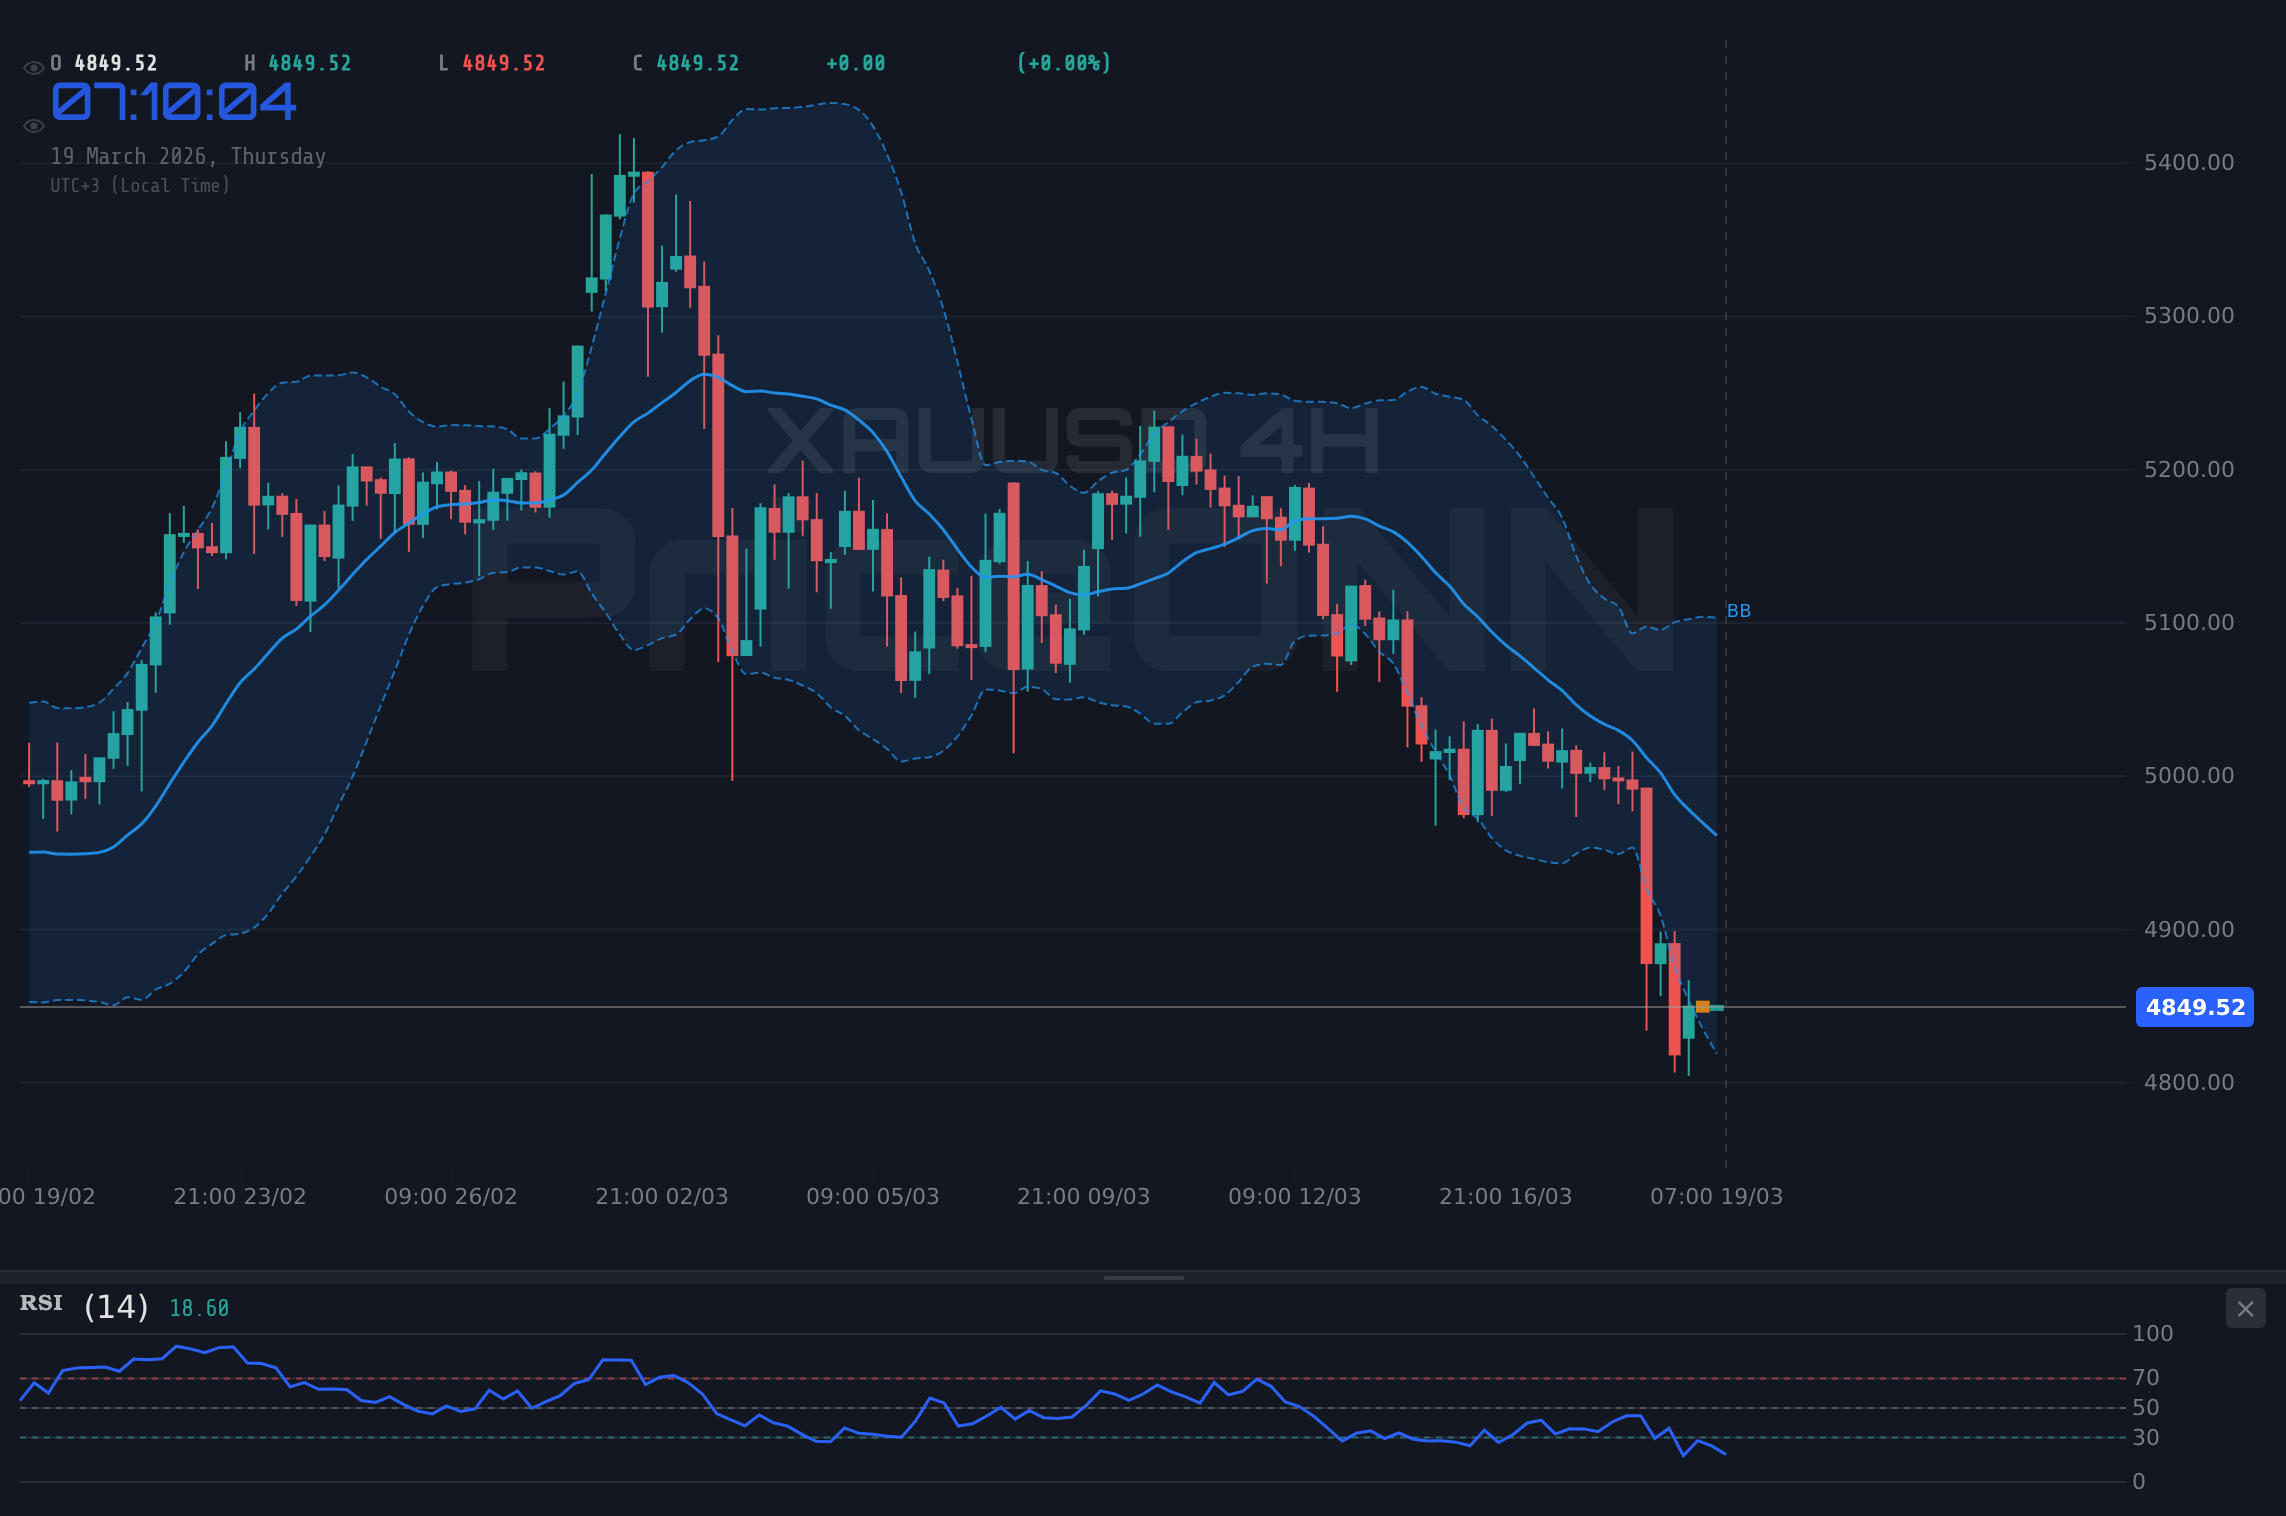
The gold market is at a pivotal juncture, with XAUUSD hovering near $4,849.87. This level, while seemingly just a number, represents a critical battleground for bulls and bears, especially as geopolitical tensions escalate and central banks navigate a complex economic landscape. Having tracked precious metals for decades, I see a confluence of factors suggesting that the current price action is more than just noise; it's a narrative unfolding that could dictate gold's trajectory in the coming weeks and months. The strength of the US Dollar, influenced by hawkish Fed signals and unexpected geopolitical events, adds another layer of complexity, often acting as a headwind for gold but sometimes failing to cap its safe-haven appeal.
- XAUUSD is trading near $4,849.87, a critical level influenced by geopolitical tensions and DXY strength.
- Critical support for gold sits at $4,744.83, tested amidst strong downward momentum signals on lower timeframes.
- RSI at 34.2 on the 1H chart and 40.96 on the 1D chart suggests room for further downside pressure before potential reversal.
- The ADX at 52.97 on the 4H timeframe indicates a very strong downtrend, suggesting caution for immediate bullish plays.
- The US Dollar Index (DXY) is showing strength around 99.93, putting pressure on gold, but geopolitical events could override this correlation.
Currently, the precious metal is trading at $4,849.87, reflecting a 0.65% daily gain of $31.31. However, looking beyond the daily upswing, the technical indicators paint a more nuanced picture. On the 1-hour chart, the trend is neutral with a power of 50%, but the RSI at 34.2 and the MACD showing positive momentum above its signal line suggest a cautious approach. The Bollinger Bands are below the middle band, indicating a bearish inclination in the short term. Stochastic, however, offers a glimmer of hope for buyers with a reading of K=50.96 and D=35.75, suggesting a potential upward signal. Yet, the ADX at 45.94 on this timeframe screams 'strong downtrend', a stark warning that the prevailing market direction is still south. This creates a tricky environment for short-term traders, where conflicting signals demand careful risk management.
Navigating the Technical Crosscurrents
Diving deeper into the technicals, the 4-hour chart presents a decidedly bearish outlook. The trend is firmly in the 'Düşüş' (Downtrend) category with a power of 100%. The RSI sits deep in oversold territory at 29.13, a level that historically can precede bounces, but the ADX at a formidable 52.97 confirms a very strong downward trend. This suggests that any upward moves might be short-lived 'bear market rallies' rather than the start of a sustained recovery. The MACD is firmly below its signal line, reinforcing the bearish momentum, and the price is hugging the lower Bollinger Band, a sign of significant selling pressure. The Stochastic is also giving a clear sell signal (%K < %D). Even though the 1-hour chart showed some conflicting signals, the 4-hour timeframe is hard to ignore; it dictates the medium-term direction for many market participants.
The daily chart, however, offers a slight reprieve from the bearishness, showing a 'Nötr' (Neutral) trend with 50% power. The RSI at 40.96 is in neutral territory, leaning towards a downtrend. The MACD remains negative, below its signal line, indicating bearish momentum persists. Bollinger Bands are again below the middle band, signaling a bearish inclination. Stochastic, at 9.02/17.15, is deeply oversold, presenting a potential buying opportunity for longer-term investors looking for value. The ADX at 15.81 is notably weak, suggesting a lack of strong trend, which can sometimes precede a significant move in either direction. This divergence between the shorter timeframes and the daily chart highlights the current market indecision and the importance of defining clear risk levels.
Geopolitical Undercurrents and the Dollar's Grip
The macroeconomic backdrop is equally crucial. The US Dollar Index (DXY) is currently trading around 99.93, showing a strong upward trend on all timeframes. A stronger dollar typically spells trouble for gold, as it increases the cost of dollar-denominated assets for holders of other currencies. The recent hawkish signals from the Federal Reserve, coupled with hotter-than-expected US PPI data, have bolstered the dollar's appeal. This is a significant factor; when the Fed signals a less dovish stance or hints at keeping rates higher for longer, it can strengthen the dollar and put pressure on gold. The correlation between DXY and XAUUSD is usually inverse, and we're seeing that play out, with the dollar's strength coinciding with gold's recent struggles to maintain higher levels. The DXY's current position near 100.00 is a psychological level that, if decisively breached, could add further fuel to the dollar's rally and consequently weigh on gold.
Adding to this complexity are the escalating geopolitical tensions. Recent news reports, like those from Reuters and Bloomberg, highlight ongoing instability in the Middle East and other global hotspots. Such events typically drive safe-haven demand for gold, acting as a counterbalance to dollar strength. However, the market's reaction can be unpredictable. Sometimes, gold rallies strongly on geopolitical fears, while at other times, the dollar's safe-haven status takes precedence, or a general risk-off sentiment in equities might pull all assets down temporarily. The surge in Brent crude prices past $108, while WTI lagged, also points to regional supply concerns and inflationary pressures, which could indirectly support gold as an inflation hedge. This dynamic creates a tug-of-war: dollar strength versus geopolitical fear - a classic gold market conundrum.
Central Banks and Investment Flows: A Long-Term Perspective
From a longer-term perspective, central bank buying remains a fundamental pillar of support for gold. While short-term price action can be volatile, the consistent accumulation of gold by central banks, particularly Russia and China, provides a structural demand base. These institutions view gold not just as a commodity but as a strategic asset, a store of value, and a hedge against currency fluctuations and geopolitical uncertainty. Their actions often signal a broader shift in global financial architecture, favoring diversification away from traditional reserve currencies. Even if ETF flows show some outflows, as reported by some market participants, this institutional buying provides a floor that is difficult to break through sustainably. This long-term demand is a critical factor for investors to consider when evaluating gold's intrinsic value beyond daily price swings.
Investment flows into gold ETFs have been a key driver in recent years, but we've also seen periods of outflows, particularly when risk appetite is high or when the dollar strengthens significantly. For instance, recent reports might indicate a net outflow of 20 tons from Western ETFs, suggesting that retail and institutional investors in those regions might be trimming positions. However, this needs to be weighed against sustained central bank purchases and potential demand from emerging markets. The interplay between these different demand sources - central banks, retail investors via ETFs, jewelry demand, and industrial use - creates a complex supply-demand equation. Understanding these drivers is key to forming a robust investment thesis, moving beyond the noise of daily price fluctuations.
Analyzing Key Levels: The Battle for $4,849.87
The immediate focus remains on the $4,849.87 price point. On the 1-hour chart, the first resistance level is clearly defined at $4,866.49. A decisive break above this could signal a short-term bullish reversal, targeting $4,874.44 and potentially $4,887. However, given the strong downtrend indicated by the ADX on lower timeframes, overcoming these levels will require significant buying pressure. Conversely, support levels on the 1-hour chart are at $4,845.98, $4,833.42, and $4,825.47. A break below $4,845.98 could accelerate the move lower, especially if the 4-hour chart's bearish signals continue to dominate.
Looking at the 4-hour timeframe, the support levels are much lower: $4,783.86, $4,749.17, and $4,691.58. These are the levels that matter if the strong downtrend continues. The resistance levels on this chart are $4,876.14, $4,933.73, and $4,968.42. A move towards $4,968.42 would signal a significant shift in momentum, but it seems unlikely in the current environment without a major change in market sentiment or fundamentals. The daily chart offers broader support at $4,744.83, $4,671.11, and $4,535.46, and resistance at $4,954.20, $5,089.85, and $5,163.57. The $4,954.20 level on the daily chart is a significant area of resistance that needs to be cleared for a more substantial bullish outlook to emerge.
Scenario Analysis: Charting the Path Forward
Bearish Scenario: Trend Continuation
65% ProbabilityNeutral Scenario: Range-Bound Consolidation
25% ProbabilityBullish Scenario: Reversal Formation
10% ProbabilityGiven the strong downtrend signals on the 4-hour chart and the ADX at 52.97, the bearish scenario appears most probable in the short to medium term. The RSI being at 34.2 on the 1H chart and 40.96 on the 1D chart suggests there's still room for price to fall before hitting oversold conditions on the daily. The 1H Stochastic's upward signal is a minor counter-trend indicator that could lead to a brief bounce, but it's unlikely to sustain without broader market confirmation or a shift in fundamental drivers. The DXY's strength around 99.93 is a significant headwind. Therefore, traders should be looking for opportunities to short rallies or wait for a clear break below the immediate support at $4,845.98. A move towards $4,783.86 on the 4H chart becomes a more likely target if selling pressure intensifies.
The neutral scenario hinges on the market failing to commit to a direction, potentially consolidating around the current price levels. This could occur if the conflicting signals from different timeframes keep traders on the sidelines, waiting for clearer direction. A range between $4,800 and $4,870 might emerge, offering tactical trading opportunities but lacking a strong directional conviction. For this scenario to play out, we'd need to see reduced volatility and a sideways drift, which isn't strongly supported by the current ADX readings, especially on the 4H chart.
The bullish scenario, while less probable given the current technical setup, cannot be entirely dismissed. A strong catalyst, such as a significant geopolitical escalation that overrides dollar strength, or a surprisingly dovish turn from the Fed (which seems unlikely given recent data), could propel gold higher. For this to materialize, XAUUSD would need to decisively break through the $4,887 resistance on the 1H chart and then tackle the more significant daily resistance near $4,954.20. Until then, any upward moves should be treated with caution, and confirmation of a trend reversal would be essential before committing to a long position.
Frequently Asked Questions: XAUUSD Analysis
What happens if XAUUSD breaks below the $4,845.98 support level?
If XAUUSD closes decisively below $4,845.98, the bearish scenario gains significant traction. This could trigger further selling pressure, with the next key target being the 4-hour support at $4,783.86. The strong ADX of 52.97 on the 4-hour chart indicates that such a breakdown would likely be part of a continued strong downtrend.
Should I buy XAUUSD at current levels near $4,849.87 given the oversold RSI on the daily chart?
Buying solely based on the daily RSI at 40.96 (oversold on 4H at 29.13) is risky given the dominant 4-hour downtrend (ADX 52.97). While a short-term bounce is possible, confirmation is needed. Wait for a clear break above 1H resistance at $4,866.49 or a sustained move above $4,887 before considering a long position, targeting higher resistance levels.
Is the ADX reading of 52.97 a sell signal for XAUUSD on the 4-hour chart?
An ADX value of 52.97 signifies a very strong trend. In this context, it confirms the prevailing downtrend on the 4-hour chart. While not a direct 'sell' signal itself, it strongly suggests that attempting to fight the trend by buying is highly risky and that shorting on pullbacks or breaks of support offers a more statistically favorable trading approach.
How will the strong DXY around 99.93 affect XAUUSD's price near $4,849.87 this week?
The strong DXY around 99.93 typically puts downward pressure on gold. Historically, a rising dollar makes gold more expensive for non-dollar buyers. While geopolitical events can sometimes override this, the current dollar strength is a significant headwind for XAUUSD, making it harder for gold to sustain rallies unless geopolitical fears dramatically intensify or the Fed signals a dovish pivot.
| Indicator | Value | Signal | Interpretation |
|---|---|---|---|
| RSI (14) | 34.2 | Neutral | Leans bearish on 1H, neutral on 1D. Room to fall before oversold. |
| MACD Histogram | Positive | Bullish | Positive momentum on 1H, though bearish on 4H/1D. |
| Stochastic | K=50.96, D=35.75 | Bullish | Bullish cross on 1H, oversold on 1D, bearish on 4H. Conflicting. |
| ADX | 45.94 | Strong Downtrend | Confirms strong downtrend on 1H, very strong on 4H. Dominant signal. |
| Bollinger Bands | Middle Band | Watch | Price below middle band on 1H/4H/1D suggests bearish bias. |
The market's reaction to the upcoming economic calendar will be crucial. Any surprises in inflation or employment data, or any shifts in central bank rhetoric, could dramatically alter the outlook. For now, the technicals, particularly the strong ADX on lower timeframes and the prevailing dollar strength, suggest caution for gold buyers. While oversold conditions on longer timeframes hint at potential value, the immediate trend remains downward. Traders should focus on risk management, waiting for clear directional signals or confirmations at key support and resistance levels before committing significant capital. The $4,849.87 price point is not just a number; it's a battle line, and its resolution will likely set the tone for gold's next significant move.
Ultimately, gold's role as a safe-haven asset is being tested against the dollar's strength, driven by Fed expectations and geopolitical events. The persistent buying by central banks offers a structural floor, but short-term price action is heavily influenced by these macro factors and technical momentum. As Alexei Sokolov, I advise a measured approach: respect the current downtrend signals on lower timeframes, acknowledge the potential for safe-haven bids to emerge, and be ready to act when clear confirmation arrives. Patience will be rewarded.
Track markets in real-time
AI-powered analysis, technical indicators and real-time price data.
Join Our Telegram Channel
Breaking market news, AI analysis and trading signals instantly.
Join Channel