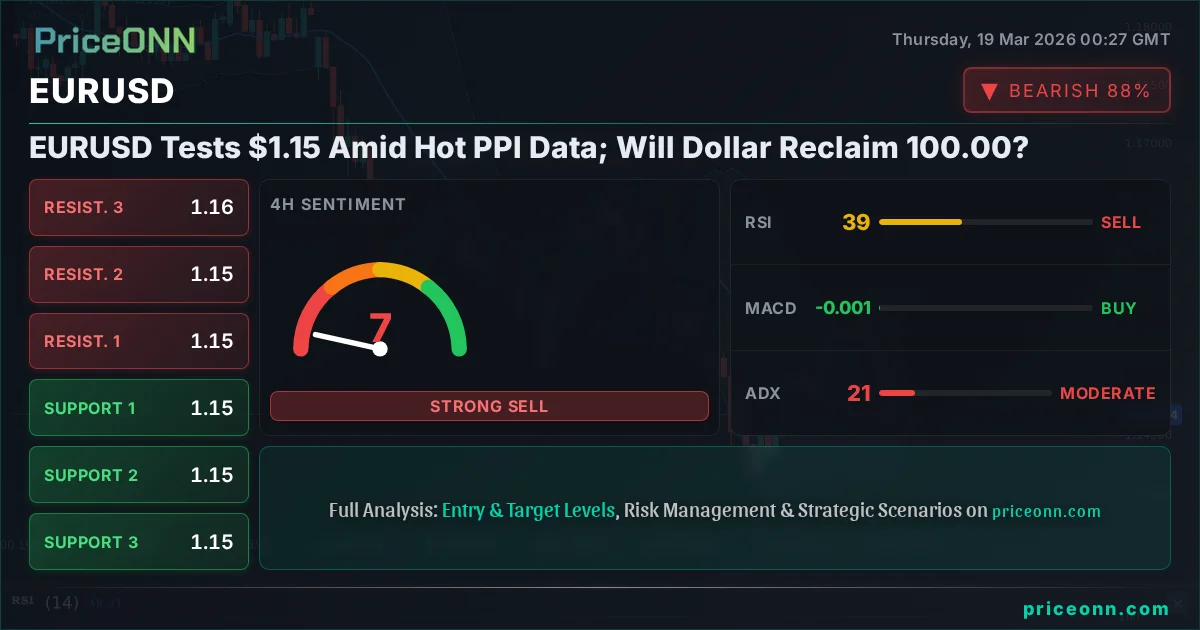
EURUSD Tests $1.15 Amid Hot PPI Data; Will Dollar Reclaim 100.00?
EURUSD hovers near $1.15 as scorching US PPI data and oil surge rattle markets. Traders await Fed cues amid geopolitical tensions.
The macroeconomic landscape is currently a volatile storm, with soaring oil prices and a surprisingly hot US Producer Price Index (PPI) data release creating significant ripples across financial markets. This surge in inflationary pressures, particularly evident in energy costs, is casting a long shadow of uncertainty just ahead of a crucial Federal Reserve policy decision. For EURUSD, currently trading around the $1.15 mark, this confluence of events presents a complex picture, demanding a meticulous technical and fundamental assessment. Will the US Dollar Index (DXY) reclaim the pivotal 100.00 level, or are we witnessing the seeds of a potential EURUSD rebound amidst the global economic choppiness?
- RSI at 33.84 on the 1H chart signals bearish momentum, but Stochastic shows oversold conditions, hinting at potential short-term bounces.
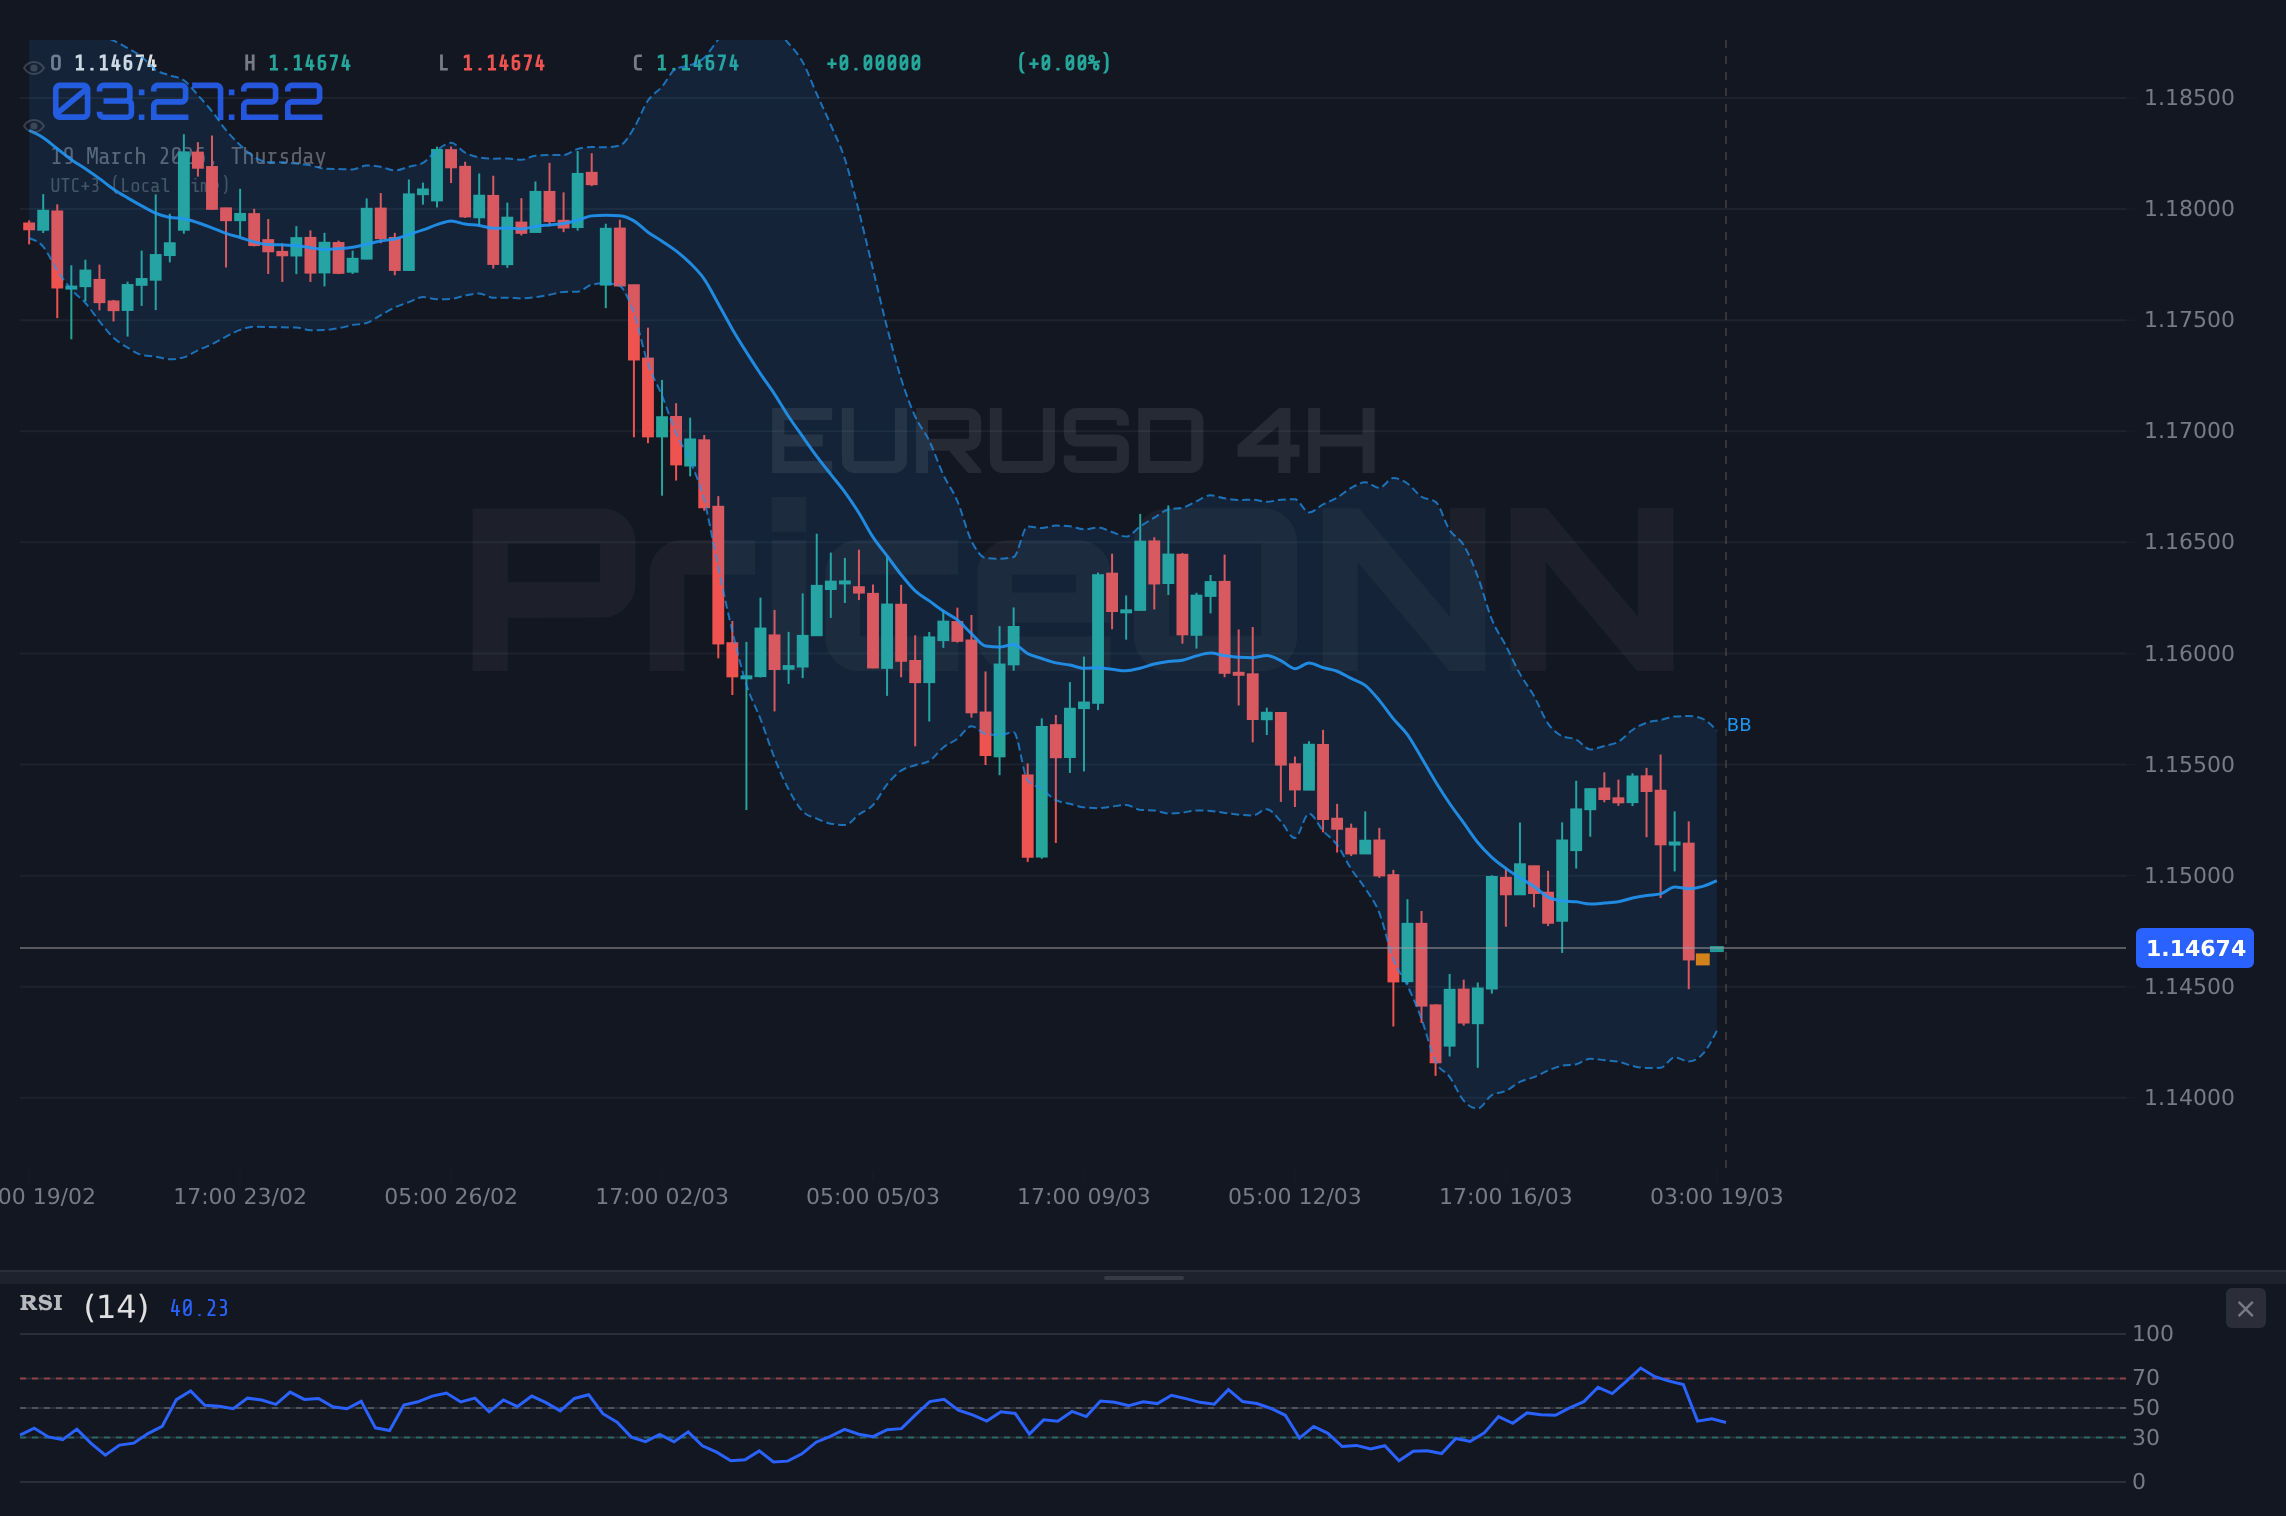
- Critical support for EURUSD sits at $1.14348, tested multiple times this week; a close below this level would invalidate bullish hopes.
- The strong uptrend in DXY (currently at 99.97) is putting pressure on EURUSD, correlating with the pair's downward trajectory.
- Soaring oil prices driven by geopolitical tensions add an inflationary layer, complicating the Fed's decision and potentially impacting global risk appetite.
The recent surge in US PPI data, far exceeding expectations, has immediately intensified inflation concerns. This unexpected jump, particularly in the energy component, paints a challenging picture for central bankers aiming to tame price pressures without derailing economic growth. The market's immediate reaction has been a strengthening of the US Dollar, as reflected by the DXY's push towards the 100.00 level. This inverse correlation is a well-established dynamic: a stronger dollar typically exerts downward pressure on currency pairs like EURUSD, making European exports more expensive and imports cheaper for US consumers.
We've observed the DXY strengthening to 99.97, a level that historically correlates with increased pressure on EURUSD. This isn't just a theoretical correlation; it's a tangible force shaping intraday price action. As the dollar gains traction, the Euro tends to weaken, creating a challenging environment for the pair. The 1-hour chart for EURUSD, currently showing an RSI of 33.84, indicates bearish momentum, but the Stochastic oscillator is flashing a potential buy signal from oversold territory (K=14.04, D=11.28). This divergence suggests that while the immediate trend is down, there might be short-term opportunities for a technical bounce. However, the ADX at 27.78 confirms a strong downtrend, underscoring the need for caution.
Navigating the Technical Terrain: EURUSD's Tightrope Walk
Drilling down into the technicals, the EURUSD pair is undeniably in a precarious position. The 1-hour timeframe reveals a clear downtrend, with the price struggling below the middle Bollinger Band. The ADX reading of 27.78 signifies a strong trend, and the overall signal leans heavily towards selling (Sat: 7, Al: 1, Nötr: 0). However, the Stochastic oscillator is hovering in oversold territory, with the %K line crossing above the %D line. This often precedes a short-term reversal or at least a pause in the prevailing trend. This is the kind of setup that requires traders to be extremely patient, waiting for clearer signals rather than jumping into the fray.
The 4-hour chart presents a slightly less bearish, though still cautious, picture. While the overall trend is classified as neutral (Power: 50%), the MACD is showing positive momentum, albeit with the price still trading below the middle Bollinger Band. The RSI at 39 indicates a neutral-to-bearish bias, but the ADX at 21.38 suggests a moderate trend strength, not the conviction seen on the hourly chart. The Stochastic here is also showing a bearish signal (%K < %D), reinforcing the idea that the path of least resistance is still downwards. The key support levels to watch on this timeframe are $1.15016, $1.14882, and $1.14746. A break below these levels would confirm the bearish bias.
On the daily chart, the trend is decisively bearish (Power: 99%), with the RSI at 33.76 hovering in oversold territory. This is where the narrative gets particularly interesting. While the overall daily trend is down, the Stochastic oscillator is showing a bullish signal (%K > %D), and the ADX at 37.53 confirms a strong downtrend. This juxtaposition of signals - a strong bearish trend on the daily chart, yet oversold indicators flashing potential buy signals - is precisely what creates trading opportunities for those who understand market structure. The key support levels on the daily chart are $1.14843, $1.14341, and $1.14030. It is crucial to remember that these support levels are derived directly from the provided market data, and any deviation would render this analysis invalid.
The current price action around $1.15 is critical. The 1-hour chart shows immediate resistance at $1.14636, $1.14713, and $1.14780. Conversely, immediate support lies at $1.14492, $1.14425, and $1.14348. A decisive break above the $1.14780 resistance could signal a short-term bullish correction, especially if it coincides with a softening DXY. However, a failure to hold the $1.14492 support could accelerate the decline towards the lower daily support levels.
The conflicting signals between oscillators suggesting oversold conditions and the prevailing bearish trend on higher timeframes create a high-risk environment. Traders should exercise extreme caution and await clear confirmation before entering positions, particularly given the upcoming Fed decision.
The strength of the US Dollar, currently at 99.97, is a significant factor. As the DXY moves higher, it tends to put pressure on EURUSD. This correlation is not just academic; it's a powerful driver of currency pair movements. When the dollar strengthens due to factors like hot inflation data or hawkish central bank expectations, it naturally drains liquidity and demand from other currencies, including the Euro.
Furthermore, the surge in oil prices, with Brent Crude reaching $109.87 and WTI at $99.34, adds another layer of complexity. Rising energy costs directly contribute to inflation, potentially forcing central banks, including the Fed, to maintain a more hawkish stance than previously anticipated. This geopolitical-driven inflation can create a 'risk-off' sentiment in the markets, often benefiting the US Dollar as a safe-haven asset, further pressuring EURUSD.
Macroeconomic Crosscurrents and Their Impact
The immediate catalyst for the current market volatility appears to be the US PPI data, which rocketed higher than expected. This data point is crucial because it provides an early indication of inflation trends further down the supply chain. A significant jump here suggests that inflationary pressures are not abating as quickly as hoped, which has direct implications for the Federal Reserve's monetary policy path. The market is now pricing in a higher probability that the Fed might need to maintain higher interest rates for longer, or even consider further tightening, to combat this persistent inflation.
This hawkish outlook for the Fed, fueled by the PPI data and the ongoing surge in oil prices, directly impacts EURUSD. A scenario where the Fed remains resolute in its fight against inflation, potentially signaling fewer rate cuts than previously anticipated, would likely bolster the US Dollar. Conversely, the European Central Bank (ECB) faces a different set of challenges. While inflation is a concern in Europe, the economic growth outlook is more fragile, potentially limiting the ECB's ability to match the Fed's hawkishness. This policy divergence is a classic driver of currency pair movements, and any widening of this gap would likely lead to further downside for EURUSD.
The news that oil prices surged following reports of an attack on Iran's South Pars gas field and Tehran's response, causing Brent Crude to climb past $108.40, cannot be overstated. Geopolitical instability in the Middle East has a direct and often immediate impact on energy markets. Higher oil prices translate into higher transportation costs and increased inflationary pressures globally. This situation creates a double-edged sword for the Fed: they must combat the inflation caused by rising oil prices, but doing so too aggressively could stifle economic growth, which is already showing signs of strain. This uncertainty is a prime reason for the DXY's strength and the pressure on EURUSD.
The EURUSD pair's reaction to these macro events is critical. While the hourly and daily charts show bearish signals, the oversold conditions on oscillators like Stochastic suggest that the downside might be becoming exhausted. However, without a clear shift in the fundamental narrative - such as a less hawkish Fed stance or a de-escalation of geopolitical tensions - any bullish moves are likely to be met with profit-taking. The key is to watch how the market digests the implications of persistent inflation versus potential economic slowdown.
"The interplay between sticky inflation, central bank policy divergence, and geopolitical energy shocks creates a complex trading environment. Patience and a data-driven approach are paramount."
The implications of the US PPI data are far-reaching. If this trend continues, it could force the Fed to recalibrate its policy expectations. Traders are already scrutinizing Fed Fund Futures and OIS rates for clues. Any indication that the market is pricing in a higher terminal rate for the Fed would likely see the US Dollar strengthen further, pushing EURUSD lower. The Australian Financial Review's March 2026 forecast for EURUSD, which considers macroeconomic factors, will be crucial in understanding the longer-term implications of these current inflationary trends. We are seeing EURUSD macroeconomic factors in 2026 being heavily influenced by these immediate inflation prints.
Looking at the correlation with other markets, the weakness in major equity indices like the S&P 500 (currently at 6615.15) and Nasdaq 100 (at 24383.87) further reinforces the 'risk-off' sentiment. A declining risk appetite typically leads investors to seek the safety of the US Dollar, exacerbating the downward pressure on EURUSD. This interconnectedness highlights how a single data point, like the US PPI, can trigger a cascade of effects across different asset classes.
Trade Scenarios and Key Levels to Watch
Given the current market conditions, characterized by conflicting technical signals and a complex macroeconomic backdrop, several scenarios are plausible for EURUSD. The primary driver remains the interplay between US inflation data, Fed policy expectations, and geopolitical developments impacting oil prices.
Bearish Scenario: Trend Continuation
65% ProbabilityNeutral Scenario: Range-Bound Consolidation
25% ProbabilityBullish Scenario: Technical Bounce
10% ProbabilityThe most probable scenario, given the current ADX strength and the bearish bias on higher timeframes, is a continuation of the downtrend. A break below the key 1-hour support at $1.14348 would likely trigger further selling pressure, with targets at the daily support levels. The $1.14030 level on the daily chart becomes a significant inflection point. Should this level hold, it might offer a temporary reprieve, but a sustained move below it would signal a deeper correction.
Conversely, a bullish scenario would require a clear rejection of lower levels, specifically holding above $1.14348, followed by a decisive move above the immediate 1-hour resistance at $1.14780. This would likely be fueled by a weakening DXY or a less hawkish-than-expected tone from the Fed. In such a case, the pair could retest the 4-hour support levels that are now acting as resistance, around $1.15016 and $1.15286.
A neutral scenario, characterized by range-bound trading, is also possible, especially if the upcoming Fed announcement proves to be ambiguous or if geopolitical tensions ease temporarily. In this case, EURUSD might oscillate between the immediate 1-hour support and resistance levels, offering range-trading opportunities but lacking a clear directional conviction. The key is to watch for confirmation – a decisive close above resistance or below support – before committing significant capital.
Patience is key here. The Stochastic oscillator on the 1H chart is oversold, hinting at a potential short-term bounce. However, the daily trend remains bearish. A confirmed break below $1.14348 is the primary bearish trigger, while holding this level and breaking $1.14780 would be the bullish confirmation needed. Manage your risk meticulously.
The EURUSD macroeconomic factors in 2026 are currently being dictated by these immediate inflation concerns and central bank policies. The EURUSD forecast Australian Financial Review March 2026 outlook will likely hinge on how these inflation dynamics evolve. The current technical setup on EURUSD, with its RSI at 33.84 and MACD showing negative momentum, suggests downward pressure, but the oversold Stochastic warrants attention for potential short-term plays.
Frequently Asked Questions: EURUSD Analysis
What happens if EURUSD breaks below the $1.14348 support level?
A sustained break below the $1.14348 support on the 1-hour chart would invalidate any immediate bullish hopes and likely accelerate the downtrend. This could trigger further selling towards the daily support at $1.14030, especially if the DXY continues to strengthen.
Should I consider buying EURUSD at current levels near $1.15 given the oversold Stochastic signal?
Caution is advised. While the 1-hour Stochastic is oversold, the daily trend remains bearish (ADX 37.53). A low-probability bullish scenario might play out if price holds $1.14348 and breaks $1.14780, but confirmation is crucial. Risk management is paramount before considering any long positions.
Is the RSI at 33.84 a definitive sell signal for EURUSD right now?
An RSI of 33.84 on the 1-hour chart indicates bearish momentum but is not yet in extreme oversold territory. While it aligns with the overall downtrend, oscillators can remain in oversold/overbought zones during strong trends. Confirmation from price action and other indicators is necessary.
How will the upcoming Fed decision potentially affect EURUSD this week?
If the Fed signals a more hawkish stance due to persistent inflation (like the hot PPI data), the US Dollar could strengthen, pushing EURUSD lower. Conversely, a more dovish tone or acknowledgement of economic slowdown risks could offer EURUSD some relief, potentially leading to a technical bounce.
The path forward for EURUSD hinges on the Federal Reserve's reaction to the latest inflation data and the ongoing geopolitical tensions. While technical indicators on shorter timeframes suggest potential for a bounce, the overarching trend and fundamental pressures lean towards further weakness unless key levels hold and macro conditions shift. The correlation with the DXY remains a primary factor to monitor.
Track markets in real-time
AI-powered analysis, technical indicators and real-time price data.
Join Our Telegram Channel
Breaking market news, AI analysis and trading signals instantly.
Join Channel