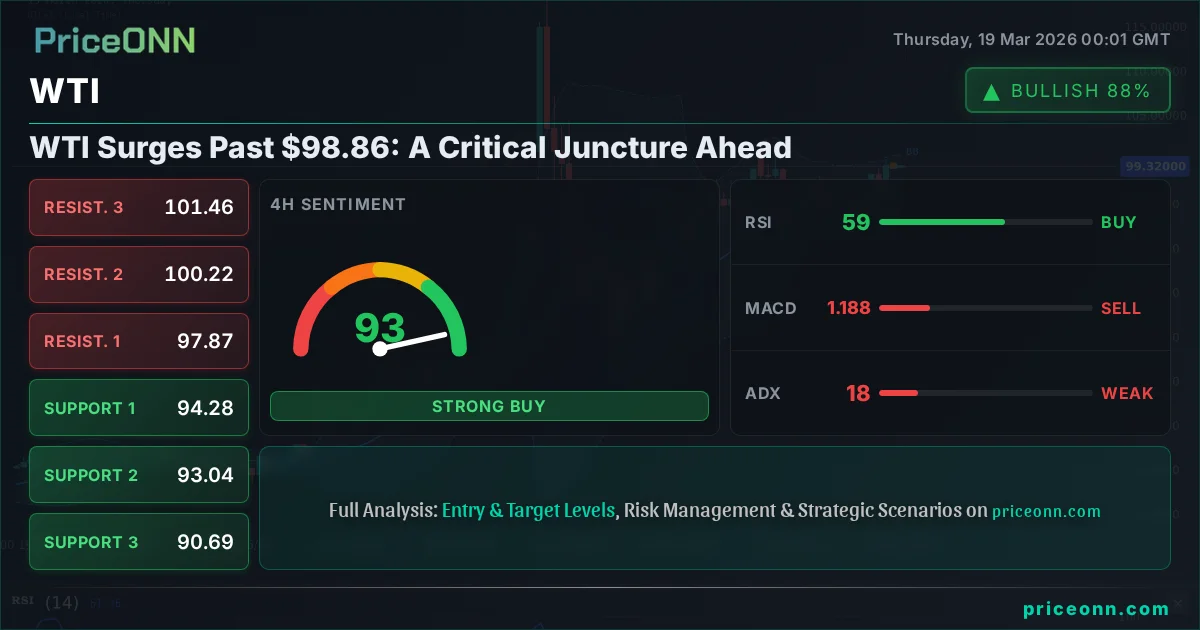
WTI Surges Past $98.86: A Critical Juncture Ahead
WTI crude oil is trading at $98.86 following a significant surge. Technical indicators suggest a strong downtrend, but key levels warrant attention.
WTI crude oil has staged a remarkable rally, breaking past the critical $98.86 mark. This surge, however, arrives at a pivotal moment, with multiple technical indicators flashing cautionary signals and geopolitical undercurrents adding complexity. As traders eye the next move, understanding the confluence of factors at play is paramount. This isn't just another price movement; it's a test of market conviction amidst a volatile landscape, demanding a close examination of the data and what it portends for the immediate future.
- WTI crude oil is currently trading at $98.86, showing a significant upward move on the day.
- On the 1H chart, ADX at 22 indicates a moderate trend, but Stochastic signals a potential reversal from overbought conditions.
- The 4H chart shows a neutral trend with ADX at 17.71, suggesting choppy conditions, while the 1D chart exhibits a strong uptrend (ADX 55.85) with RSI at 75.88 signaling overbought pressure.
- Geopolitical tensions and a surge in Brent crude prices are influencing WTI, while USD strength could act as a headwind.
The energy markets are alive with activity, and WTI crude oil is at the heart of the action, currently trading at $98.86. This price point represents more than just a number; it's a testament to the dynamic interplay of supply, demand, and increasingly, geopolitical tensions that are reshaping the global energy map. The recent surge, driven by a confluence of factors including Brent crude's impressive climb past $108 and escalating regional energy fears, has brought WTI to a significant crossroads. However, the path forward is far from clear. While the daily chart paints a picture of a robust uptrend, with an ADX reading of 55.85 underscoring its strength and RSI at 75.88 flirting with overbought territory, the shorter timeframes present a more nuanced, and frankly, cautionary tale. This divergence across timeframes is precisely where astute traders find their edge – by dissecting the conflicting signals and identifying the most probable path forward.
Looking at the 1-hour chart, the picture is less bullish than the daily trend might suggest. The ADX stands at 22, indicating a moderately trending market, but the Stochastic oscillator (K=78.54, D=65.69) is pushing into overbought territory, hinting at potential exhaustion or a consolidation phase. This isn't the kind of momentum that typically fuels sustained rallies. It suggests that while the bulls have managed to push the price higher, they might be running out of steam, or at the very least, facing significant selling pressure as the price approaches key resistance levels. The fact that WTI is trading at $98.86 right now, but showing these shorter-term technical warnings, creates an immediate tension that needs to be resolved. It begs the question: is this rally sustainable, or are we on the cusp of a retracement?
Navigating the Technical Landscape: A Tale of Divergent Timeframes
The Daily Bullish Momentum Faces Short-Term Hurdles
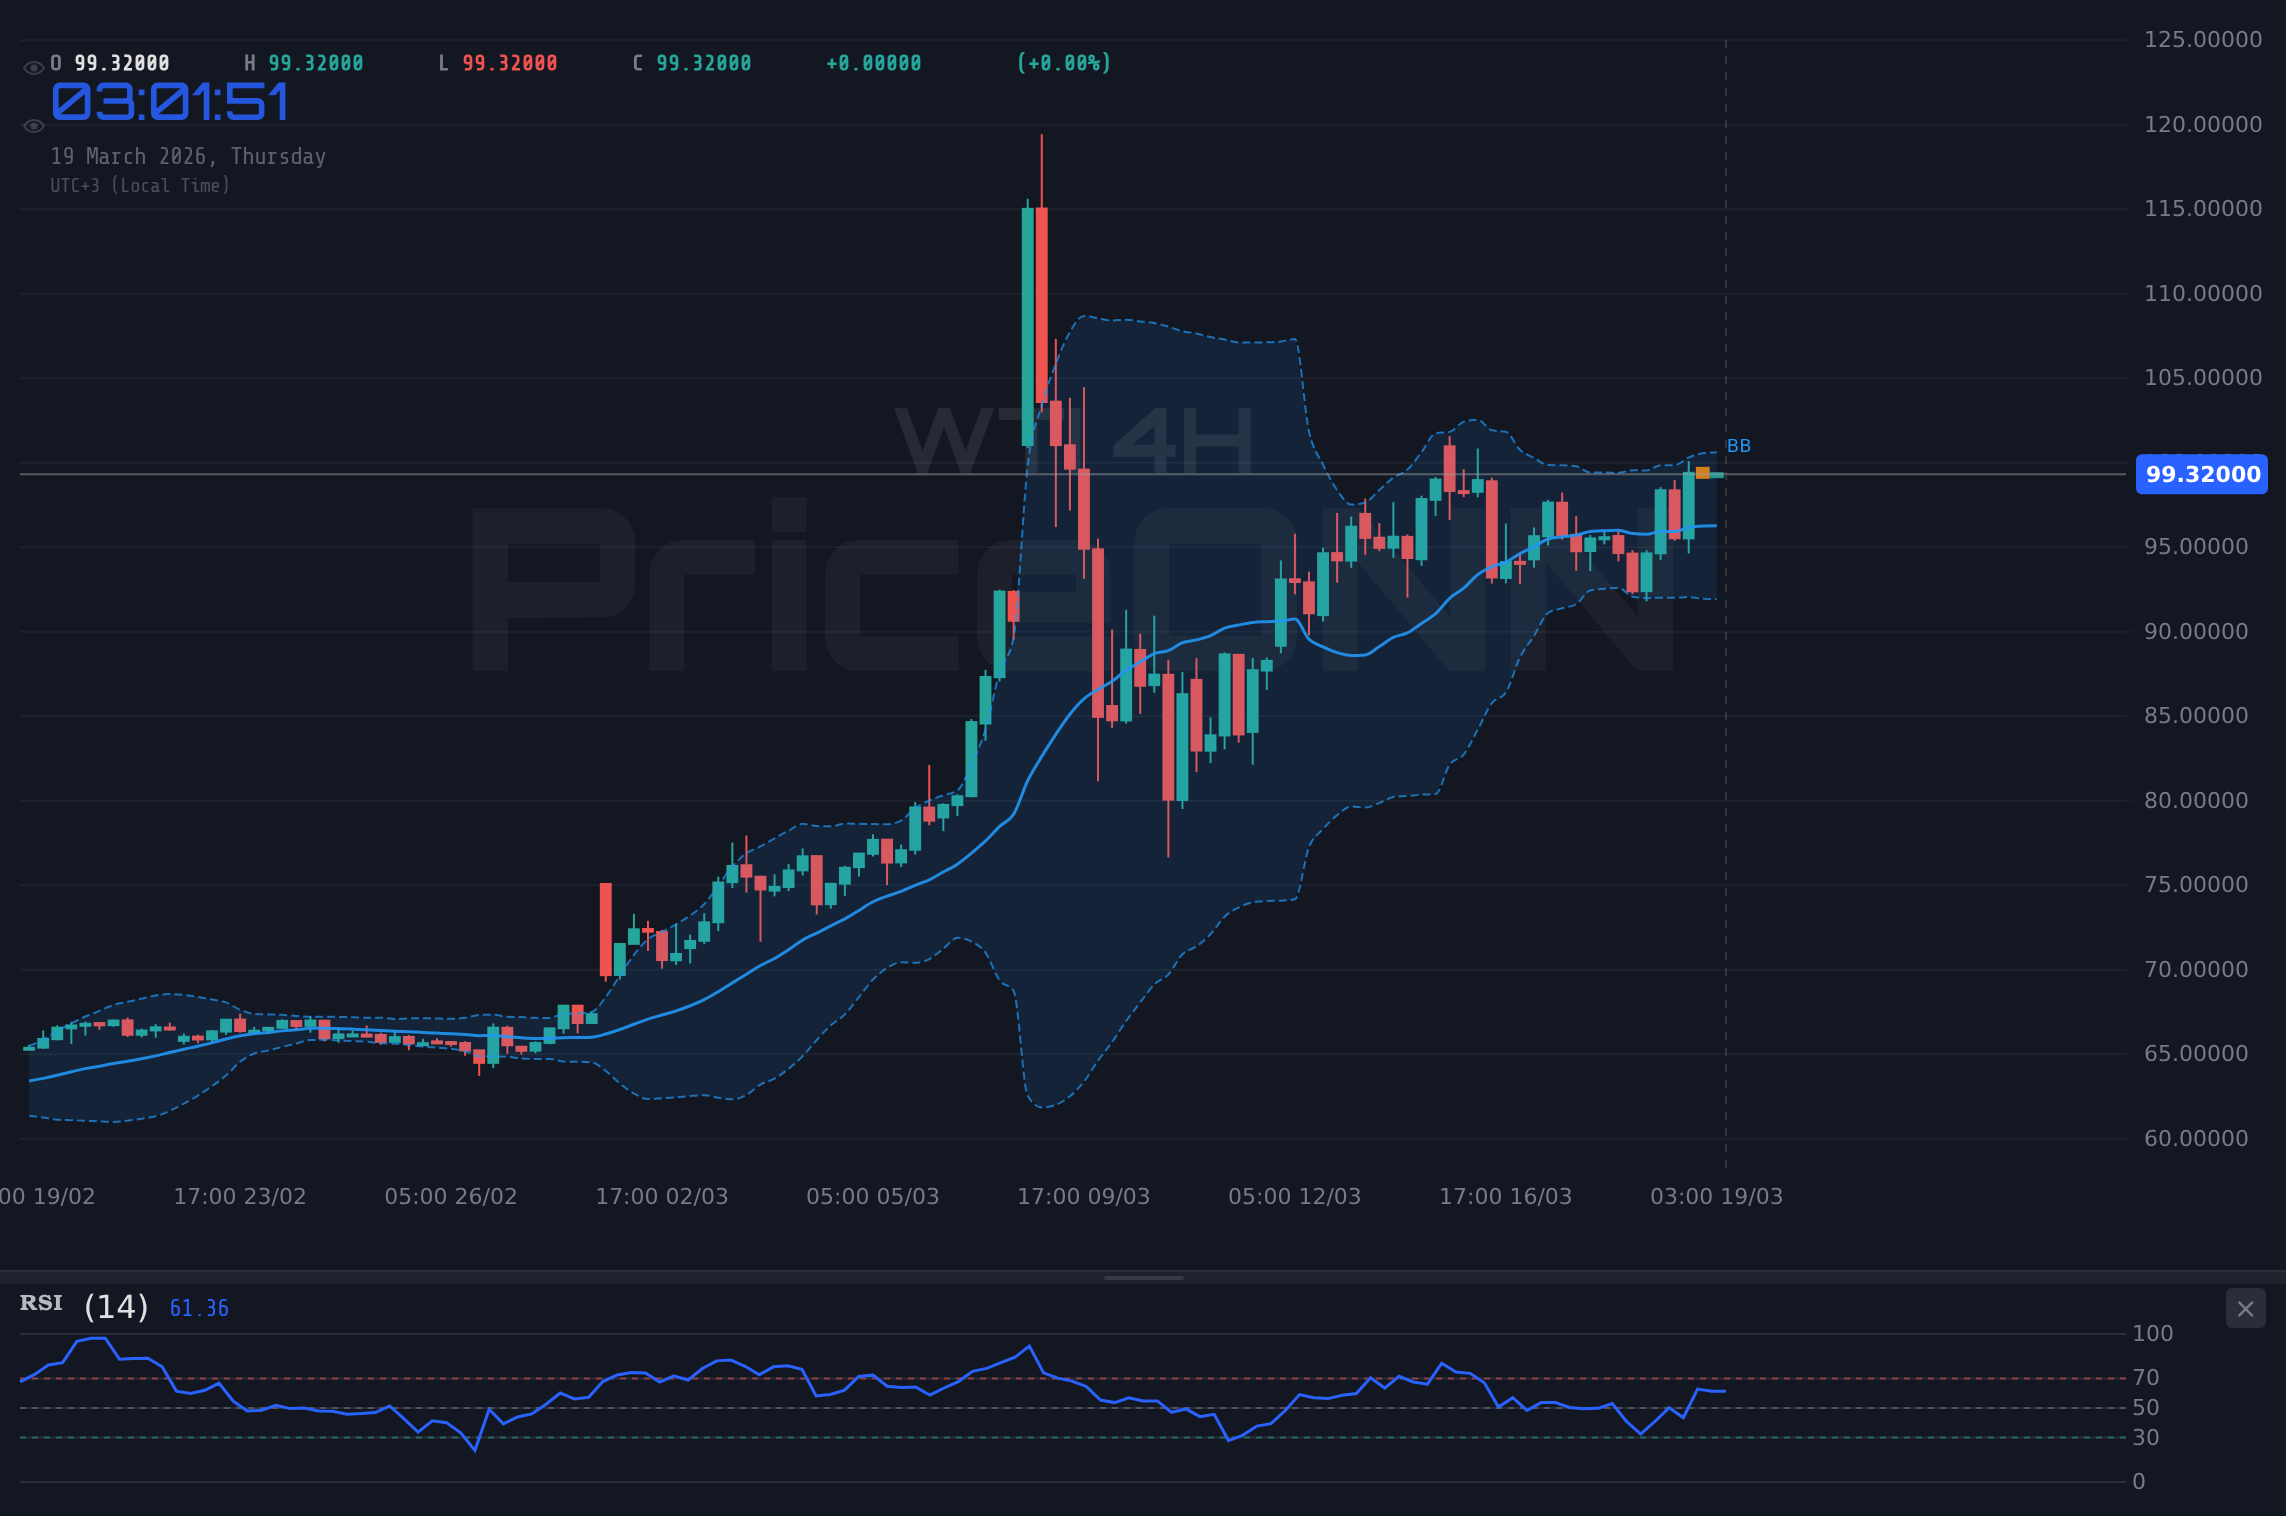
The daily timeframe for WTI presents a compelling bullish case, at least on the surface. The trend is undeniably strong, with an ADX of 55.85, which typically signifies a powerful, committed trend. The RSI at 75.88 is elevated, signaling strong upward momentum, though it's not yet in extreme overbought territory that would immediately suggest a sharp reversal. Bollinger Bands are also showing upward expansion, with the price trading above the middle band, reinforcing the bullish sentiment. This outlook is further supported by the overall market sentiment, which appears to be pricing in continued geopolitical instability and potential supply disruptions. The daily general signal is AL (Buy) with a score of 5 (Buy), 2 (Sell), and 0 (Neutral), highlighting the dominant bullish conviction on this longer timeframe. This strong daily trend is what has likely propelled WTI to its current level of $98.86.
However, the narrative shifts significantly when we zoom out to the 4-hour and 1-hour charts. The 4-hour ADX is at 17.71, a stark contrast to the daily's 55.85. This reading suggests a weak trend on this timeframe, indicating that the market is potentially choppy or range-bound over this intermediate period. While the daily trend is strong, the 4-hour chart implies that the price action might be consolidating or experiencing pullbacks within that broader uptrend. The Stochastic oscillator on the 4-hour chart (K=78.15, D=46.94) shows a bullish signal, with %K above %D, but it's also nearing overbought conditions, which could precede a reversal or consolidation. The RSI at 57.7 is in neutral territory, showing upward momentum but not extreme bullishness. The general signal here is AL (Buy) with a 7-2-0 score, but the weak ADX tempers the enthusiasm.
Short-Term Signals: Cautionary Flags on the Horizon
The 1-hour chart paints an even more cautious picture. Here, the ADX is at 22, indicating a moderate trend, but the Stochastic oscillator (K=78.54, D=65.69) is firmly in overbought territory and showing a bullish crossover, suggesting a potential short-term reversal or at least a pause in the upward momentum. The RSI at 61.61 is also in the upper half of its range, indicating bullish sentiment but not extreme overextension. The Bollinger Bands are showing an upward bias, with the price trading above the middle band. The general signal on the 1H chart is AL (Buy) with an 8-0-0 score, but this is heavily influenced by the strong daily trend bleeding through. The crucial takeaway from the 1-hour and 4-hour charts is the potential for short-term exhaustion or a pullback, despite the robust daily trend. This is where risk management becomes paramount; chasing a rally that shows signs of faltering on shorter timeframes can be a costly mistake.
The conflict between the strong daily uptrend and the weaker, potentially overbought signals on the shorter timeframes is the most significant technical observation right now. This suggests that while the overarching trend is bullish, the immediate path higher might be bumpy, characterized by consolidation or pullbacks. Traders looking to enter long positions would ideally want to see a clearer trend across all timeframes or a pullback to a support level that holds firm. Conversely, short-term traders might be looking for signs of reversal on the hourly chart to capitalize on potential downward corrections. The current price of $98.86 sits at a critical juncture where these conflicting signals are most pronounced.
Geopolitical Undercurrents and Macroeconomic Ripples
The surge in WTI prices cannot be divorced from the escalating geopolitical tensions in the Middle East. Reports of an attack on Iran's South Pars gas field, coupled with broader fears of regional energy chaos, have undoubtedly injected a significant risk premium into oil prices. This is a classic scenario where supply-side anxieties can rapidly drive prices higher, irrespective of immediate demand figures. Brent crude, often a bellwether for global oil sentiment, has already climbed sharply, surpassing $108 per barrel, and WTI, while lagging slightly, is clearly being pulled along by this upward momentum. This geopolitical backdrop provides a fundamental underpinning for the bullish trend observed on the daily WTI chart, acting as a powerful catalyst that can override short-term technical pullbacks.
Adding another layer of complexity is the performance of the US Dollar Index (DXY). Currently trading around 100.06, the DXY has shown considerable strength, gaining 0.88% on the day. A stronger dollar typically exerts downward pressure on dollar-denominated commodities like oil, as they become more expensive for holders of other currencies. However, the current market dynamic seems to be a case of 'risk-on' for oil driven by geopolitical fear, potentially overshadowing the dollar's strength for now. If the dollar were to continue its ascent, perhaps fueled by hawkish signals from the Federal Reserve, it could eventually cap oil's gains. The interplay between these geopolitical drivers, oil-specific supply concerns, and broader macroeconomic factors like currency movements and central bank policy is what makes the energy market so dynamic and challenging.
The US Producer Price Index (PPI) data, which came in significantly higher than expected, adds another crucial piece to the macroeconomic puzzle. Hotter-than-expected PPI figures can fuel inflation concerns, which in turn could influence the Federal Reserve's monetary policy decisions. While the market seems to be currently focused on supply-side issues driving oil prices up, persistent inflation could lead to a more hawkish stance from the Fed. This, as mentioned, could strengthen the dollar and eventually create headwinds for oil. The Fed's upcoming decision, therefore, looms large. Traders will be scrutinizing any communication for clues about future interest rate policy, as this will significantly impact the broader risk appetite and the correlation between oil, the dollar, and equity markets.
Market Sentiment and Correlation Dynamics
The correlation between oil prices and broader market sentiment, particularly equity indices like the S&P 500 and Nasdaq 100, is also worth noting. Both indices have experienced significant declines today, with the S&P 500 down 1.53% and the Nasdaq 100 down 1.65%. This risk-off sentiment in equities might typically suggest a decrease in demand for riskier assets, including commodities. However, the surge in oil prices, driven by specific supply-side fears, appears to be somewhat decoupling from the broader market's risk appetite. This divergence suggests that the factors pushing oil higher are potent enough to momentarily override the general risk sentiment. It's a situation where specific commodity-driven inflation fears are taking precedence over broader market concerns about economic slowdown or tightening monetary policy.
The correlation with the DXY is also a key factor. As the DXY strengthens, it generally puts pressure on gold and major currency pairs like EUR/USD and GBP/USD. While WTI's immediate surge seems to be driven by supply concerns, a sustained rise in the dollar could eventually dampen enthusiasm for oil. For instance, if the Fed signals a more aggressive tightening path due to the hot PPI data, the dollar could strengthen further, potentially creating a ceiling for oil prices. Conversely, if geopolitical events continue to dominate the narrative and drive oil higher, the dollar's impact might be muted in the short term. Understanding this dynamic is crucial for traders trying to navigate the current choppy conditions. The ability of WTI to sustain its rally above $98.86 will likely depend on whether the bullish supply-side narrative can continue to outweigh the headwinds from a strengthening dollar and weakening equity markets.
The CAD/JPY Connection: A Subtle Indicator
While not directly impacting WTI's price action in the immediate term, the dynamics of the CAD/JPY currency pair, influenced by Bank of Canada (BOC) and Bank of Japan (BOJ) policies and oil prices, can serve as a subtle indicator of broader commodity-linked sentiment. When oil prices surge, the Canadian dollar (CAD) often strengthens due to Canada's status as a major oil exporter. If this strength in CAD occurs alongside a weakening Japanese Yen (JPY), which is often seen as a safe-haven currency, it can signal a broader 'risk-on' environment or at least a specific bullishness towards commodity-linked assets. Currently, the news flow around CAD/JPY suggests this pair is sensitive to oil price movements and central bank expectations. While the direct link to WTI's $98.86 price might be indirect, monitoring CAD/JPY can offer insights into how commodity strength is being perceived by a segment of the market sensitive to both oil prices and major central bank policies.
Trade Scenarios and Risk Management
Given the conflicting signals across different timeframes and the complex interplay of fundamental and technical factors, defining clear scenarios is essential for risk management. The current price of $98.86 sits at a critical juncture, and the market's reaction in the coming hours and days will be telling. A sustained move above this level, especially if accompanied by increasing volume and confirmation across timeframes, could signal further upside. However, the overbought conditions on shorter timeframes and the strong dollar present significant hurdles.
Bearish Scenario: Profit-Taking Pressure Mounts
65% ProbabilityNeutral Scenario: Consolidation Around Current Levels
25% ProbabilityBullish Scenario: Geopolitical Fears Drive Further Gains
10% ProbabilityFrequently Asked Questions: WTI Price Analysis
What happens if WTI fails to hold above $98.86 in the short term?
If WTI fails to sustain its move above $98.86, expect a potential pullback towards the $97.99 support level on the 1-hour chart. The Stochastic oscillator already shows overbought conditions on shorter timeframes, increasing the probability of such a move.
Should I consider buying WTI at current levels of $98.86 given the daily uptrend (ADX 55.85)?
Buying directly at $98.86 carries risk due to conflicting signals on shorter timeframes. A more prudent approach might be to wait for a pullback to a key support level like $97.99 or $97.47, or confirmation of a sustained breakout above $100.01 resistance, carrying a 10% probability in the bullish scenario.
Is the RSI at 75.88 on the daily chart a sell signal for WTI?
An RSI of 75.88 on the daily chart indicates strong bullish momentum but is not yet in extreme overbought territory suggesting an immediate reversal. While it warrants caution, it doesn't negate the powerful daily trend indicated by the ADX of 55.85. Look for confirmation from shorter timeframes or price action before considering a short position.
How will the hot US PPI data and potential Fed hawkishness affect WTI this week?
Hot PPI data suggests rising inflation, which could lead to a more hawkish Federal Reserve. A stronger dollar resulting from this could cap oil prices, potentially negating the current bullish momentum driven by geopolitical fears. Monitor the DXY's reaction and Fed commentary closely, as this macro driver could become more significant than short-term supply concerns.
The energy markets are currently a complex tapestry woven with geopolitical threads and technical signals. WTI at $98.86 is more than just a price; it's a battleground where short-term caution clashes with long-term bullish conviction. While the daily trend remains robust, the immediate path higher is likely to be tested by overbought conditions on shorter timeframes and potential headwinds from a strengthening dollar. Patience and discipline will be key. Waiting for clearer signals - either a confirmed breakout above resistance or a pullback to a well-tested support level - will be crucial for navigating these choppy waters. Remember, in volatile markets, managing risk and waiting for the right setup isn't just a strategy; it's survival.
Track markets in real-time
AI-powered analysis, technical indicators and real-time price data.
Join Our Telegram Channel
Breaking market news, AI analysis and trading signals instantly.
Join Channel