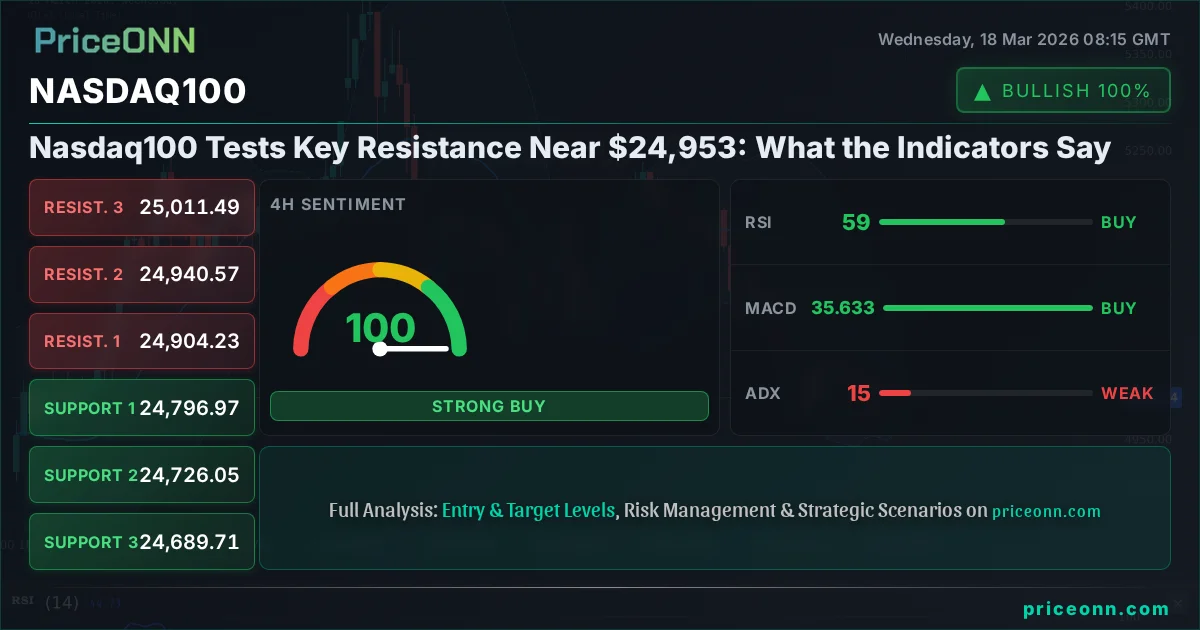
Nasdaq100 Tests Key Resistance Near $24,953: What the Indicators Say
Nasdaq100 hovers near $24,953.52 resistance. Technical indicators show mixed signals, with ADX suggesting a ranging market. Price action analysis is crucial.
The Nasdaq100 is currently trading at $24,953.52, finding itself at a critical juncture as it probes resistance levels that have previously capped upside momentum. This pivotal moment demands a close examination of the technical landscape, particularly the confluence of indicator signals and price action across multiple timeframes. While the index has shown resilience, the underlying strength of the trend and the potential for a reversal are subjects of intense scrutiny among traders and analysts. Understanding the nuances of the current market sentiment, the influence of macroeconomic factors, and the specific readings from technical tools is paramount for navigating this potentially volatile period. The question on many traders' minds is whether the Nasdaq100 can break through these resistance levels and continue its ascent, or if a pullback is imminent, offering opportunities for short-term plays.
- RSI at 71.43 on the 1H chart signals potential overbought pressure, suggesting caution for further upside.
- Critical resistance sits at $24,977.09, a level tested multiple times and acting as a barrier to immediate gains.
- The ADX reading of 15.15 on the 4H chart indicates a weak trend, suggesting the market is currently ranging rather than trending strongly.
- Correlation analysis shows the Nasdaq100's movement is influenced by broader equity market sentiment and DXY levels, currently at 99.38.
The Nasdaq100's journey towards the $24,953.52 mark has been characterized by a series of upward pushes, but each has been met with significant selling pressure as the index approaches its current resistance zone. On the 1-hour chart, the Relative Strength Index (RSI) stands at 71.43, a reading that, while not yet in extreme territory, suggests that the buying momentum may be cooling. This indicator, designed to measure the speed and change of price movements, often signals when an asset might be overbought and due for a correction. However, in strong uptrends, RSI can remain in overbought territory for extended periods. The MACD (Moving Average Convergence Divergence) indicator on this timeframe shows positive momentum, with the MACD line above its signal line, suggesting that the short-term trend remains upward, but the RSI divergence warrants attention.
Delving deeper into the intraday dynamics, the Stochastic Oscillator on the 1-hour timeframe presents a complex picture. With the %K line at 91 and the %D line at 94.22, it is firmly entrenched in overbought territory. This indicates that the index is trading near its highest prices over a given period and could be susceptible to a pullback. The fact that %K is below %D, however, can sometimes be interpreted as a weakening bullish signal or a precursor to a bearish crossover, though in highly trending markets, these signals can be unreliable. The Bollinger Bands on the 1-hour chart are positioned above the middle band, reinforcing the bullish sentiment in the very short term, but the price is trading near the upper band, which often acts as a resistance level. The confluence of these indicators suggests that while the immediate sentiment might be bullish, there are warning signs of exhaustion building up.
Shifting to the 4-hour timeframe provides a broader perspective on the current trend. Here, the Nasdaq100's trend strength is rated at 50%, indicating a neutral stance, which aligns with the ADX reading of 15.15. The Average Directional Index (ADX) measures trend strength, and a reading below 20 typically signifies a weak or non-existent trend, suggesting that the market is in a consolidation or ranging phase. This is a critical piece of information for traders, as it implies that breakouts may be less sustainable and that price action could be choppy. Despite the weak trend signal from the ADX, the MACD histogram on the 4-hour chart is positive, and the MACD line is above its signal line, which can still point to underlying buying pressure. However, the Stochastic Oscillator at 91.44 (%K) and 78.06 (%D) is also in overbought territory, reinforcing the idea that upside might be limited in the near term.
The daily chart analysis paints an even more nuanced picture, highlighting the challenges the Nasdaq100 faces. The overall trend on the daily timeframe is classified as bearish, with a strength of 100%, which seems to contradict the intraday bullishness. This divergence across timeframes is common in markets that are undergoing transitions or are heavily influenced by external factors. The ADX on the daily chart is at 40.98, indicating a strong trend, but its classification as 'bearish' suggests the dominant force is downward pressure, even if intraday moves show some recovery. The RSI(14) at 45.87 is in neutral territory but leaning towards oversold, which, in a bearish trend, can sometimes precede further declines. The MACD is in negative momentum, with the MACD line below its signal line, further supporting the bearish outlook on the daily scale. This conflict between short-term bullish signals and a daily bearish trend underscores the current market uncertainty.
The price action around key levels is what traders are watching most closely. The immediate resistance stands at $24,977.09, a level that has acted as a significant ceiling. A sustained break above this price, supported by strong volume and positive follow-through, would be necessary to invalidate the bearish signals from the longer timeframes and suggest a potential continuation of an uptrend. Conversely, support levels are crucial for gauging the downside risk. The first significant support level on the 1-hour chart is at $24,933.09, followed by $24,913.26 and then $24,889.09. A decisive break below these support levels would likely trigger further selling, as traders would then anticipate a move towards the more substantial daily support levels, such as $24,669.23, $24,343.41, and $24,186.14. The ability of the price to hold these levels will be a key determinant of the next major move.
Correlation analysis with other major markets provides additional context. The US Dollar Index (DXY) is currently trading at 99.38, showing a slight uptick. Historically, a stronger dollar tends to put downward pressure on assets priced in dollars, including the Nasdaq100 and gold. The current DXY level near 99.38 suggests that a strong dollar environment could be a headwind for equity indices. The S&P 500 is trading at 6754.65, showing a daily gain of 0.54%, and the Nasdaq100's movement is often closely correlated with its broader market peers. The upward momentum in the S&P 500, despite the bearish daily trend on the Nasdaq100, indicates a complex interplay of factors. The WTI crude oil price at $93.85, showing a significant daily drop, might suggest easing inflation concerns, which could indirectly support growth-oriented tech stocks like those in the Nasdaq100, but the overarching risk sentiment remains a key driver.
The Federal Reserve's monetary policy stance continues to be a dominant factor influencing market sentiment. While specific interest rate decisions are not provided in the market data, the general expectation among traders is that the Fed might hold rates steady, given the persistent inflation fears mentioned in recent news. This anticipation can create volatility as markets digest incoming economic data. Any indication of a more hawkish stance from the Fed could lead to increased risk aversion, potentially pressuring indices like the Nasdaq100. Conversely, signs of inflation easing or a dovish tilt could provide a tailwind. The correlation between the Nasdaq100 and the DXY at 99.38 highlights the sensitivity of tech stocks to shifts in monetary policy expectations and the strength of the US dollar.
The technical picture on the 1-day chart presents a challenging outlook for the bulls. The trend is classified as bearish with 100% strength, and the ADX at 40.98 signifies a strong trend. The RSI at 45.87, while in neutral territory, is below 50, suggesting a bearish bias. The MACD is negative, and the MACD line is below its signal line, confirming bearish momentum. The Stochastic Oscillator, with %K at 49.16 and %D at 41.16, shows a bullish crossover, which is a divergence from the other bearish indicators. This conflict implies that while the broader daily trend is down, there might be some short-term upward pressure or a potential for a bounce. However, the strong bearish trend indicated by the ADX means that any upside move could be met with significant selling pressure as the larger trend asserts itself.
Considering the conflicting signals across different timeframes, the Nasdaq100 is in a precarious position. The short-term charts (1H and 4H) show some bullish momentum and the price is testing resistance levels. However, the longer-term daily chart presents a strong bearish trend. The ADX readings are particularly noteworthy: 15.15 on the 4H chart suggests ranging conditions, while 40.98 on the daily chart points to a strong trend. This inconsistency means that traders should exercise extreme caution. A breakout above the immediate resistance at $24,977.09, if sustained, could signal a shift, but the strong daily bearish trend and the neutral ADX on the 4H chart suggest that such a breakout might be a bull trap or a short-lived move. The key is to watch for confirmation across multiple indicators and timeframes before committing to a position.
The current market sentiment, as reflected in the technical indicators, leans towards caution. The overbought conditions on the hourly Stochastic and RSI, coupled with the neutral ADX on the 4H chart, suggest that the upward momentum may be faltering. The Nasdaq100's ability to hold above the $24,933.09 support level will be crucial in the immediate term. If this level breaks, we could see a rapid decline towards the next support at $24,913.26 and potentially further down to $24,889.09. The broader economic context, including Fed policy expectations and the strength of the US dollar (currently at 99.38), will play a significant role in shaping the market's direction. Traders should be prepared for potential volatility as the market digests these conflicting signals and awaits clearer direction.
Looking ahead, the Nasdaq100's trajectory will likely depend on its ability to decisively break through the $24,977.09 resistance or hold the $24,933.09 support. The conflicting signals from different timeframes suggest that a period of consolidation or a sharp move in either direction is possible. The weak trend indicated by the 4H ADX implies that any directional move might lack follow-through initially. Investors and traders will be closely monitoring upcoming economic data releases and central bank commentary for clues about the future path of interest rates and inflation, which will undoubtedly influence risk appetite and, consequently, the performance of growth-oriented tech stocks within the Nasdaq100.
The present technical setup for the Nasdaq100 is one of caution rather than conviction. While short-term indicators hint at continued upward pressure, the longer-term bearish trend on the daily chart, coupled with a weak trend on the 4-hour timeframe, suggests that significant upside may be limited without a clear catalyst. The $24,953.52 price point represents a critical battleground between buyers and sellers. A decisive move above $24,977.09 could open the door for further gains, potentially targeting $25,001.26. However, a failure to overcome this resistance, and a subsequent break below $24,933.09, could signal a reversal, leading to a test of lower support levels. The market is at a crossroads, and careful observation of price action and confirmation from multiple indicators will be essential for making informed decisions.
The interplay between the Nasdaq100's price action and key technical indicators highlights the current market's indecisiveness. The RSI at 71.43 on the 1-hour chart suggests overbought conditions, potentially signaling a near-term pause or pullback. However, the MACD maintains positive momentum on this timeframe. On the 4-hour chart, the ADX at 15.15 indicates a lack of strong trend, suggesting choppy price action, while the daily chart exhibits a strong bearish trend (ADX 40.98). This divergence across timeframes necessitates a cautious approach. Key levels to watch are the immediate resistance at $24,977.09 and support at $24,933.09. A clear break above resistance could target $25,001.26, while a fall below support might lead to a test of $24,889.09.
The correlation with the US Dollar Index (DXY), currently at 99.38, is also a significant factor. A rising DXY often correlates with a weaker Nasdaq100, as it can signal tighter financial conditions or a flight to safety. The current slight uptick in the DXY suggests it could exert some downward pressure on the tech-heavy index. Furthermore, the broader equity market, represented by the S&P 500 at 6754.65, shows a modest gain, indicating that risk appetite is not entirely extinguished, but the Nasdaq100's own technical signals suggest caution is warranted. The price of WTI crude oil, falling to $93.85, might reduce inflation fears, which could be a subtle positive for growth stocks, but this is overshadowed by the immediate technical resistance.
The market participants are clearly at a crossroads, with short-term bullish signals clashing with longer-term bearish trends. The Nasdaq100's current position near $24,953.52 is a critical test of its resolve. The confluence of indicators on the 1-hour chart, such as the RSI at 71.43, points to potential exhaustion. However, the ADX at 15.15 on the 4-hour chart suggests a lack of commitment to a directional move, indicating a period of consolidation is more likely than a strong breakout in either direction. This environment calls for patience and a disciplined approach to trading, focusing on confirmed signals rather than anticipating moves.
Ultimately, the Nasdaq100's path forward hinges on its ability to overcome immediate resistance at $24,977.09 or defend support at $24,933.09. The conflicting technical signals across different timeframes - bullish divergence on the daily MACD versus bearish trend strength on the same chart, and neutral ADX on the 4H - create an environment ripe for volatility. Traders must remain vigilant, paying close attention to price action at these key levels and seeking confirmation from multiple indicators before making any significant moves. The broader economic backdrop, particularly Federal Reserve policy expectations and the direction of the US Dollar, will continue to be pivotal in shaping the overall market sentiment.
Frequently Asked Questions: Nasdaq100 Analysis
What happens if Nasdaq100 breaks above $24,977.09 resistance?
A sustained break above $24,977.09, confirmed by strong volume and follow-through, could target $25,001.26. This would invalidate some short-term bearish signals and suggest a continuation of upside momentum.
Is RSI at 71.43 a sell signal for Nasdaq100 right now?
The RSI at 71.43 on the 1-hour chart indicates overbought conditions, suggesting potential for a pullback. However, in strong uptrends, RSI can stay elevated. Confirmation with MACD bearish crossover or a break below support is needed for a reliable sell signal.
What does the ADX reading of 15.15 on the 4H chart mean for Nasdaq100 trend analysis?
An ADX reading of 15.15 signifies a weak trend, indicating that the Nasdaq100 is likely in a ranging or consolidating market. This suggests that breakouts might be less sustained and that price action could be choppy, requiring traders to be more cautious.
How will the Fed's policy expectations affect Nasdaq100 this week?
Market expectations of the Fed holding rates steady amid inflation fears could create volatility. A hawkish tone from the Fed might pressure the Nasdaq100, while dovish commentary could offer support. Current DXY levels near 99.38 reflect this sensitivity.
Track markets in real-time
AI-powered analysis, technical indicators and real-time price data.
Join Our Telegram Channel
Breaking market news, AI analysis and trading signals instantly.
Join Channel