Nasdaq100 Tests $24,166 Support: What the Indicators Say
Nasdaq100 hovers near $24,166 support, with mixed signals from technical indicators. Analysis focuses on key levels and potential trading scenarios.
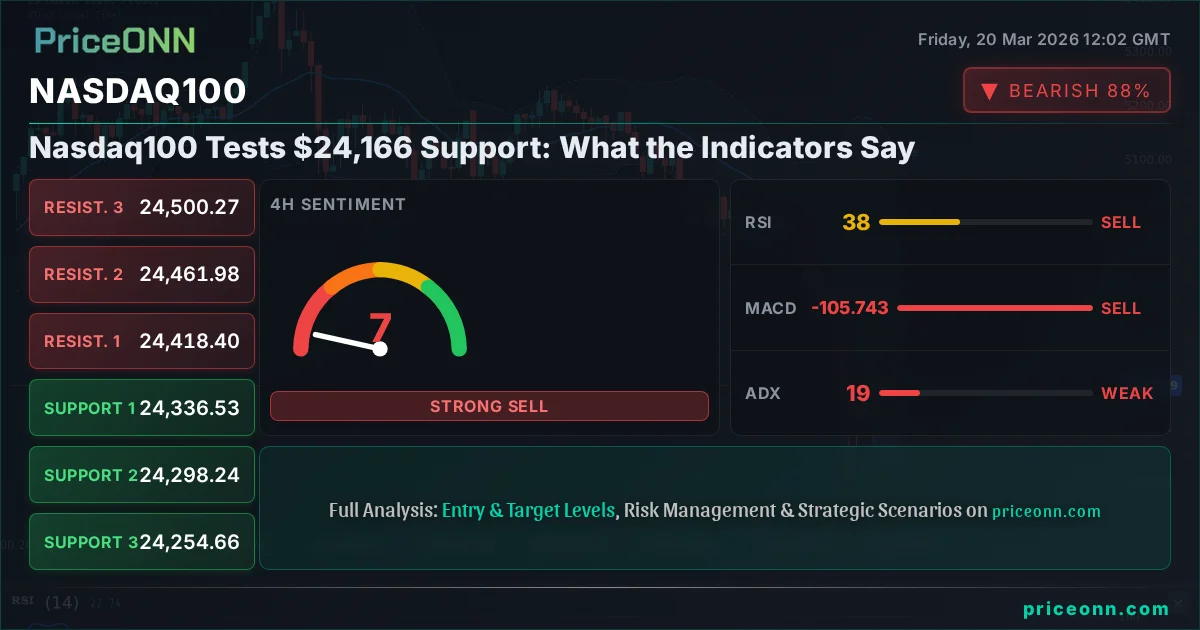
The Nasdaq 100 is currently testing critical support levels near the $24,166 mark, a pivotal point that traders and analysts are closely watching. After a period of notable volatility, the index's ability to hold this level will be crucial in determining its short-term trajectory. With the current price standing at $24,239.13, any significant move below $24,166 could signal further downside, while a firm hold could pave the way for a potential rebound. This analysis delves into the technical indicators and market context to decipher the Nasdaq 100's immediate outlook.
- The Nasdaq 100 is testing support at $24,166, with the current price at $24,239.13.
- The 1H RSI at 39.47 indicates bearish momentum, while the 4H RSI at 38.05 suggests a similar trend.
- ADX readings across timeframes (1H: 27.29, 4H: 19.3, 1D: 35.59) point to a weakening trend in lower timeframes but a strong downtrend on the daily chart.
- Key support levels are identified at $24,120.52 (1H), $24,052.11 (1H), and $23,938.38 (1D), while resistance is seen at $24,239.52 (1H) and $24,561.68 (1D).
- The overall market sentiment, influenced by DXY's strength and a risk-off environment, suggests caution for bullish positions in the Nasdaq 100.
Navigating the Technical Landscape: A Multi-Timeframe Perspective
The Nasdaq 100's current position presents a complex technical picture, demanding a close examination across various timeframes. On the 1-hour chart, the index is showing signs of bearish momentum, with the Relative Strength Index (RSI) at 39.47. This reading suggests that while the market is not yet oversold, the downward pressure is palpable. The Moving Average Convergence Divergence (MACD) histogram is also negative, reinforcing the bearish sentiment in the short term. The Average Directional Index (ADX) at 27.29 indicates a strong downtrend on this timeframe, suggesting that bears are currently in control of the intraday movements. The Stochastic Oscillator, with K at 26.73 and D at 31.82, further supports a bearish outlook, showing %K below %D and indicating potential for further declines.
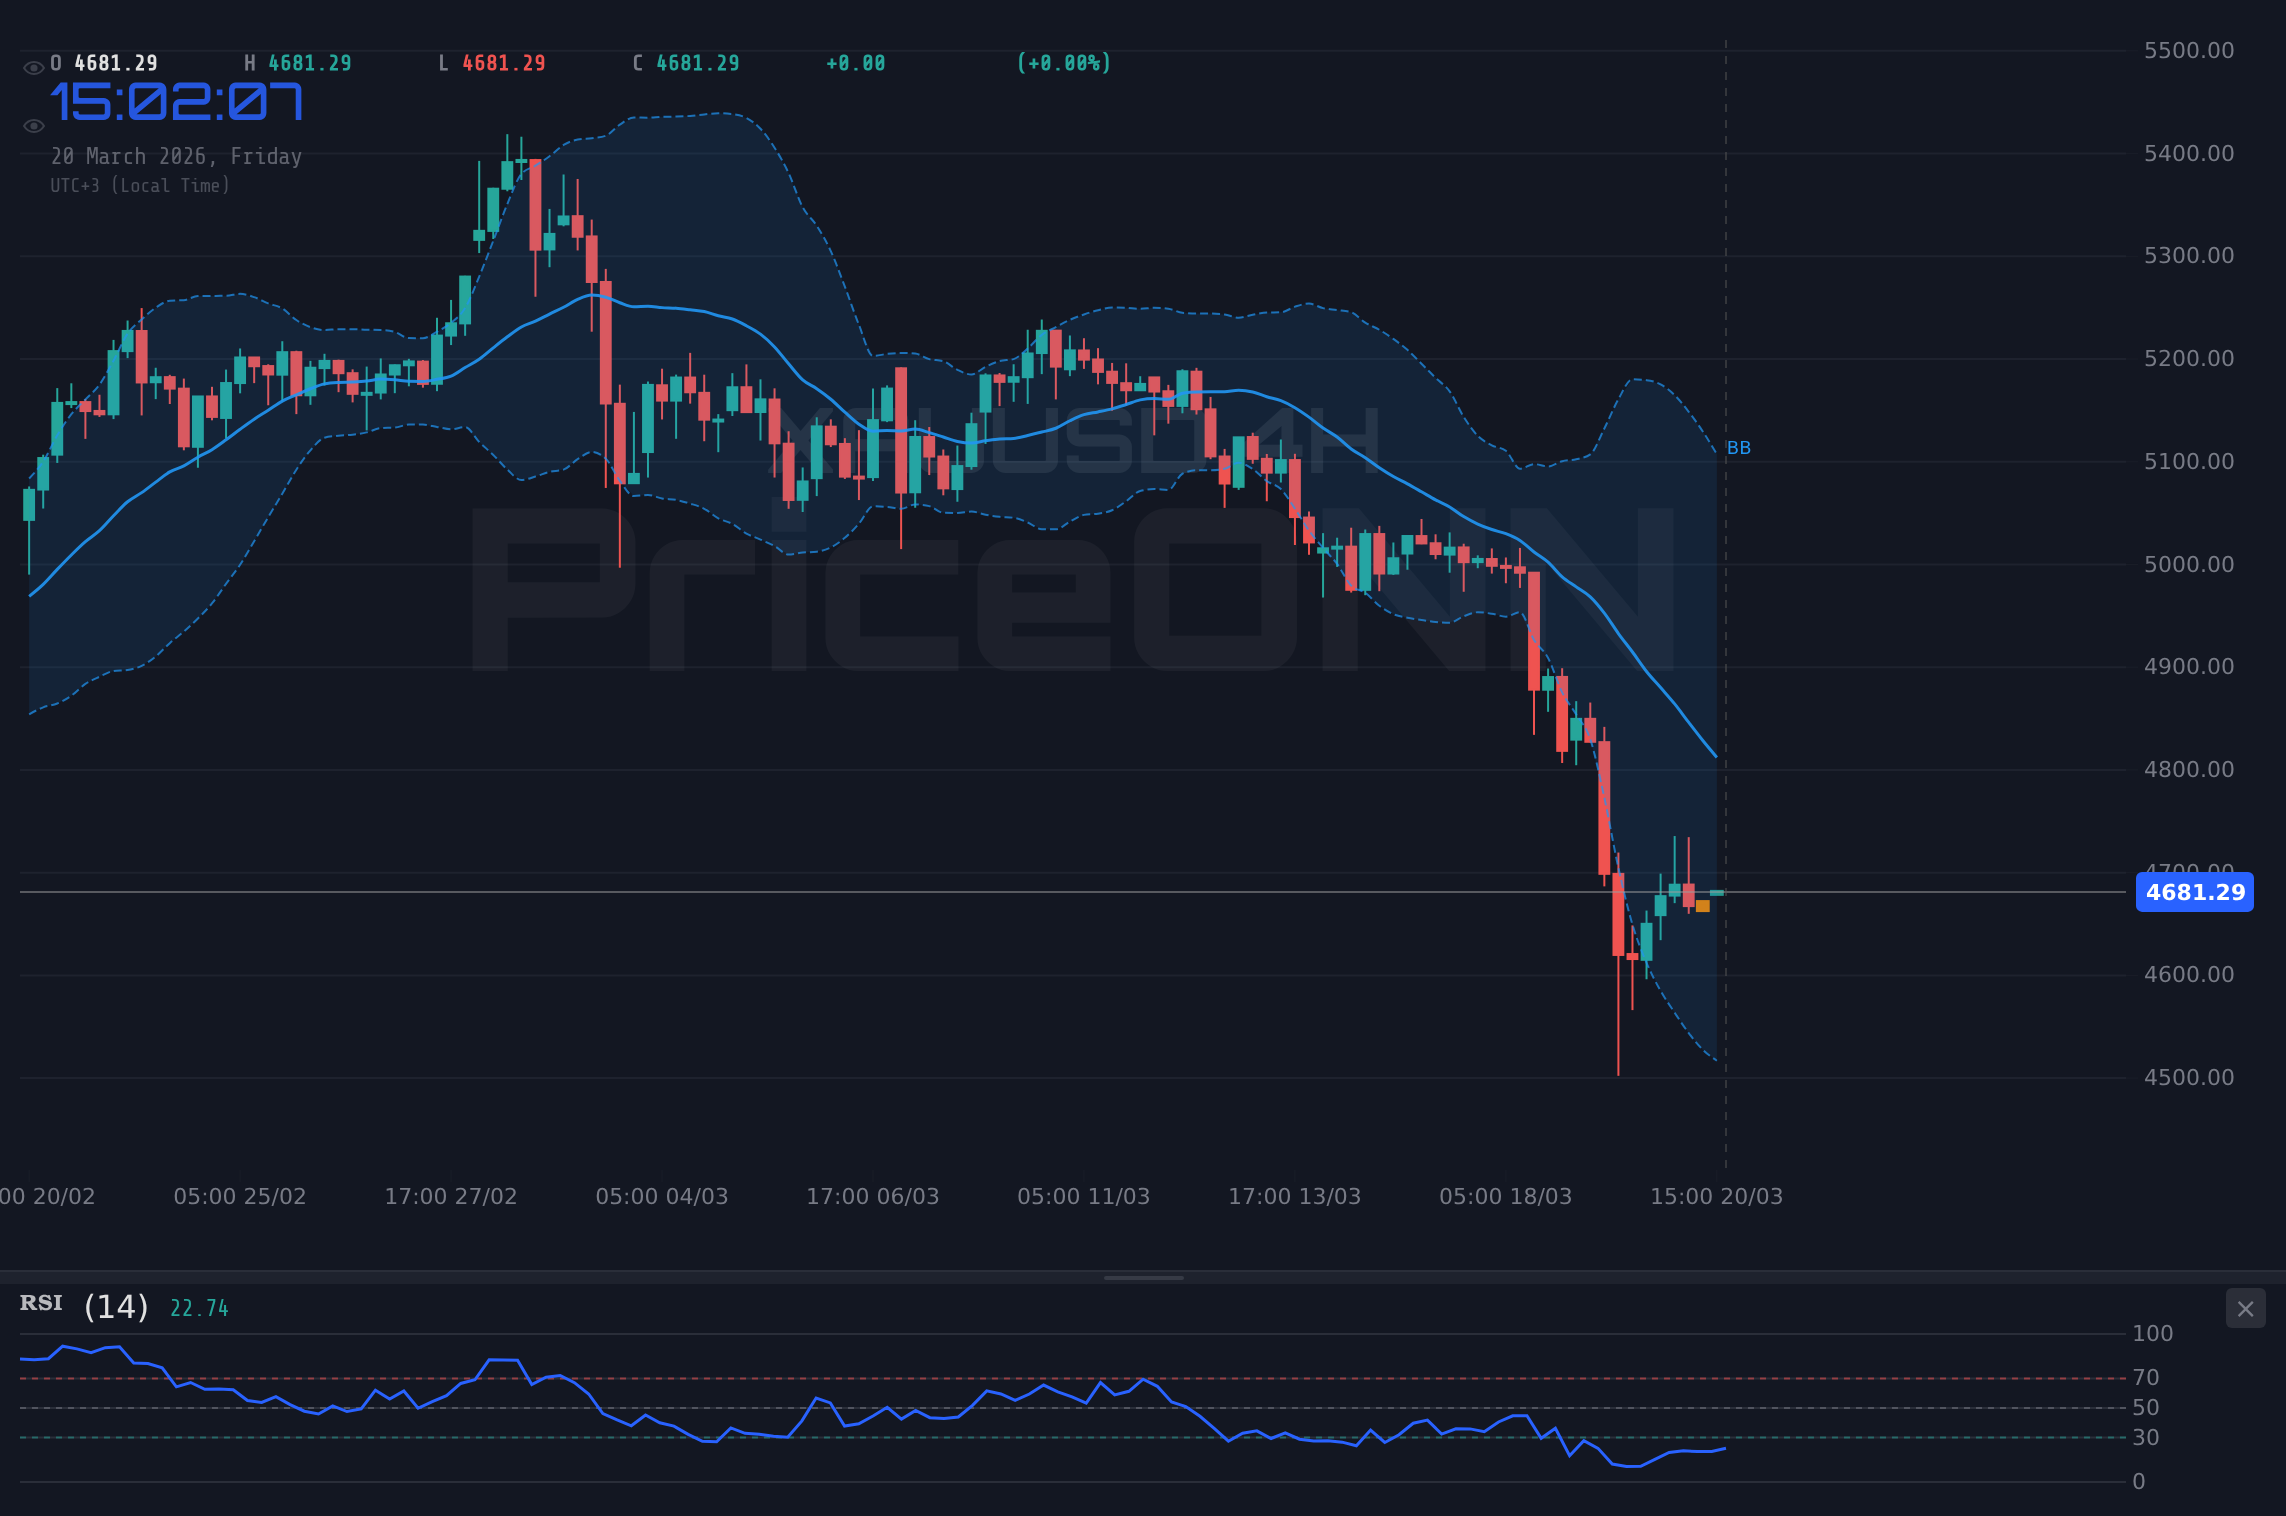
Shifting to the 4-hour timeframe, the technical indicators present a somewhat mixed, yet still predominantly cautious, view. The RSI here is at 38.05, continuing the bearish leaning observed on the hourly chart, though slightly less extreme. The MACD is also showing negative momentum, aligning with the shorter-term trend. However, the ADX at 19.3 suggests a weakening trend strength on this intermediate timeframe, implying that the current downward move might be losing steam or entering a consolidation phase. This is a critical divergence from the stronger trend indicated on the hourly chart. The Stochastic Oscillator, with K at 41.66 and D at 28.12, is showing a bullish signal (%K > %D), which contradicts the RSI and MACD, highlighting the choppiness and potential for ranging behavior in this timeframe.
On the daily chart, the picture solidifies into a more defined bearish trend. The RSI stands at 40.29, reinforcing the notion of downward pressure without yet signaling an oversold condition that might invite significant buying interest. The MACD continues its negative trajectory, and the ADX at 35.59 confirms a strong downtrend. This indicates that the larger trend remains bearish, and any short-term bounces might be viewed as opportunities for sellers to re-enter the market. The Stochastic Oscillator on the daily chart, with K at 26.88 and D at 44.83, also presents a bearish signal (%K < %D), aligning with the overall daily trend. This confluence of daily indicators suggests that the path of least resistance for the Nasdaq 100 is currently to the downside, making the $24,166 support level a critical battleground.
Key Levels and Price Action Dynamics
The current price of the Nasdaq 100 at $24,239.13 places it precariously close to several key technical levels. On the 1-hour chart, the immediate support is identified at $24,239.52, followed by $24,120.52 and $24,052.11. These levels represent areas where buying interest might emerge, potentially halting or reversing the current downtrend. Conversely, resistance on the hourly chart is found at $24,239.52 (which is also the current price point, creating a tight range), then $24,290.11, and $24,358.52. The proximity of immediate resistance to the current price suggests that any upward movement might face stiff opposition, making a breakout above these levels a significant event.
Looking at the 4-hour chart, the support levels are situated further down at $24,336.53, $24,298.24, and $24,254.66. The current price of $24,239.13 is actually below the first 4-hour support, which is unusual and might indicate a short-term anomaly or a strong immediate sell-off. This highlights the urgency for the bulls to defend the $24,166 vicinity. Resistance on this timeframe is seen at $24,418.40, $24,461.98, and $24,500.27. The daily chart presents more significant support zones at $24,166.02, $23,938.38, and $23,770.36. These longer-term support levels are crucial for assessing the overall health of the index. Resistance on the daily chart looms higher, at $24,561.68, $24,729.70, and $24,957.34, indicating substantial upside potential should a strong bullish reversal materialize.
The interplay between these levels is critical. A hold above $24,166 on the daily chart would be a significant bullish signal, potentially leading to a retest of the $24,561.68 resistance. However, a decisive break below $24,166, particularly on increasing volume, would likely trigger a cascade towards the subsequent support levels. Traders are keenly observing whether the current price action is a mere pause in an uptrend or the beginning of a more sustained correction. The ADX readings provide context: while the 1H and 4H charts suggest weakening trends (ADX below 20), the daily ADX at 35.59 confirms a robust downtrend. This conflict in trend strength across timeframes underscores the current market indecision and the importance of price action at these key levels.
Correlation Analysis: DXY and Risk Appetite
The performance of the Nasdaq 100 is often intertwined with broader market sentiment, particularly the strength of the US Dollar Index (DXY) and overall risk appetite. Currently, the DXY is trading at 99.17, showing a bullish trend on the daily chart with a strength of 92% and an ADX of 34.64. This strengthening dollar typically exerts downward pressure on risk assets like the Nasdaq 100, as it makes US assets more expensive for foreign investors and can signal tighter financial conditions or a flight to safety. The fact that the Nasdaq 100 is experiencing weakness while the DXY is strong aligns with this inverse correlation, suggesting that capital might be rotating away from growth-oriented tech stocks towards the perceived safety of the dollar.
Furthermore, the performance of the S&P 500 and Nasdaq 100 themselves provides insight into risk appetite. Both major US indices are showing significant downward pressure across multiple timeframes. The S&P 500 is down 0.47% at 6585.1, with a strong bearish trend (100% strength) on the daily chart and an ADX of 44.21. Similarly, the Nasdaq 100, which we are focusing on, is down 0.63% at $24,239.13, also exhibiting a strong bearish daily trend. This widespread decline in major US equity indices indicates a clear risk-off sentiment prevailing in the market. When 'risk-on' assets like tech stocks falter, investors often seek refuge in safer assets, which can include the US dollar, Treasuries, and sometimes gold, although gold's reaction can be complex. The current environment, characterized by a strong DXY and falling equity indices, suggests that any rallies in the Nasdaq 100 might be met with selling pressure as market participants prioritize capital preservation over aggressive growth plays.
The conflict between the hourly/4-hour ADX readings suggesting weaker trends and the daily ADX confirming a strong downtrend warrants careful observation. It implies that while intraday and medium-term price action might be volatile or range-bound, the overarching daily trend remains bearish. This dynamic could lead to sharp, short-lived rallies within a broader downtrend, often referred to as 'bear market rallies' or 'dead cat bounces'. For the Nasdaq 100 to signal a genuine trend reversal, it would need to not only hold key support levels like $24,166 but also decisively break above significant resistance points, accompanied by improving risk appetite and potentially a softening DXY. Until then, the correlation with a stronger dollar and weaker equity markets will likely continue to weigh on the index.
Trade Scenarios: Navigating Uncertainty
Bearish Scenario: Testing the Depths
65% ProbabilityNeutral Scenario: Consolidation Around Support
25% ProbabilityBullish Scenario: Rebound from Support
10% ProbabilityThe current technical setup suggests that the bearish scenario holds the highest probability, given the confluence of daily downtrend signals and the prevailing risk-off market sentiment. A daily close below the $24,166 support level would be a significant confirmation of this bearish outlook, potentially triggering a move towards the $23,938.38 and $23,770.36 levels. Invalidation of this bearish thesis would require a strong daily close back above the immediate hourly resistance, ideally above $24,358.52, which would then open the door for a potential test of higher resistance levels like $24,561.68.
A neutral scenario, characterized by consolidation between the $24,166 support and the $24,239.52 immediate resistance, is also plausible, especially if intraday volatility subsides and market participants await further catalysts. This range-bound play would likely involve choppy price action, making it challenging for trend-following strategies but potentially offering opportunities for range traders. The probability assigned to this scenario is moderate, reflecting the current indecision indicated by conflicting signals across different timeframes. The bullish scenario, while holding the lowest probability at this juncture, cannot be entirely dismissed. It would require a decisive break above key resistance levels, coupled with a shift in market sentiment and potentially a weakening DXY.
Ultimately, the immediate future of the Nasdaq 100 hinges on its ability to hold the $24,166 support. Traders should be looking for confirmation signals before committing to significant positions. For a bearish stance, a confirmed break below support with increasing volume would be ideal. For a bullish outlook, a clear break above resistance with sustained buying pressure would be necessary. The current ADX readings, particularly the strong daily ADX of 35.59 contrasted with weaker hourly/4-hour readings, suggest that while a downtrend is in place, the conviction might be wavering, leading to potential volatility around these key price points. Patience and risk management will be paramount in navigating this uncertain environment.
The Road Ahead: What to Watch
Looking forward, several factors will influence the Nasdaq 100's path. The ongoing strength of the US Dollar Index (DXY) at 99.17, coupled with the bearish sentiment evident in the S&P 500 and Nasdaq 100 daily charts, suggests that the risk-averse environment is likely to persist in the near term. Any signs of a potential shift in Federal Reserve policy expectations, though not immediately apparent, could alter this dynamic. For instance, if upcoming economic data were to significantly deviate from expectations, either boosting inflation fears or signaling a sharper slowdown, it could trigger a reassessment of Fed rate cut probabilities, impacting both the dollar and equity markets.
Technically, the $24,166 support level remains the immediate focal point. A failure to hold this level could accelerate selling pressure, bringing the $23,938.38 and $23,770.36 support levels into play. On the upside, a decisive breach of the $24,358.52 hourly resistance, followed by a sustained move above the daily resistance at $24,561.68, would be required to invalidate the current bearish outlook and signal a potential trend change. The conflicting signals from different timeframes, particularly the strong daily downtrend versus weaker intermediate-term trend strength indicators, suggest that choppy price action is likely until a clearer catalyst emerges.
Given the current ADX readings - a strong 35.59 on the daily chart indicating a robust downtrend, but weaker readings on the 1H (27.29) and 4H (19.3) charts suggesting potential ranging or trend exhaustion - traders should exercise caution. The RSI values (around 40 on daily and hourly, 38 on 4H) indicate room for further downside before hitting oversold territory, but also suggest that the selling momentum might not be overwhelming. Therefore, a strategy focused on confirmation rather than preemptive moves would be prudent. Waiting for a clear break of either the key support or resistance levels, accompanied by confirming volume and broader market sentiment shifts, will be essential for identifying high-probability trading setups in the coming sessions.
| Indicator | Value | Signal | Interpretation |
|---|---|---|---|
| RSI (14) | 39.47 | Bearish | 39.47 indicates bearish momentum on 1H, suggesting room for further downside before oversold. |
| MACD Histogram | -0.75 | Bearish | Negative MACD histogram on 1H suggests selling pressure is building. |
| Stochastic | K=26.73, D=31.82 | Bearish | %K below %D on 1H indicates a bearish signal, reinforcing downward pressure. |
| ADX | 27.29 | Strong Trend | 27.29 on 1H confirms a strong downtrend, suggesting momentum is with sellers. |
| Bollinger Bands | Price Below Mid | Bearish | Price trading below the middle band on 1H indicates a bearish bias. |
Frequently Asked Questions: Nasdaq100 Analysis
What happens if Nasdaq100 breaks below the $24,166 support level?
A break below $24,166 on a daily closing basis would likely trigger further selling pressure, potentially targeting the $23,938.38 support level. This would confirm the bearish outlook suggested by the daily ADX of 35.59 and indicate a continuation of the downtrend.
Should I consider buying Nasdaq100 at current levels around $24,239.13 given the RSI is below 40?
Buying at current levels requires caution. While RSI is below 40, it's not yet in oversold territory, and the daily trend remains strongly bearish. A more prudent approach would be to wait for a confirmed bounce from support around $24,166 or a decisive break above $24,239.52 resistance, with confirmation from volume and other indicators.
Is the MACD histogram showing a sell signal for Nasdaq100 at $24,239.13?
Yes, the negative MACD histogram on the 1-hour chart at $24,239.13 indicates bearish momentum. This aligns with the overall bearish sentiment and suggests that selling pressure is present, reinforcing the downside risk near current levels.
How will the strengthening DXY at 99.17 affect Nasdaq100 this week?
The DXY at 99.17, showing a strong daily uptrend, generally correlates inversely with risk assets like the Nasdaq 100. This strength suggests continued pressure on the index, as a stronger dollar can lead to tighter financial conditions and a reduced appetite for growth stocks.
Track markets in real-time
AI-powered analysis, technical indicators and real-time price data.
Join Our Telegram Channel
Breaking market news, AI analysis and trading signals instantly.
Join Channel