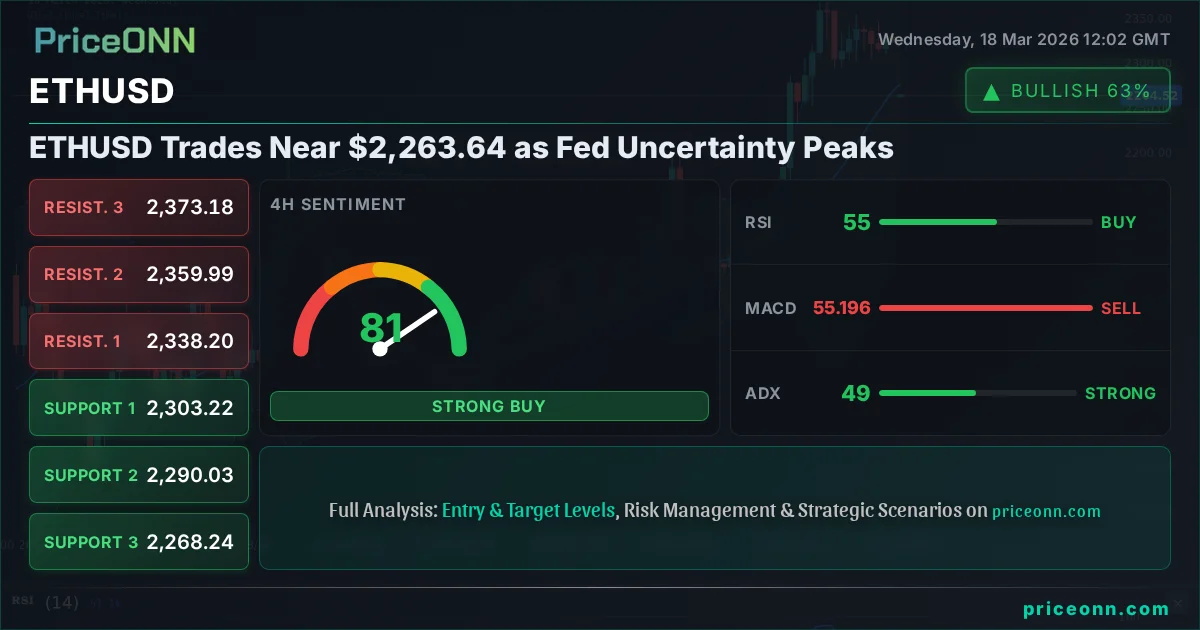
The cryptocurrency market is on tenterhooks as Ethereum (ETHUSD) trades precariously near the $2,263.64 mark. This critical level comes under scrutiny as traders and investors brace for a pivotal Federal Reserve meeting, where interest rate decisions and future policy guidance could significantly sway risk appetite across all asset classes, including digital assets. While the broader market sentiment remains cautiously optimistic, the technical indicators for ETHUSD present a complex, often conflicting, picture, demanding a nuanced approach rather than a blind directional bet. The interplay between macroeconomic uncertainty and the intrinsic volatility of the crypto space creates a fascinating, albeit challenging, trading environment.
- ETHUSD RSI at 33.49 signals oversold conditions on the 1H chart, but the 1D trend remains neutral.
- Critical support for ETHUSD sits at $2,202.77, tested amidst strong downward momentum (ADX 26.59 on Daily).
- The MACD histogram shows negative momentum on 1H and 4H, suggesting selling pressure may persist in the short term.
- Fed rate expectations are driving ETHUSD correlation with DXY, currently at 99.3, which adds to broader market caution.
The Federal Reserve's upcoming policy announcement looms large, casting a shadow of anticipation over global financial markets, and the digital asset space is no exception. While the Fed is widely expected to maintain its current interest rate stance, the accompanying economic projections and forward guidance will be scrutinized for any hints of future policy shifts. Any indication of a more hawkish stance, perhaps due to persistent inflation concerns, could strengthen the US Dollar (DXY, currently at 99.3) and dampen speculative asset classes like cryptocurrencies. Conversely, a dovish pivot or a confirmation of a stable rate environment might provide some relief, though the market's reaction will ultimately depend on the finer details of the Fed's outlook. This uncertainty is a key driver behind the current choppy price action observed across many markets, including ETHUSD.
Navigating the Technical Landscape: ETHUSD's Current Stance
The Short-Term Squeeze: 1-Hour Chart Dynamics
On the 1-hour timeframe, ETHUSD is exhibiting signs of oversold conditions, a common signal for potential short-term bounces. The Relative Strength Index (RSI(14)) stands at 33.49, firmly within the oversold territory. Historically, when the RSI dips this low on shorter timeframes, it often precedes a temporary price recovery as short-term traders look to capture quick gains. However, this signal must be viewed with caution. The MACD is currently showing negative momentum, with the MACD line below its signal line, indicating that bearish sentiment still has a grip on the intraday price action. Furthermore, the Stochastic Oscillator (K=19.35, D=30.68) also points to a potential short-term reversal, but the %K line remains below the %D line, suggesting the downward momentum hasn't fully exhausted itself. The ADX at 17.49 indicates a weak trend, implying that any short-term move might lack conviction and could be easily reversed. This suggests that while a bounce is possible, it might be shallow and short-lived without stronger confirmation.
The Bollinger Bands on the 1-hour chart further corroborate the oversold narrative, with the price trading below the lower band. This often signifies a period of strong selling pressure that may be unsustainable in the very short term. However, it can also signal a potential breakdown in momentum. The proximity of the current price to the $2,263.64 level is crucial. A decisive break below the immediate support at $2,278.75 could trigger further downside, while a recovery above the resistance at $2,278.75 might lead to a test of higher levels. The overall signal for the 1-hour timeframe leans heavily towards 'SELL' (1 Buy, 7 Sell, 0 Neutral), underscoring the short-term bearish bias despite the oversold RSI reading. This conflict between a potential bounce indicator (RSI) and prevailing negative momentum (MACD, Stochastic) highlights the intraday choppiness traders are currently facing.
The Medium-Term Battleground: 4-Hour Chart Insights
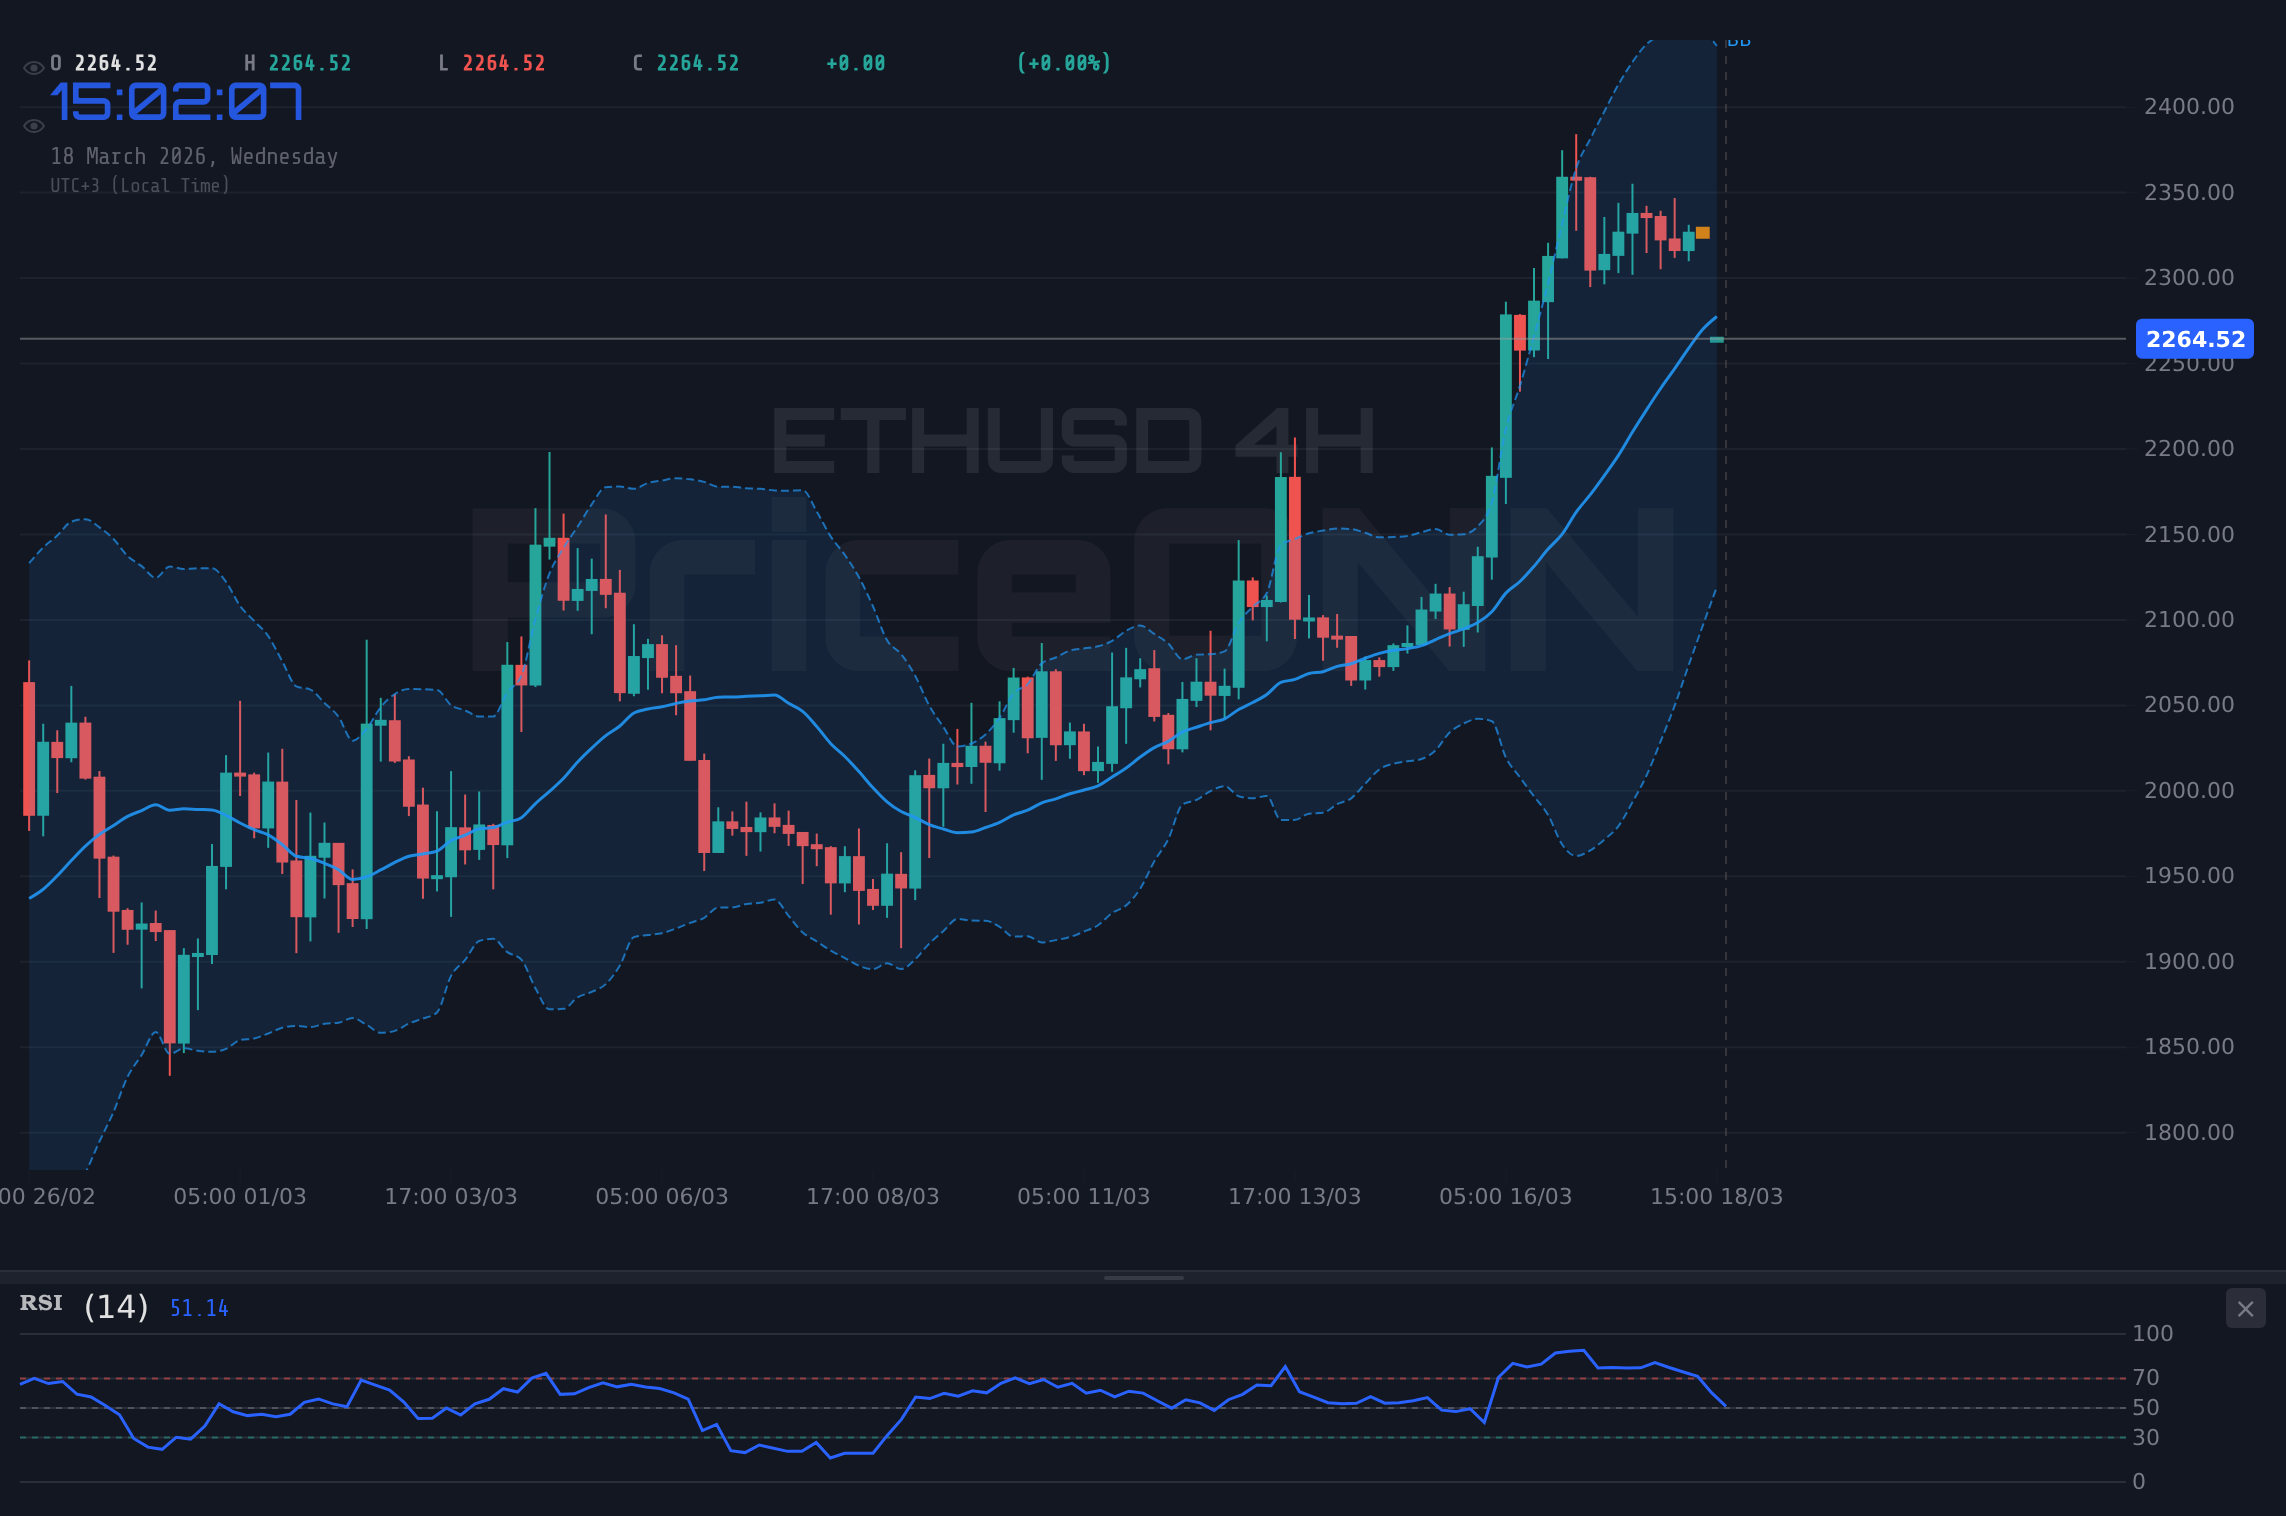
Shifting to the 4-hour chart, the picture becomes more complex, revealing a tug-of-war between bearish short-term momentum and a surprisingly strong uptrend indicated by the ADX. ETHUSD is currently trading below the middle Bollinger Band, suggesting a bearish inclination in this timeframe. The MACD remains in negative territory, reinforcing the idea of selling pressure, while the Stochastic Oscillator (K=25.81, D=57.96) also shows a bearish signal with %K below %D. However, the RSI(14) at 54.86 is hovering in the neutral zone, leaning slightly bullish and indicating that the market is neither overbought nor oversold, allowing for potential upward movement. This neutral RSI reading contrasts sharply with the more bearish signals from MACD and Stochastic.
What's truly striking here is the ADX value of 49.17. This indicates an exceptionally strong trend, which, given the other indicators, appears to be a continuation of an underlying bullish structure that is currently experiencing a pullback. This strong trend reading suggests that any move, whether up or down, could be quite significant once established. The 'SELL' signal on the 4-hour chart (0 Buy, 8 Sell, 0 Neutral) might seem contradictory to the strong ADX, but it likely reflects the short-term bearish momentum that is battling against a potentially larger, established trend. The key support levels to watch on this timeframe are $2,290.03 and $2,268.24. A failure to hold these levels could signal a deeper correction, but the strong ADX suggests that if a bullish trend is indeed in play, this might just be a healthy consolidation before the next leg higher. The current price action around $2,263.64 is therefore a crucial test for this hypothesis.
The Daily Perspective: Long-Term Trend and Macro Influence
On the daily chart, ETHUSD presents a neutral trend with a 50% power rating, indicating a period of consolidation or indecision. The RSI(14) is at 55.2, comfortably in the neutral zone and showing a slight upward bias, suggesting that while selling pressure has eased, there isn't yet strong conviction for a sustained rally. The MACD is positive, with the MACD line above its signal line, providing a more optimistic outlook than the shorter timeframes, hinting at underlying bullish momentum. This positive MACD is a significant divergence from the 1H and 4H charts.
The Stochastic Oscillator (K=80.65, D=72.9) is in the overbought territory, indicating that a potential pullback could be imminent if buyers fail to push prices higher. This overbought reading on the daily chart, coupled with the neutral RSI, suggests that the market might be reaching a temporary ceiling. The ADX at 27.29 confirms a strong trend, but its directionality is less clear on this timeframe. The Bollinger Bands are trading above the middle band, generally a bullish sign, but the price is nearing the upper band, which could act as resistance. The overall signal for the daily timeframe is 'BUY' (7 Buy, 1 Sell, 0 Neutral), primarily driven by the positive MACD and the strong ADX trend reading. This daily bullishness, however, must contend with the immediate bearish pressures seen on the shorter timeframes and the overarching macroeconomic uncertainty. The key support levels on the daily chart are $2,202.77 and $2,150.23, while resistance lies at $2,381.69 and $2,427.67. The current price of $2,263.64 sits in a critical zone where short-term bearish pressures meet longer-term bullish potential.
Macroeconomic Crosscurrents: The Fed's Shadow and Dollar's Dance
The Dollar Index (DXY) Factor
The US Dollar Index (DXY) is currently trading at 99.3, showing a slight upward bias. Historically, a strengthening dollar often correlates with a decrease in the prices of dollar-denominated commodities and risk assets like cryptocurrencies, as it makes these assets more expensive for holders of other currencies. The DXY's current position, with a strong daily trend (ADX 34.21) and a neutral 4-hour trend, suggests it could be a significant factor influencing ETHUSD's direction. The daily chart shows RSI at 61.43, indicating a comfortably bullish trend for the dollar, while the 1-hour chart shows a brief pullback with RSI at 51.35. This duality suggests that the dollar's strength might be consolidating before potentially resuming its upward trend, which would typically put pressure on ETHUSD. The resistance level for the DXY at 99.57 is a key point to monitor; a break above this could signal further dollar strength and increased headwinds for ETHUSD.
Geopolitical Tensions and Inflationary Whispers
Recent geopolitical developments, such as lingering tensions in the Strait of Hormuz and the ongoing geopolitical landscape, continue to create ripples of uncertainty across global markets. While not directly impacting ETHUSD in the same way as oil prices, these tensions contribute to a general risk-off sentiment that can spill over into speculative assets. Furthermore, the persistent narrative around inflation, even as the Fed aims to control it, keeps a baseline level of caution in the market. If inflation proves more stubborn than anticipated, it could force the Fed's hand towards a more hawkish policy, which would likely strengthen the dollar and pressure ETHUSD. Conversely, any signs of de-escalation in geopolitical hotspots could reduce safe-haven demand for the dollar and potentially benefit risk assets. The market is thus caught between the dual forces of potential Fed action and ongoing global uncertainties, making ETHUSD's path forward highly dependent on these macro factors.
The upcoming Federal Reserve meeting is a significant wildcard. Any unexpected hawkish signals regarding inflation or interest rates could trigger a sharp sell-off in risk assets, including ETHUSD. Traders should remain vigilant and prepared for increased volatility around the announcement.
Impact on Risk Appetite
The interplay between Fed policy expectations, geopolitical risks, and inflation concerns directly impacts overall market risk appetite. When uncertainty is high, investors tend to move towards safer assets like the US Dollar or Treasury bonds, leading to outflows from riskier assets such as equities and cryptocurrencies. The current environment, characterized by mixed technical signals on ETHUSD and a cautious macro backdrop, suggests that risk appetite is fragile. A strong dollar, fueled by a hawkish Fed or geopolitical escalation, would likely exacerbate this risk-off sentiment, leading to further pressure on ETHUSD. Conversely, a more dovish Fed and a de-escalation of global tensions could foster a more risk-on environment, potentially supporting a recovery in Ethereum. The price action around $2,263.64 is therefore taking place in a macro environment that demands careful risk management.
Trading Scenarios for ETHUSD
Given the conflicting signals across different timeframes and the overarching macroeconomic uncertainty, a multi-scenario approach is essential for navigating ETHUSD. The current price action around $2,263.64 represents a critical juncture, and the market's reaction to key support and resistance levels will dictate the short-to-medium term trajectory.
Bearish Scenario: Downside Continuation
65% ProbabilityNeutral Scenario: Consolidation and Range-Bound Action
25% ProbabilityBullish Scenario: Recovery and Upside Momentum
10% ProbabilityKey Levels to Monitor
Frequently Asked Questions: ETHUSD Analysis
What happens if ETHUSD breaks below the $2,202.77 support level?
A break below the critical daily support at $2,202.77 would likely trigger a bearish scenario, potentially leading to a test of the $2,150.23 level. This would signal a continuation of the prevailing downward momentum seen on shorter timeframes.
Should I consider buying ETHUSD at current levels near $2,263.64 given the oversold RSI on the 1H chart?
Caution is advised. While the 1H RSI is oversold, the negative MACD and strong ADX on the 4H chart suggest short-term buying might be risky. A more prudent approach would be to wait for confirmation, such as a hold of $2,202.77 support or a clear breakout above $2,278.75 resistance.
Is the RSI at 33.49 on the 1-hour chart a reliable buy signal for ETHUSD right now?
The RSI at 33.49 indicates oversold conditions on the 1-hour chart, suggesting a potential for a short-term bounce. However, it's not a standalone buy signal. The negative MACD and strong ADX trend readings on higher timeframes mean this oversold condition could persist or lead to a shallow bounce before further downside.
How might the upcoming Federal Reserve decision impact ETHUSD's price around $2,263.64?
A hawkish Fed decision, signaling persistent inflation or delayed rate cuts, could strengthen the DXY and pressure ETHUSD downwards, potentially testing support levels. Conversely, a dovish tone might boost risk appetite, supporting a move towards resistance levels like $2,381.69.
The path forward for ETHUSD hinges on a delicate balance between short-term technical pressures and longer-term bullish potential, all while navigating the ever-present influence of macroeconomic events. The $2,263.64 level represents a crucial battleground. Traders must remain disciplined, manage their risk meticulously, and wait for clear signals rather than chasing volatile intraday moves. The market always provides opportunities; patience and a well-defined strategy are the keys to capitalizing on them.
Track markets in real-time
AI-powered analysis, technical indicators and real-time price data.
Join Our Telegram Channel
Breaking market news, AI analysis and trading signals instantly.
Join Channel