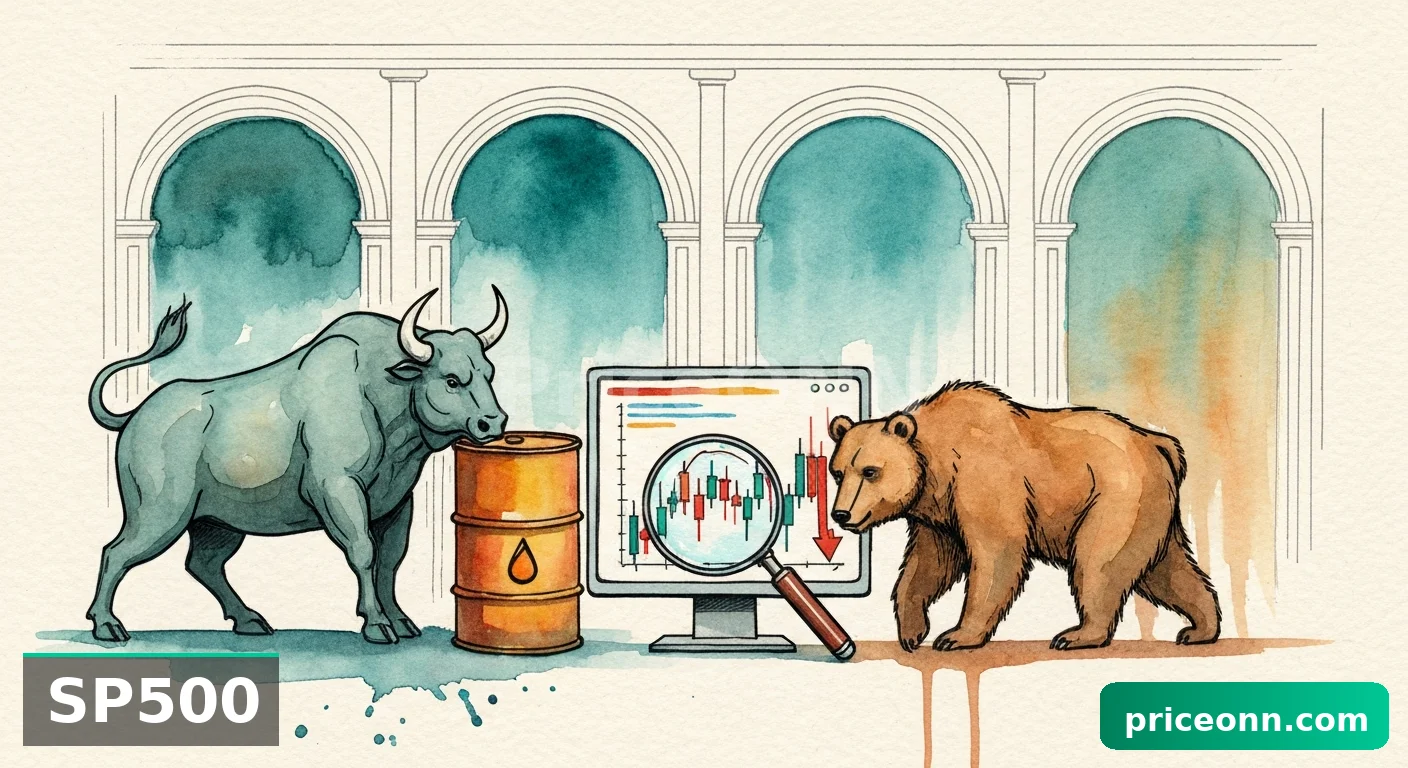
SP500 Tests $6,734.10 Resistance: Navigating Choppy Waters
The SP500 hovers near $6,734.10, facing resistance amid mixed signals. ADX 14.73 suggests a ranging market, demanding patience and risk management for traders.
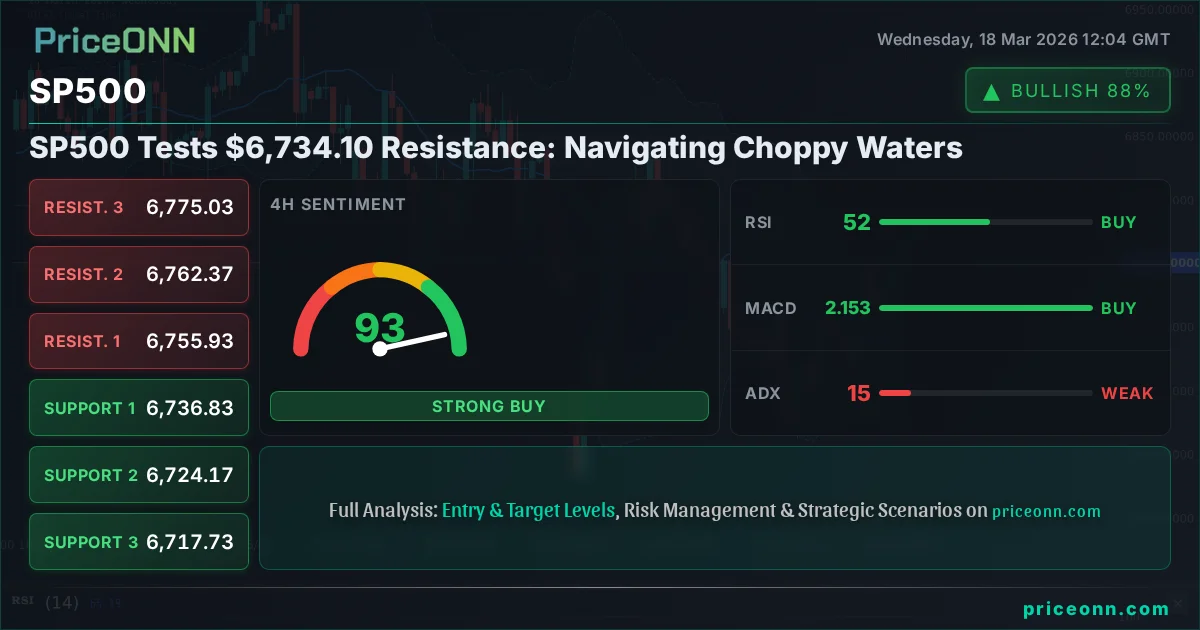
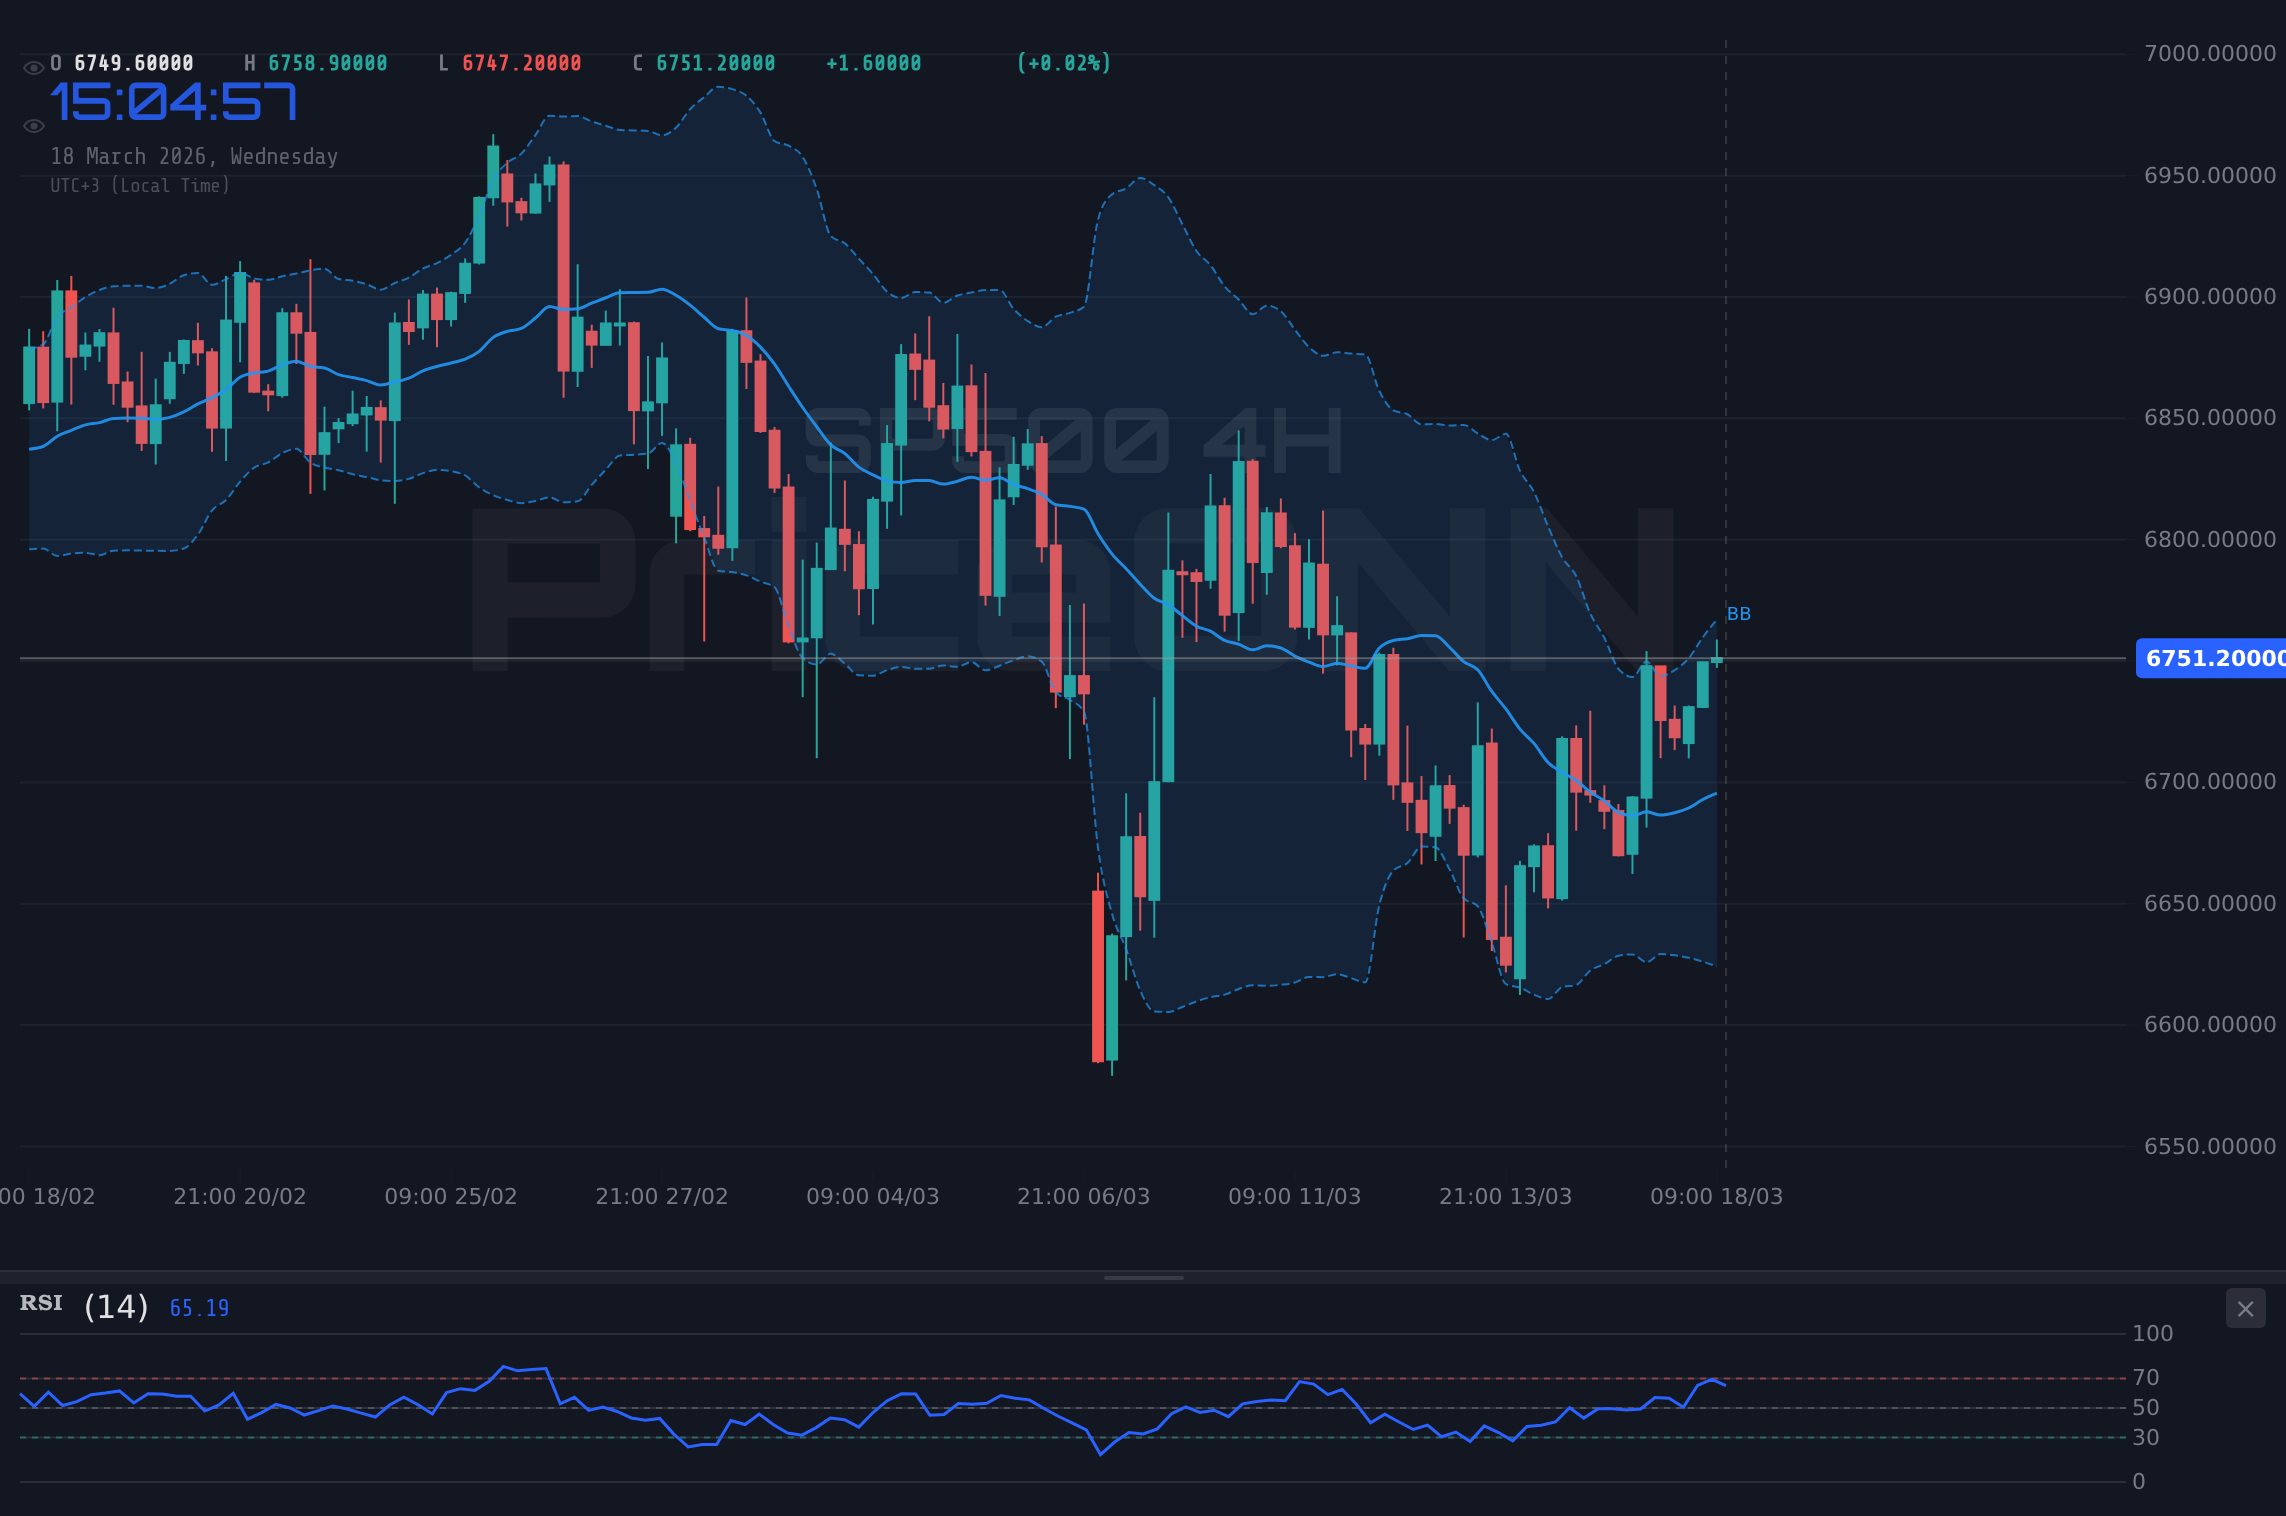
The SP500 is currently trading at $6,734.10, finding itself at a critical juncture as it approaches a significant resistance level. This price point, $6,734.10, has become a focal area after a period of consolidation, and the market's next move hinges on whether buyers can overcome this barrier or if sellers will regain control. The prevailing technical indicators paint a picture of indecision, with a weak trend strength suggested by an ADX reading of 14.73, indicating a market that is currently choppy rather than trending strongly. This environment calls for a high degree of caution and a disciplined approach, as the potential for false breakouts or reversals is elevated.
- The SP500 is currently trading at $6,734.10, approaching a key resistance zone.
- ADX at 14.73 indicates a weak trend, suggesting a choppy, non-directional market environment.
- RSI at 53.68 shows neutral momentum on the 1H chart, while the 1D RSI at 44.07 leans bearish.
- Key support is identified at $6,717.73, with resistance looming around $6,762.37.
- A decisive close above resistance or below support is needed to signal a clear directional bias.
The broader market sentiment, as reflected by the DXY (Dollar Index) currently at 99.30, adds another layer of complexity. A strengthening dollar typically puts pressure on risk assets like the SP500, suggesting that any upward momentum might face headwinds from currency markets. Furthermore, the recent surge in US crude oil inventories, coupled with ongoing geopolitical tensions in the Middle East, contributes to an uncertain macroeconomic backdrop. While the Dow Jones Industrial Average saw a slight uptick, closing around 47,000, and Nasdaq also showed some strength, the overall picture for the SP500 is one of cautious consolidation near its immediate resistance.
Understanding the interplay between these factors is crucial for any trader looking to navigate the current SP500 landscape. The lack of a strong directional trend, as evidenced by the low ADX values across multiple timeframes, means that price action will likely be driven by short-term catalysts rather than sustained momentum. This makes identifying clear entry and exit points more challenging, emphasizing the need for robust risk management strategies and patience.
The Tug-of-War at Resistance
The SP500's current position around $6,734.10 places it squarely in the crosshairs of a significant resistance level. On the 1-hour chart, the resistance is clearly defined between $6,754.17 and $6,762.37. A decisive break and hold above this zone would be required to signal a continuation of any upward momentum. However, the technical indicators on this shorter timeframe present a mixed bag. While the Stochastic Oscillator shows a potential for a bullish signal with %K at 48.44 and %D at 78.35, suggesting it's not yet in extreme territory, the MACD is showing negative momentum, with the MACD line below its signal line. This divergence highlights the indecision present in the intraday trading.
The RSI(14) on the 1-hour chart sits at 53.68, comfortably within the neutral zone, offering little clarity on immediate direction. It suggests that neither buyers nor sellers have a firm grip. The ADX, however, is telling a more coherent story at 42.74 on the 1H chart, indicating a strong trend is in play, but this contradicts the weaker ADX readings on longer timeframes. This inconsistency across different timeframes is a hallmark of a market that is consolidating or preparing for a significant move, but the direction remains uncertain. The market is essentially in a holding pattern, waiting for a catalyst.
The Daily Chart's Cautionary Tale
Shifting focus to the daily chart provides a more bearish leaning perspective, or at least a more cautious one. The SP500's current price of $6,734.10 is below the middle Bollinger Band, and the RSI(14) at 44.07 indicates a downward bias, firmly in neutral territory but trending lower. The MACD is also showing negative momentum, with the MACD histogram below the signal line, reinforcing the idea that the path of least resistance might be downwards in the longer term. The ADX on the daily timeframe is at 40.98, signifying a strong trend, but given the price action and other indicators, it points towards a strong downtrend being in play, or at least a strong prevailing sentiment that needs to be respected.
The Stochastic Oscillator on the daily chart (K=46.59, D=40.73) offers a glimmer of hope for the bulls, showing a potential bullish crossover where %K is above %D, suggesting a possible upward movement. However, this signal is not yet confirmed and must be viewed in conjunction with the broader daily picture. The key takeaway from the daily chart is that while intraday traders might find opportunities, the longer-term trend indicators suggest that significant upside might be capped unless a fundamental shift occurs. The proximity to the $6,734.10 resistance level on the daily chart makes any bullish breakout a significant event that requires confirmation.
Intermarket Correlations: The Dollar and Oil's Shadow
The DXY, or Dollar Index, currently trading at 99.30, plays a crucial role in understanding the SP500's potential direction. Historically, a rising DXY often correlates with a weakening SP500, as a stronger dollar can make US exports more expensive and reduce the attractiveness of US equities for foreign investors. With the DXY showing a daily increase of 0.12% and a strong daily uptrend signal (ADX: 34.21), this provides a potential headwind for the SP500. The 1-hour chart for DXY shows positive momentum, reinforcing this short-term bearish correlation for equities.
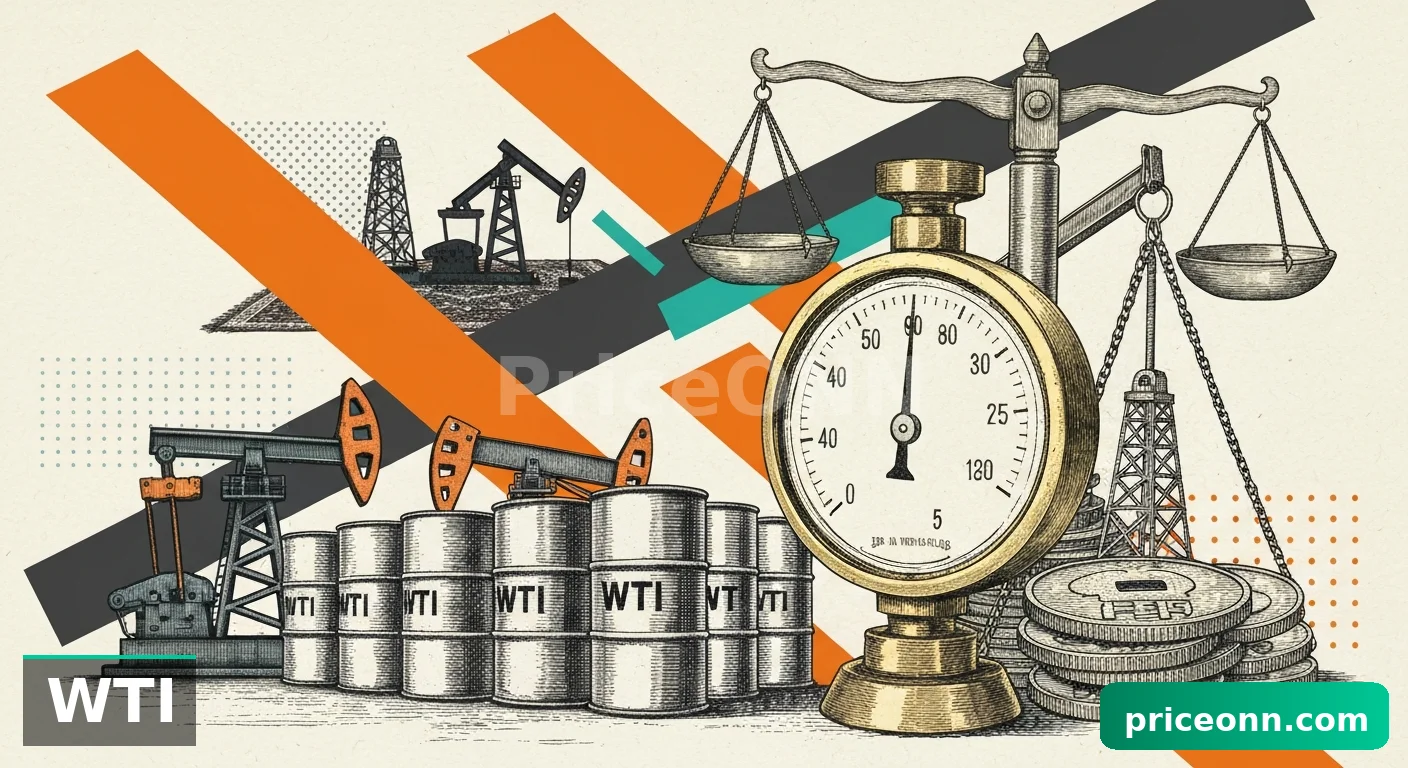
Oil prices, specifically Brent crude at $104.52, also warrant attention. Brent is showing a strong daily uptrend (ADX: 61.26) and is in overbought territory according to its RSI(14) at 82.16. Elevated oil prices can signal rising inflation expectations, which might influence the Federal Reserve's monetary policy decisions. While the Fed is expected to hold rates steady, persistent inflation concerns could lead to delayed rate cuts, impacting market sentiment. The recent news of a surprise build in US crude oil inventories, despite geopolitical tensions, adds volatility to the energy market, making its impact on the SP500 less predictable in the short term. However, the overall uptrend in oil prices suggests that inflationary pressures remain a key factor for market participants to monitor.
The ADX Story: Weak Trend, High Caution
The most consistent signal across the different timeframes for the SP500 is the relatively weak trend strength indicated by the Average Directional Index (ADX). On the 1-hour chart, the ADX is 42.74, which suggests a strong trend, but this is somewhat anomalous compared to the weaker readings on the 4-hour (14.73) and daily (40.98) charts. The 4-hour ADX of 14.73 is particularly telling; such a low value signifies a lack of directional conviction in the market. This means that price movements might be more erratic, characterized by sharp moves in one direction followed by equally sharp reversals, rather than a sustained trend.
This low ADX reading on the 4-hour chart is the primary reason for the 'WATCH_ZONE' decision. It implies that the market is not yet ready for a significant breakout or breakdown. Instead, it suggests a period of consolidation or range-bound trading is more likely. For traders, this means that breakout strategies might be prone to failure, and range-trading strategies, looking for bounces off support and rejections at resistance, could be more appropriate, albeit with tighter stop-losses. Confirmation of a strong trend (ADX above 25) in either direction would be necessary to initiate more aggressive directional trades.
What Does This Mean for Traders?
For intraday traders, the current environment around $6,734.10 presents opportunities, but they are high-risk. Scalpers might look for quick gains by trading within the defined intraday support and resistance levels. However, the lack of strong momentum means that positions should be managed tightly. Swing traders, on the other hand, face a more challenging scenario. The weak trend strength suggests that holding positions for extended periods might be risky without clear directional confirmation. The key level to watch on the upside is the resistance cluster around $6,762.37. A sustained close above this level on the 4-hour chart, supported by rising ADX and other bullish indicators, would be a prerequisite for considering long positions.
Conversely, support is found around $6,717.73 on the 4-hour chart. A decisive break below this level, again confirmed by increasing ADX and bearish momentum across indicators, would signal a potential move lower. Until such a clear signal emerges, patience is the paramount virtue. The market is giving us a lot of information through its indecisiveness, and respecting the current 'WATCH_ZONE' status is crucial. It's a time to observe, wait for confirmation, and avoid forcing trades.
The Path Forward: Levels to Watch
Looking ahead, the SP500's trajectory will likely be dictated by its ability to decisively break through or hold at key levels. The immediate resistance zone lies between $6,754.17 and $6,762.37. A failure to overcome this area could see the index retest the support levels, with the first significant floor at $6,736.83 on the 4-hour chart, followed by $6,724.17. If the bears manage to push through these, the daily support at $6,669.23 becomes the next major target.
On the bullish side, a confirmed breakout above $6,762.37 would be the first hurdle. Beyond that, the next resistance levels to monitor are around $6,775.03 and then $6,785.93. A sustained move above these could signal a return to more bullish sentiment, though the underlying weak trend strength indicated by the ADX would need to be watched closely for confirmation. The overall market sentiment, influenced by central bank policy expectations and geopolitical events, will undoubtedly play a significant role in determining which of these levels ultimately gives way.
Bearish Scenario: Testing Lower Support
65% ProbabilityNeutral Scenario: Consolidation Around $6,734
25% ProbabilityBullish Scenario: Breaking Resistance
10% Probability| Indicator | Value | Signal | Interpretation |
|---|---|---|---|
| RSI (14) 1H | 53.68 | Neutral | Moving sideways, no clear bias |
| MACD 1H | -3.10 | Bearish | Negative momentum, below signal line |
| Stochastic K 1H | 48.44 | Neutral | Mid-range, not extreme |
| ADX 4H | 14.73 | Weak Trend | Choppy market, low conviction |
| RSI (14) 1D | 44.07 | Bearish Lean | Slightly bearish bias on daily |
Frequently Asked Questions: SP500 Analysis
What happens if SP500 breaks below $6,717.73 support?
A break below the 4-hour support at $6,717.73, especially if accompanied by an increasing ADX, would likely signal a move towards the daily support level at $6,669.23. This would invalidate any short-term bullish outlook.
Should I buy SP500 at current levels of $6,734.10 given the neutral RSI?
Buying at $6,734.10 is currently a 'WATCH_ZONE' play, not a high-conviction signal. The neutral RSI at 53.68 on the 1H chart and the weak ADX of 14.73 on the 4H suggest caution. A confirmed breakout above $6,762.37 would be a more prudent trigger for a bullish entry.
Is the ADX at 14.73 a sell signal for SP500 right now?
No, an ADX of 14.73 is not a sell signal itself; it indicates weak trend strength and a potentially ranging or choppy market. While the daily RSI at 44.07 leans bearish, the lack of trend confirmation from the ADX means a direct sell based on this alone is risky. Wait for price action confirmation.
How will the Fed rate decision affect SP500 this week given the DXY at 99.30?
The upcoming Fed decision is a key catalyst. If the Fed signals a hawkish stance or delays rate cuts, it could strengthen the DXY further (currently 99.30), potentially pressuring the SP500. Conversely, dovish signals might weaken the dollar and support equities, but this needs to overcome the current resistance at $6,762.37.
Track markets in real-time
AI-powered analysis, technical indicators and real-time price data.
Join Our Telegram Channel
Breaking market news, AI analysis and trading signals instantly.
Join Channel