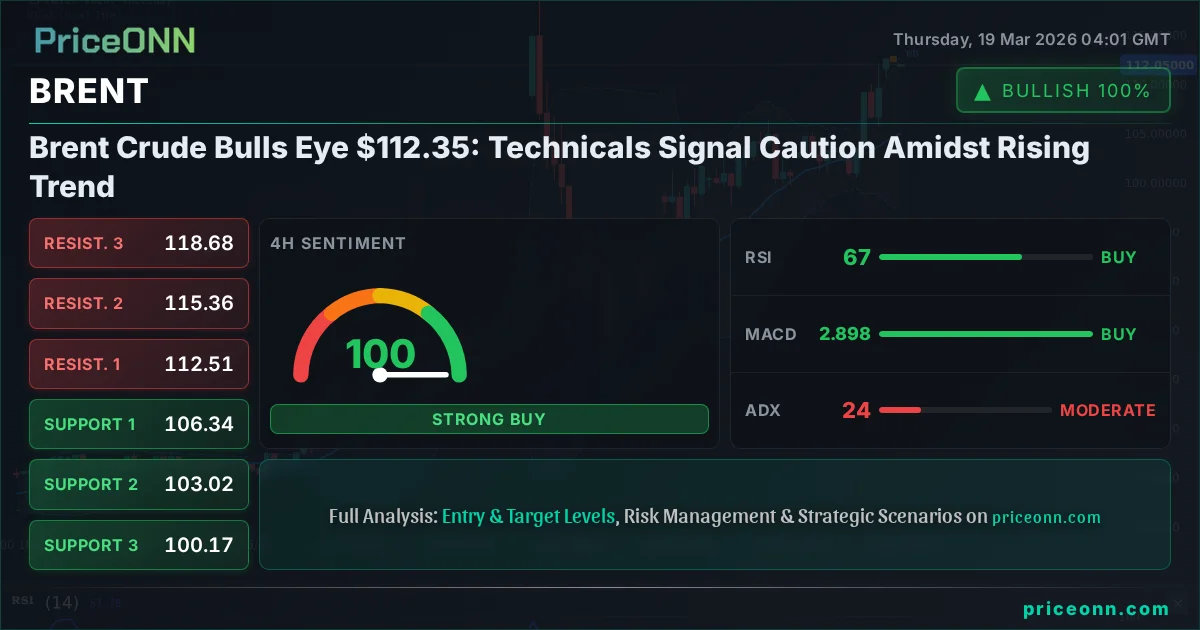
Brent Crude Bulls Eye $112.35: Technicals Signal Caution Amidst Rising Trend
Brent crude is trading at $112.35, with a strong upward trend on the daily chart but mixed signals across shorter timeframes. Technical indicators suggest caution is warranted as resistance looms.
Having seen Brent crude surge past the crucial $112.35 mark, the bulls are certainly making their presence felt. This $112.35 level, a key pivot point we've been watching, now represents the immediate floor for further upside, but the technical picture across multiple timeframes paints a complex, nuanced story. While the daily chart screams bullish momentum, the intraday and 4-hour views flash warning signs, suggesting that this rally might be more fragile than it appears. It's a classic case of conflicting signals where patience and precise risk management are paramount for any trader looking to navigate these choppy waters.
- RSI at 67.3 on the 1D chart indicates strong bullish momentum, but nearing overbought territory on shorter timeframes.
- Critical support for Brent sits at $111.10, tested during intraday trading, with further levels at $110.00 and $109.05.
- The MACD histogram shows positive momentum on the daily chart, but divergence is appearing on the 1H, suggesting weakening upside pressure.
- DXY at 99.91 is showing signs of a potential pullback, which could offer tailwinds for oil prices if it continues.
Navigating the Brent Rally: A Multi-Timeframe Perspective
The recent push above $112.35 for Brent crude is undeniably a significant development, confirming the bullish conviction that has been building over the past few days. On the daily chart, the trend is unequivocally upward, with the ADX reading a robust 33.11, indicating a strong trending environment. The RSI at 69.35 on the 1H and 67 on the 4H suggests significant buying pressure, though the daily RSI at a lofty 85.74 is flashing an amber light, hinting at potential overbought conditions that could precede a correction. This divergence between the shorter-term bullish signals and the daily chart's extended run is where the real trading challenge lies. We're not seeing the kind of clear-cut momentum that would suggest a runaway train; instead, it feels more like a controlled ascent with potential for sharp reversals if key levels fail.
The Daily ADX at 63.37 is particularly telling; it signifies an extremely strong trend, but such strength can often be followed by sharp consolidations or reversals. This isn't a market for the faint of heart, and blindly chasing the upside without considering the risks could prove costly. The fact that the daily RSI is already in extreme overbought territory at 85.74 is a significant factor. While trends can extend further than many expect, this level historically suggests that a pullback is becoming increasingly probable, even if not immediately imminent. Traders need to be acutely aware that the higher Brent climbs, the more volatile any potential retracement could become.
Intraday Dynamics: A Tale of Two Markets
Switching to the 1-hour chart, the picture becomes murkier. Here, the trend is classified as 'Down' with 92% strength, a stark contrast to the daily view. The RSI is hovering around 69.35, still strong but showing signs of wavering, and importantly, the Stochastic K line (93.08) is crossing below the D line (83.15), indicating a potential bearish signal within this overbought zone. The MACD, while positive, is showing signs of weakening momentum on this timeframe. This intraday weakness, coupled with the strong daily uptrend, creates a significant conflict. It suggests that while the broader sentiment remains bullish, short-term profit-taking or a shift in sentiment could trigger a swift move lower. The $111.10 support level is therefore critical; a break below this could easily see prices retrace towards $110.00 and even $109.05, negating the recent bullish breakout.
The Stochastic Oscillator's position on the 1H chart is particularly noteworthy. With K at 93.08 and D at 83.15, we are deep in overbought territory. While this can persist in strong uptrends, the fact that K is already below D is a classic bearish divergence signal. This suggests that the momentum driving the price higher is starting to wane, and a reversal could be on the cards. This is precisely the kind of conflicting signal that demands caution. It's easy to get caught up in the daily trend, but ignoring these shorter-term warnings could lead to entering at unfavorable prices.
4-Hour Chart: The Trend Reversal Signal
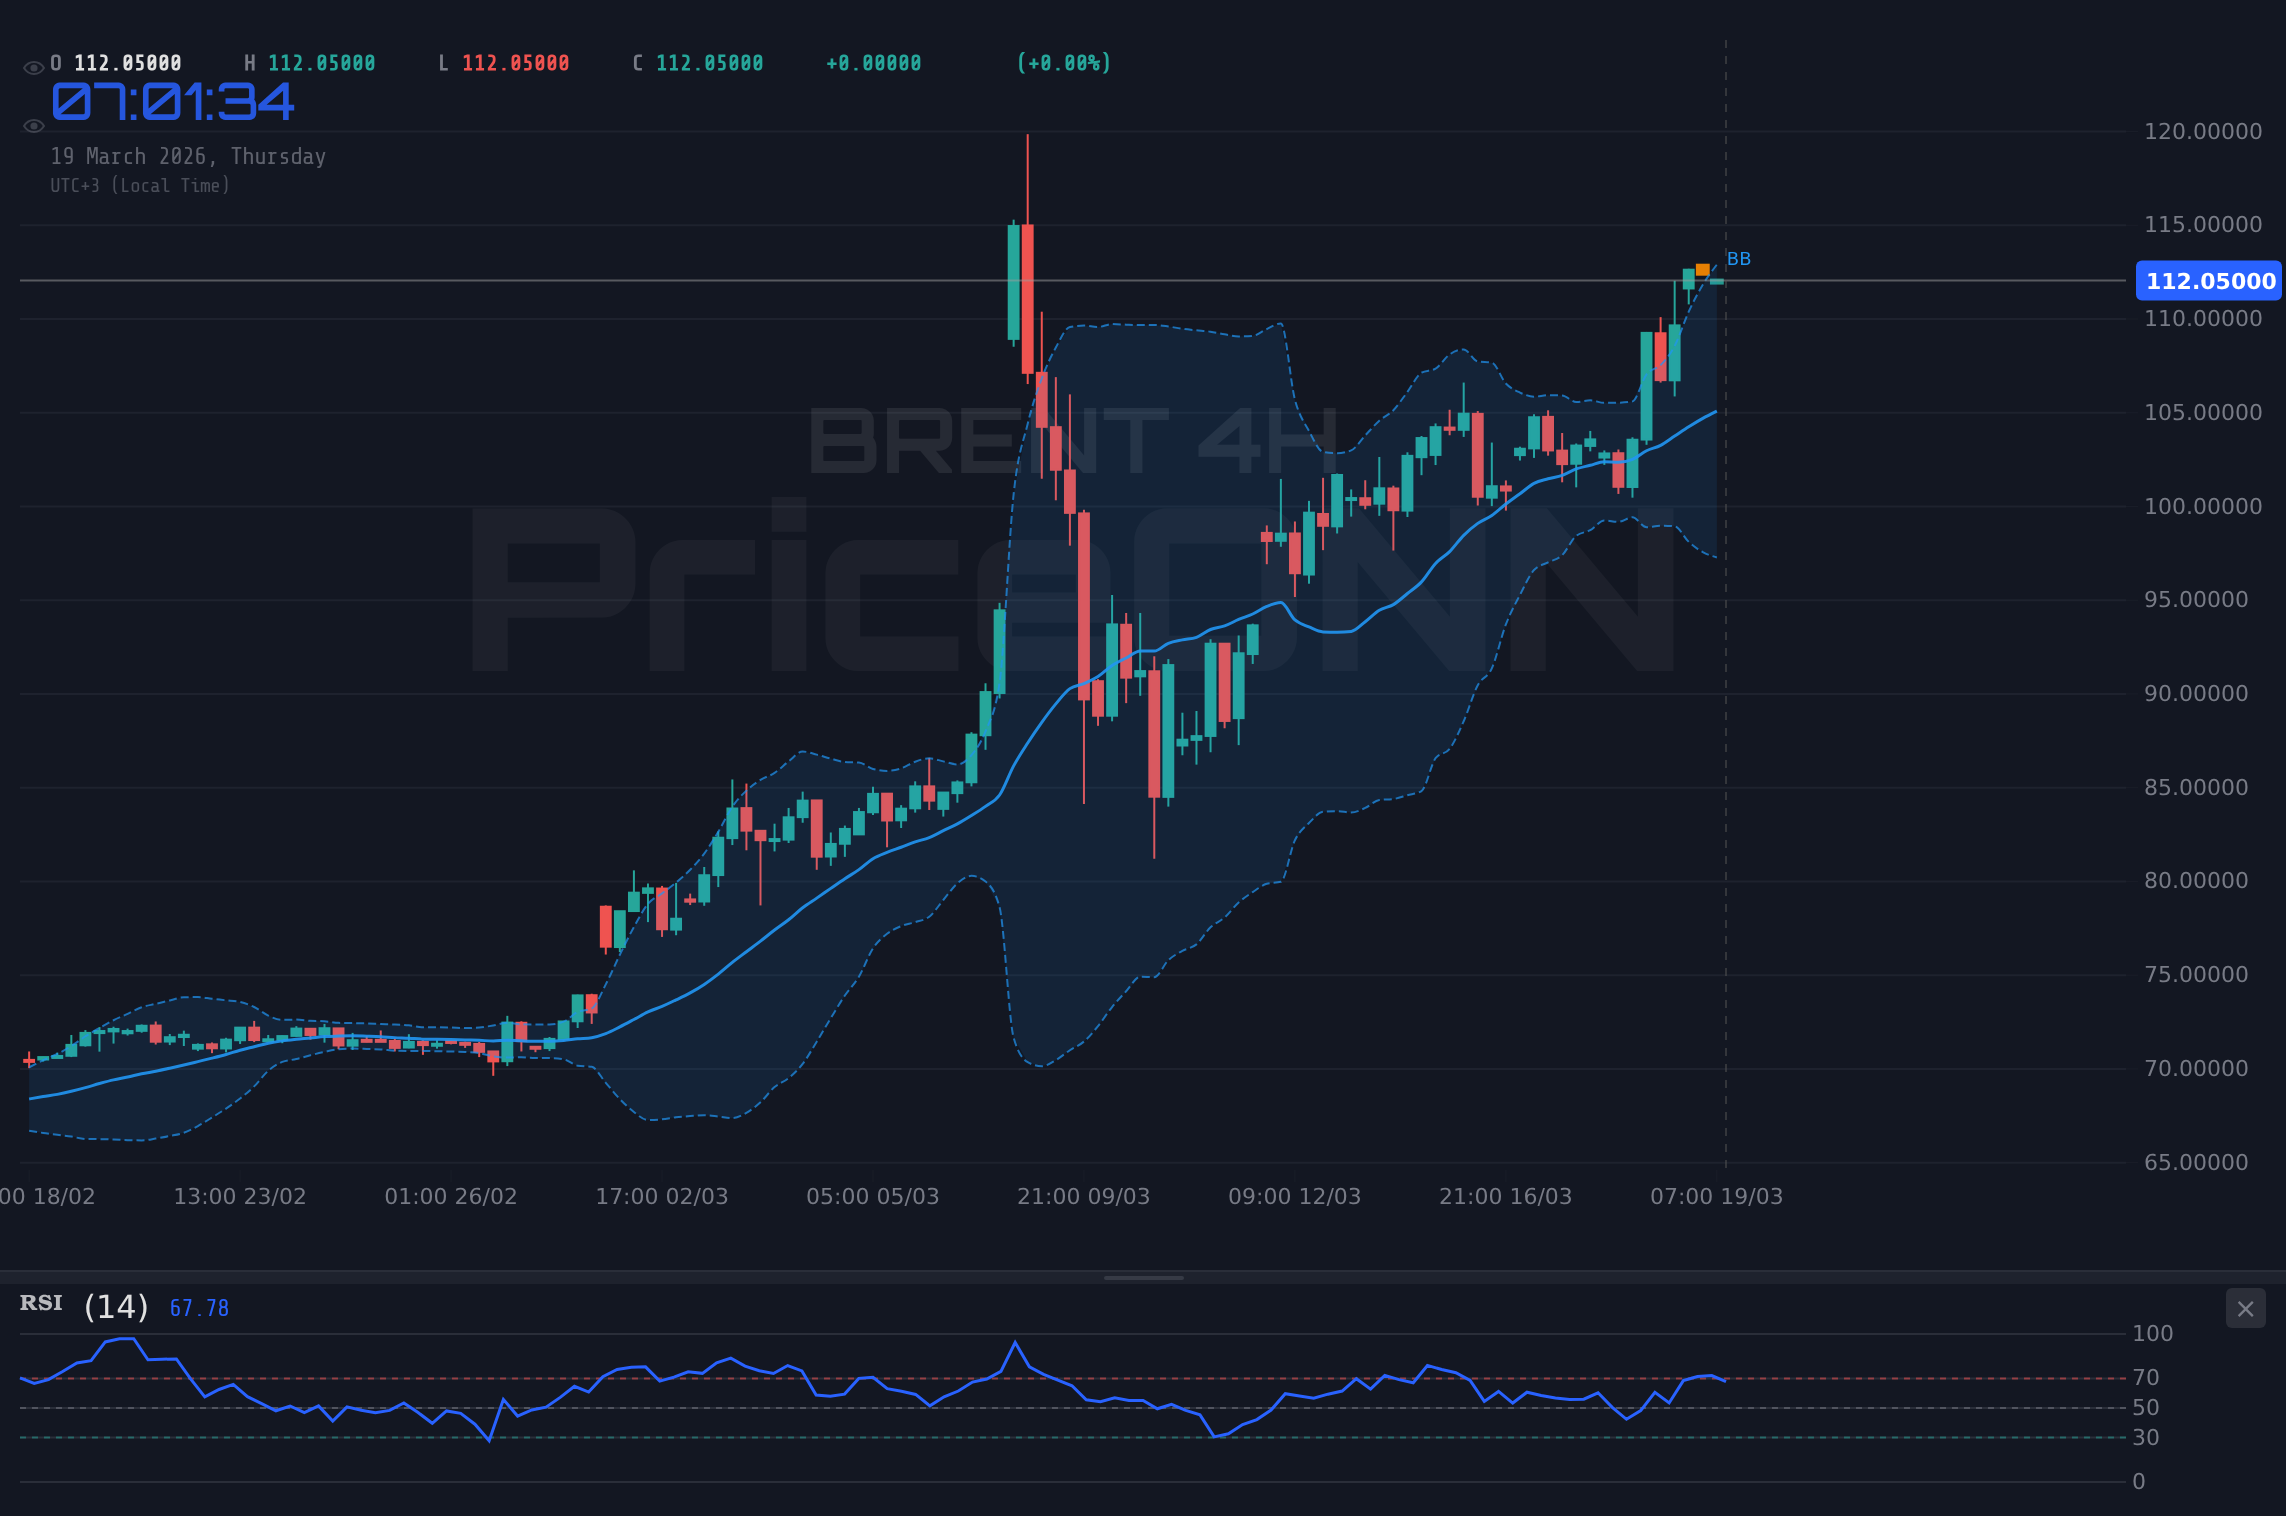
The 4-hour timeframe adds another layer to this complexity. Here, the trend is firmly 'Up' with 97% strength, and the ADX at 23.74 indicates a moderately strong trend. The RSI at 67 is still in bullish territory, and the Stochastic shows K (80.6) above D (66.94), reinforcing the bullish sentiment. However, the MACD histogram is positive, but its bars are not growing significantly, suggesting momentum might be plateauing. The Bollinger Bands are showing the price trading above the upper band, indicating a potential overbought condition or an explosive upward move. Given the confluence of strong daily and 4-hour bullish signals, the $112.35 price point becomes even more significant as a psychological and technical barrier. A sustained break above this level, coupled with continued strength in the daily indicators, would solidify the bullish case. Conversely, failure to hold this level could see a rapid descent.
The fact that the 4-hour ADX is at 23.74, while strong, is not yet in the 'very strong' territory seen on the daily. This suggests that while the trend is present, it might not have the deep conviction needed for a sustained, parabolic move higher. It leaves room for consolidation or even a reversal if external factors shift. The interplay between the daily's extreme bullishness and the shorter timeframes' mixed signals is the key dynamic to watch. It's a tug-of-war between long-term conviction and short-term exhaustion.
The Role of Macroeconomic Factors and Geopolitics
The surge in Brent crude past $112.35 isn't happening in a vacuum. Geopolitical tensions in the Middle East, as highlighted by recent news, continue to be a significant underpinning factor for oil prices. The successful restart of the Ras Tanura refinery by Saudi Aramco is a positive development, potentially easing some supply concerns, but the broader regional instability remains a potent wildcard. Any escalation or new flare-up could easily send prices higher, overriding technical considerations. The market is clearly pricing in a degree of supply risk premium, and this is unlikely to dissipate quickly.
Furthermore, the macroeconomic backdrop plays a crucial role. The US Dollar Index (DXY) is currently hovering around 99.91. While it has shown some strength recently, the 1H and 4H charts suggest a potential pullback is brewing. If the DXY were to weaken significantly, it would typically provide a tailwind for commodities priced in dollars, including Brent crude. The Federal Reserve's upcoming policy decisions and interest rate expectations are also in sharp focus. Hawkish signals from the Fed can strengthen the dollar and put pressure on oil, while a more dovish stance could have the opposite effect. Traders are closely monitoring Fed Fund Futures for any shifts in rate cut probabilities, as this directly influences the cost of capital and broader risk appetite, impacting commodity demand.
The latest US PPI data coming in higher than expected, reported on March 18th, adds another layer of complexity. Higher inflation figures could, in theory, lead to a more hawkish Fed stance, which would typically pressure oil. However, the immediate reaction saw oil prices surge, suggesting that supply-side factors and geopolitical risks are currently overwhelming inflation concerns. This disconnect highlights the complex interplay of forces at play and underscores the need for a data-driven approach rather than relying on simple correlations.
The relationship between oil prices and inflation expectations is a delicate dance. While rising oil prices are a component of inflation, they can also dampen consumer demand and economic growth if they climb too high, too fast. The market is currently grappling with this duality: is the rise in oil prices a sign of robust global demand, or is it a symptom of supply constraints that could ultimately harm the global economy? The current pricing suggests that supply fears are dominating, but this narrative could quickly shift if economic growth indicators begin to falter significantly.
Key Levels and Trading Scenarios
Understanding the critical price levels is paramount for navigating Brent crude effectively. On the upside, resistance is initially seen at $113.15, followed by $114.10 and the more significant psychological level at $115.20. A sustained move above $113.15, particularly on strong volume and bullish confirmation from shorter-term indicators, could signal a continuation of the rally towards $114.10 and potentially $115.20. However, the overbought conditions on the daily RSI (85.74) suggest that breaching these levels might be challenging without a significant catalyst or a period of consolidation.
On the downside, immediate support lies at $111.10. This level has already been tested intraday, and a decisive break below it would be a strong bearish signal, potentially opening the door for a retracement towards $110.00. Further support is found at $109.05. A break below $111.10 would invalidate the immediate bullish momentum and could lead to a more significant pullback, possibly testing the 4-hour support levels around $106.34. The ADX on the daily chart at 63.37 indicates a very strong trend, meaning that even a short-term reversal could be sharp and swift. Therefore, risk management is key, with stops placed strategically below identified support levels.
Trade Scenarios for Brent Crude
Bearish Scenario: Profit-Taking Pressure Mounts
45% ProbabilityNeutral Scenario: Consolidation Around $112.35
30% ProbabilityBullish Scenario: Rally Extends Towards $115
25% ProbabilityTrader's Edge: What to Watch Next
For the active trader, the immediate focus must be on the $111.10 support level. A failure to hold this could signal the end of the current bullish impulse, especially given the overbought daily RSI. Conversely, a strong hold above $112.35, followed by a decisive move through $113.15, would validate the continued uptrend, though traders should remain vigilant for signs of exhaustion as prices approach $114.10 and $115.20. The interplay between the DXY and Brent prices will also be crucial; a weakening dollar could provide the fuel for a further rally, while a strengthening dollar might exacerbate any downside correction.
The conflicting signals across different timeframes suggest that volatility is likely to remain elevated. This environment can be profitable for skilled traders who can adapt quickly, but it poses significant risks for those who are not prepared. It’s crucial to manage risk tightly, perhaps by using tighter stop-losses than usual, and to avoid chasing the market. Waiting for clear confirmation signals, especially on the shorter timeframes, before committing to a trade is advisable. The strong daily trend provides a backdrop of underlying strength, but the intraday weakness cannot be ignored. This is a market that requires a balanced approach, respecting both the long-term momentum and the short-term signals of caution.
Ultimately, the path forward for Brent crude will likely be dictated by the interplay of ongoing geopolitical risks, central bank policies, and the broader economic outlook. While the technicals currently suggest a bullish bias on the daily chart, the overbought conditions and intraday divergences warn against unchecked optimism. Traders should prioritize risk management and look for clear entry and exit points based on the established support and resistance levels. The market always provides opportunities, but patience and discipline are key to capitalizing on them.
Frequently Asked Questions: BRENT Analysis
What happens if BRENT breaks below the $111.10 support level?
A break below $111.10 would invalidate the immediate bullish momentum and could trigger a sharp retracement. The next significant support levels to watch would be $110.00, followed by $109.05. This scenario becomes more likely if intraday momentum indicators show further divergence and the DXY strengthens.
Should I consider buying BRENT at current levels around $112.35 given the daily RSI at 85.74?
Buying aggressively at current levels, with the daily RSI at 85.74, carries elevated risk due to overbought conditions. A more prudent approach might be to wait for a pullback to a key support level like $111.10 or $110.00, or to seek confirmation of continued upside momentum above $113.15 before entering. The probability of a short-term reversal increases with the RSI at this extreme.
Is the MACD histogram signal a sell signal for BRENT at $112.35?
The MACD histogram shows positive momentum on the daily chart, supporting the bullish trend. However, on the 1-hour timeframe, momentum appears to be waning, and divergence is appearing. This conflicting signal suggests caution; it's not a definitive sell signal yet, but it indicates that the upside momentum might be exhausting, and a reversal is becoming more plausible.
How will the Fed's policy decision affect BRENT prices this week, given the current $112.35 level?
The Fed's stance on interest rates significantly impacts the US Dollar, which in turn affects commodity prices like Brent. If the Fed signals a more hawkish policy or fewer rate cuts than expected, it could strengthen the DXY and pressure Brent prices lower, potentially testing support levels. Conversely, a dovish surprise could weaken the dollar and support further gains for Brent, especially if geopolitical risks remain elevated.
Track markets in real-time
AI-powered analysis, technical indicators and real-time price data.
Join Our Telegram Channel
Breaking market news, AI analysis and trading signals instantly.
Join Channel