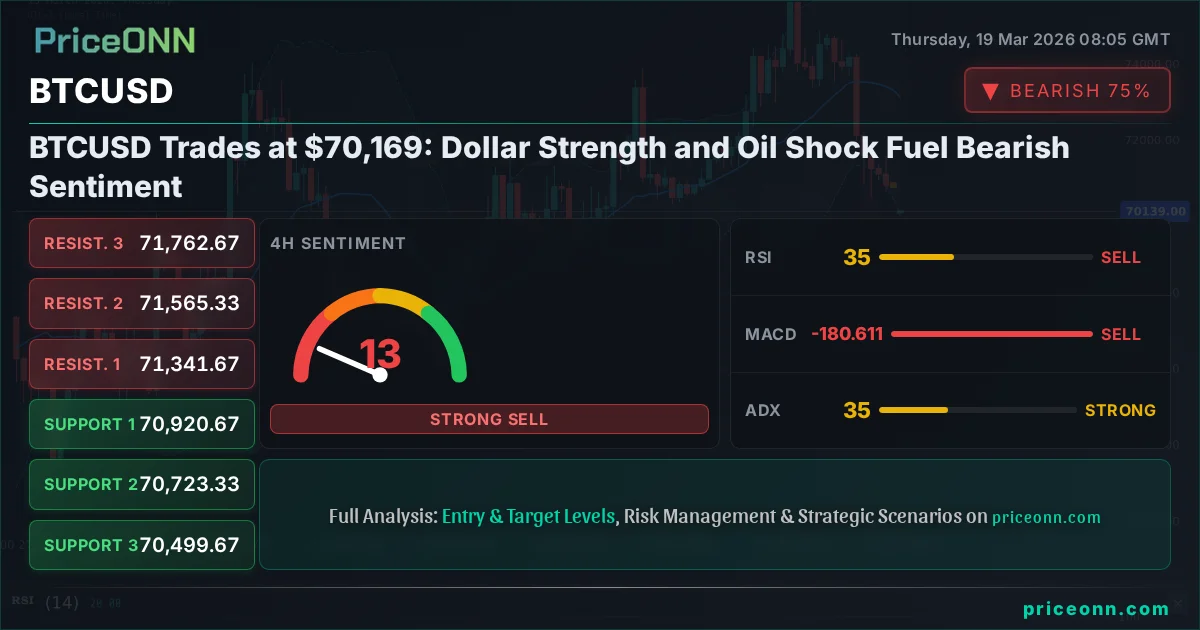
BTCUSD Trades at $70,169: Dollar Strength and Oil Shock Fuel Bearish Sentiment
BTCUSD hovers around $70,169 near key support amid rising DXY and surging oil prices. Technicals flash mixed signals, but macro headwinds loom.
The cryptocurrency market is facing a significant headwind as Bitcoin (BTCUSD) finds itself trading precariously around the $70,169 mark. This price point, while currently holding above critical support levels, is under pressure from a potent cocktail of macroeconomic factors. The US Dollar Index (DXY) is showing renewed strength, fueled by a hawkish stance from the Federal Reserve and a shock surge in oil prices. This confluence of events is souring risk appetite across global markets, and Bitcoin, despite its recent resilience, is not immune to these broader forces. The technical indicators on multiple timeframes paint a complex picture, suggesting a period of consolidation or potential further downside if key levels fail to hold. Understanding the interplay between these macro drivers and Bitcoin's technical setup is crucial for navigating the current market landscape.
- BTCUSD is currently trading around $70,169, testing support levels following a sharp decline.
- The US Dollar Index (DXY) is strong, currently at 100.04, pressuring risk assets like Bitcoin.
- Surging oil prices past $114 for Brent crude are exacerbating inflation fears and reducing market risk appetite.
- Technical indicators show mixed signals, with strong downtrends on shorter timeframes but weak trends on daily charts, suggesting consolidation is possible but downside risk remains.
Macroeconomic Storm Clouds Gather Over Bitcoin
The narrative surrounding Bitcoin has shifted dramatically in the last 48 hours. What was once a market seemingly driven by its own internal dynamics is now heavily influenced by external macroeconomic pressures. The Federal Reserve's recent policy decision, signaling a more hawkish stance and fewer anticipated rate cuts for 2026, has injected a dose of realism into market expectations. This has bolstered the US Dollar, with the DXY currently hovering around 100.04, a level that historically correlates with increased pressure on risk assets. When the dollar strengthens, it typically becomes more expensive for global investors to acquire dollar-denominated assets, including Bitcoin, leading to reduced demand.
Adding fuel to the fire is the unexpected surge in crude oil prices. Brent crude has rocketed past $114, with WTI also seeing significant gains. This spike is largely attributed to escalating geopolitical tensions in the Middle East, which are reviving inflation concerns. Higher energy costs translate directly into higher input costs for businesses and higher prices for consumers, potentially forcing central banks to maintain tighter monetary policies for longer. This inflationary pressure further solidifies the case for a strong dollar and dampens the speculative appetite that often fuels Bitcoin rallies. The correlation is clear: as oil prices climb and inflation fears resurface, the DXY strengthens, and risk assets like BTCUSD tend to suffer.
Technical Picture: A Battle for Key Levels
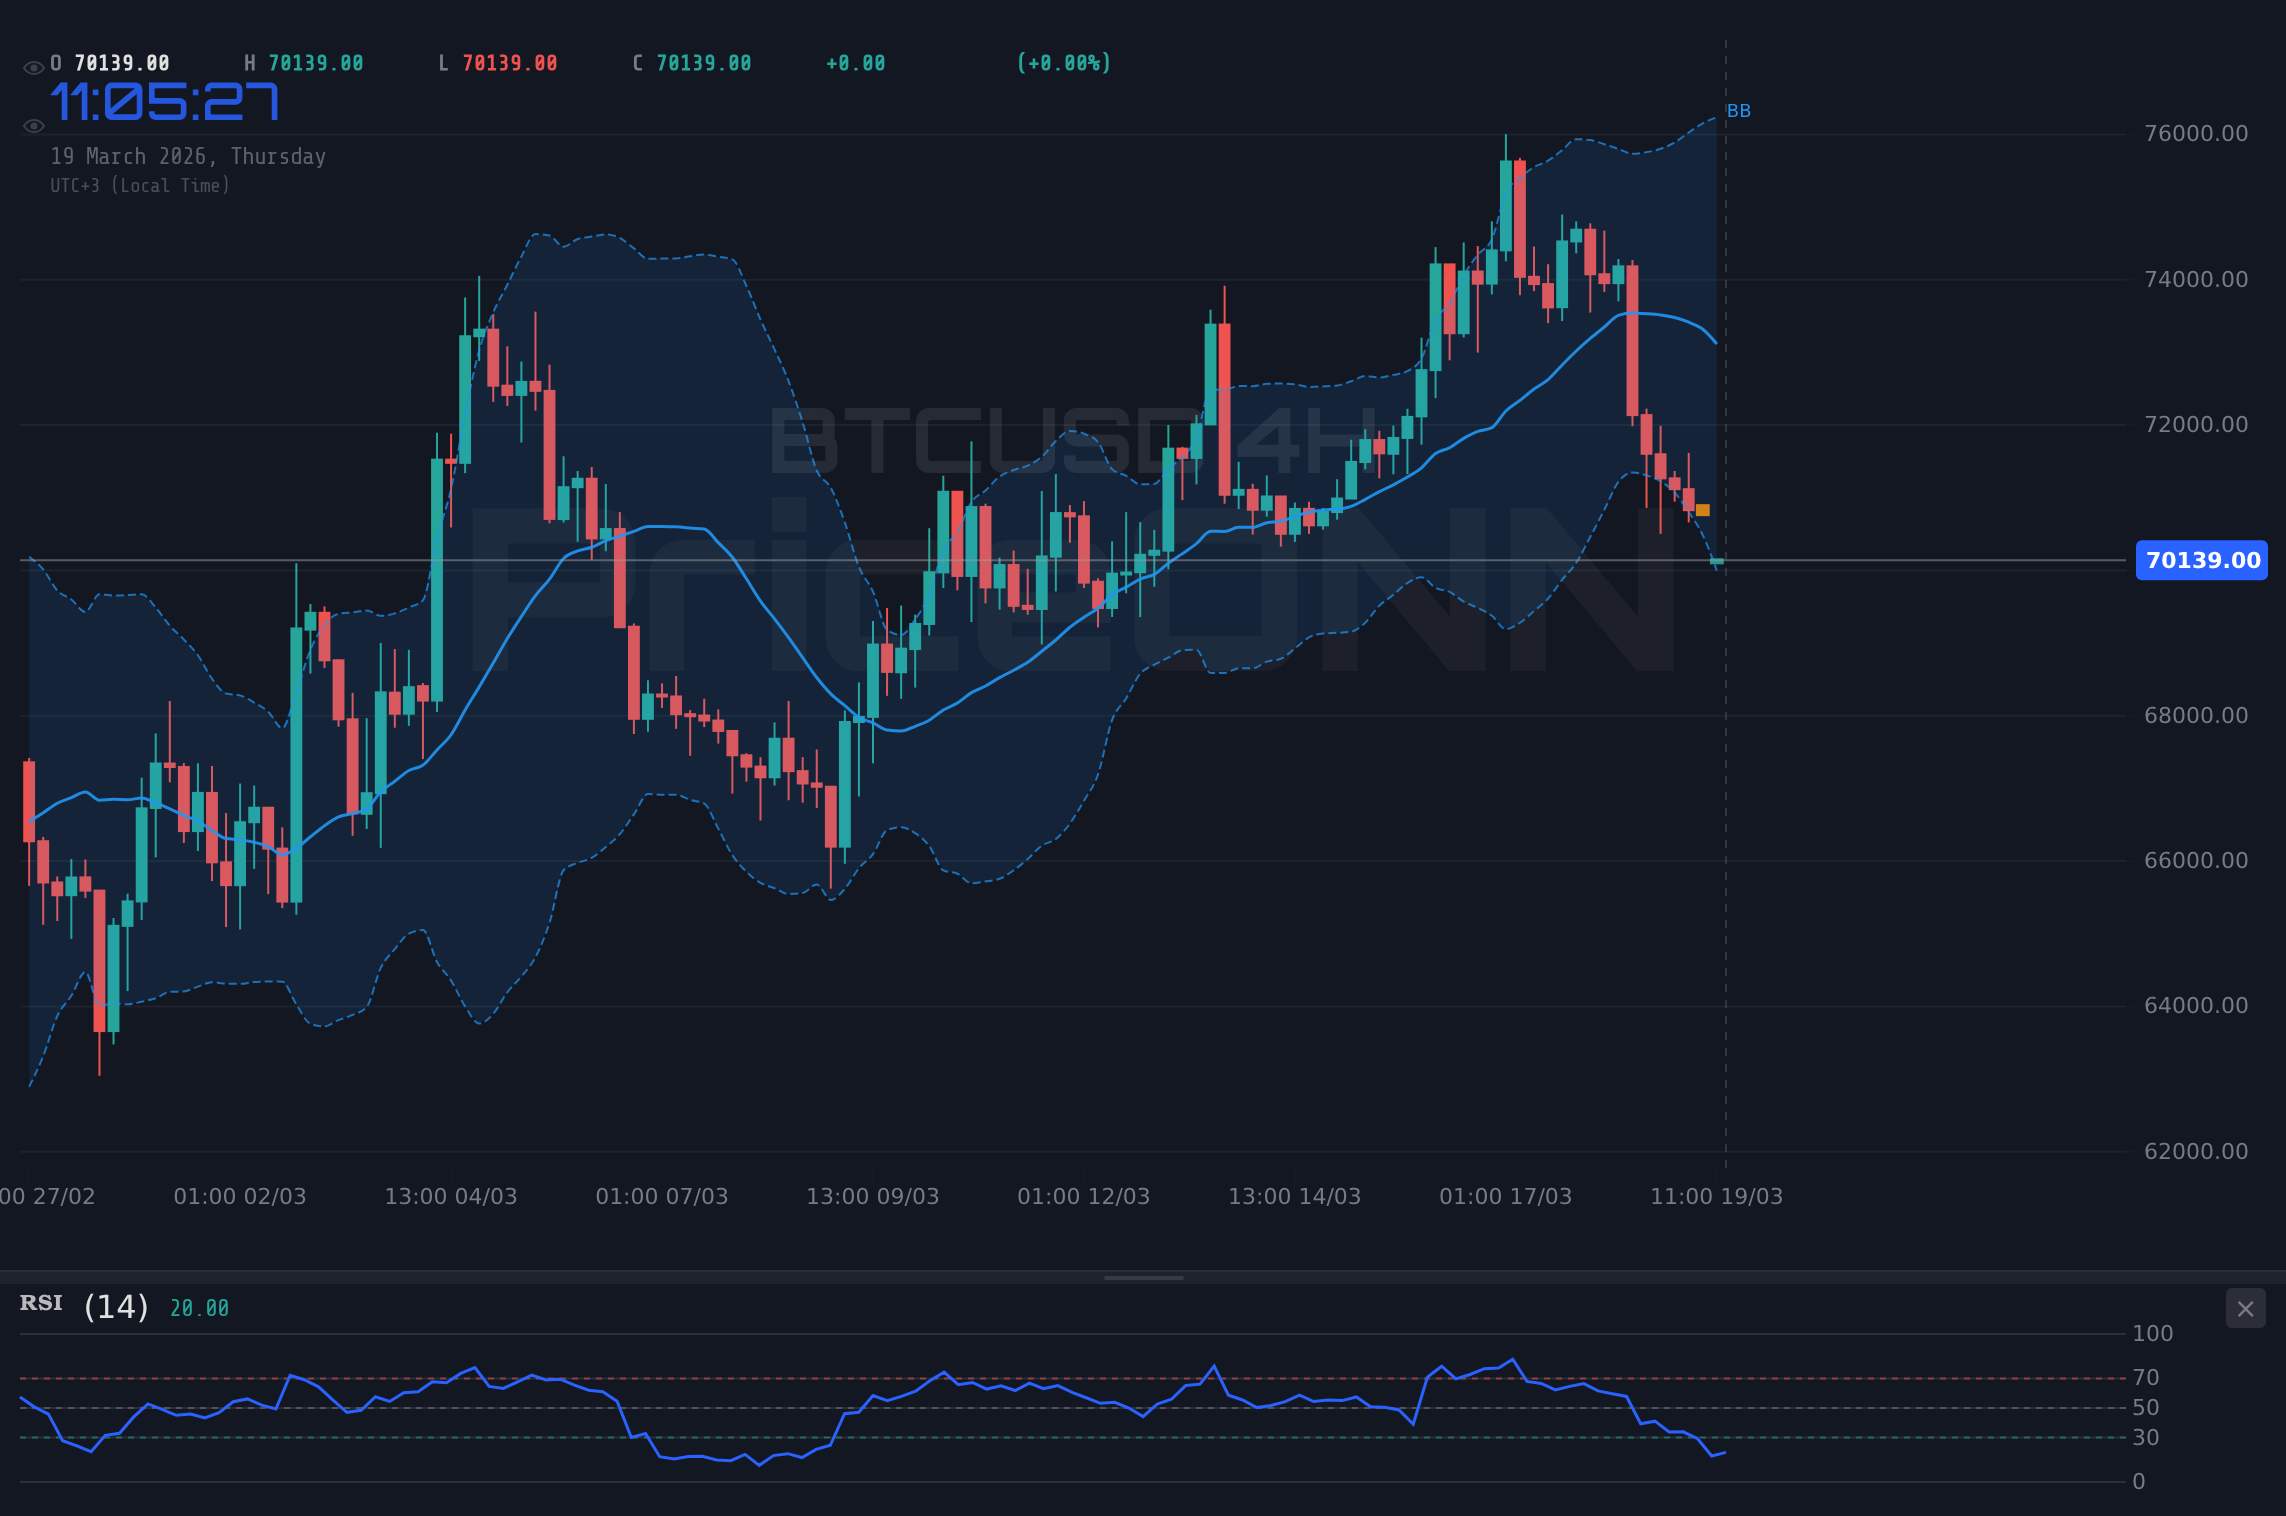
On the charts, Bitcoin presents a mixed but predominantly cautious outlook. The 1-hour timeframe reveals a strong downtrend with an ADX reading of 42.27, indicating significant bearish momentum. The RSI at 24.61 is deep in oversold territory, suggesting a potential for a short-term bounce, but the MACD remains negative, and Stochastic oscillators are signaling further downside. The price is trading below the lower Bollinger Band, a classic sign of strong downward pressure, but often precedes a reversionary move. The overall signal across this timeframe is a strong 'SELL', reflecting the immediate bearish sentiment.
The 4-hour chart offers a slightly different perspective, though still leaning bearish. The ADX here is also high at 35.33, confirming a strong trend, but the trend is classified as 'Neutral' in terms of power (50% strength). This suggests that while a trend is present, its conviction might be wavering. The RSI is at 35.15, still in oversold territory, and the MACD is negative. However, the Stochastic K and D lines are showing a potential for a slight uptick from extreme oversold levels, hinting at a possible consolidation phase. The daily chart provides the broadest context, with an ADX of only 16.2, indicating a weak trend and a largely sideways market. This divergence across timeframes suggests that while short-term momentum is bearish, the longer-term trend is less defined, creating an environment ripe for consolidation if key support levels hold.
Short-Term Pressures: The 1H and 4H Sell Signals
The immediate pressure on BTCUSD is evident across the shorter timeframes. On the 1-hour chart, the downward momentum is undeniable. The RSI reading of 24.61 suggests that sellers have been overly aggressive, creating an environment where a short-term technical bounce is plausible. However, the MACD histogram is deeply negative, and the Stochastic oscillator, while in oversold territory, is showing %K below %D, a bearish signal. The ADX at 42.27 is a significant indicator of a strong trend, and in this case, it's a bearish one. This suggests that any upward movements are likely to be met with selling pressure, potentially leading to further declines if immediate support fails.
The 4-hour timeframe echoes these concerns, albeit with slightly less conviction. The ADX at 35.33 still points to a strong trend, but the 'Neutral' classification of trend strength indicates a potential for equilibrium to be established. The RSI at 35.15 is oversold, and the MACD is negative. The Stochastic lines are extremely low, a classic sign of oversold conditions that could precede a reversal or a period of consolidation. The key takeaway from these shorter timeframes is that the path of least resistance is currently to the downside. Traders looking for immediate opportunities might be tempted by the oversold RSI, but the persistent negative momentum and strong trend indicators suggest caution is warranted. Waiting for confirmation of a reversal or a clear break of resistance is advisable.
Daily Chart View: A Weak Trend Amidst Volatility
Shifting to the daily chart, the picture for BTCUSD becomes less about a defined trend and more about volatility within a broader range. The ADX sits at a mere 16.2, signaling a very weak trend. This means that while price movements can be sharp, they lack sustained directional conviction. The RSI at 36.31 is in neutral territory, leaning towards oversold, but not indicating extreme conditions. The MACD is negative, continuing the theme of bearish momentum, but the Bollinger Bands are starting to widen slightly after being breached on the downside, which can sometimes precede a period of consolidation or a reversal. The Stochastic lines are deeply oversold at 6.24 for %K and 16.69 for %D, suggesting that from a purely technical standpoint, the conditions are aligning for a potential bounce.
However, the daily chart's weak trend reading is critical. It implies that the current price action is not indicative of a major directional shift but rather a reaction to broader market sentiment. The strength of the US Dollar and the spike in oil prices are likely exerting significant influence, pushing BTCUSD lower without necessarily establishing a sustained bearish trend. This creates a scenario where price could stabilize if these external pressures ease, or conversely, break down if the macro environment deteriorates further. The key support level on the daily chart at $69,588 becomes paramount. A failure to hold this level could trigger significant selling, targeting the next support at $67,909.
Correlation Analysis: DXY, Oil, and Equities
The interconnectedness of global markets is on full display, and Bitcoin is not operating in a vacuum. The surge in the US Dollar Index (DXY) to 100.04 is a significant factor. As the DXY strengthens, it generally exerts downward pressure on commodities and cryptocurrencies. This inverse correlation is driven by several factors, including the cost of holding dollar-denominated assets and the 'risk-off' sentiment that often accompanies a strong dollar. Investors tend to move capital towards perceived safe-haven assets like the dollar, away from more speculative assets like Bitcoin.
The dramatic rise in oil prices, with Brent crude hitting $114.15, further complicates the picture. This spike is not just an energy market event; it's a signal of renewed inflationary concerns. Higher oil prices increase transportation costs and energy expenditures for businesses and consumers, potentially leading to broader inflation. This can force central banks, including the Federal Reserve, to remain hawkish, keeping interest rates higher for longer. This environment is detrimental to risk assets. The S&P 500 and Nasdaq, key risk appetite indicators, are also showing weakness, trading down on the day. The S&P 500 at 6608.1 and Nasdaq at 24344.89 reflect a general market reticence to take on risk, which directly impacts Bitcoin's ability to attract capital.
Geopolitical Ripples and Their Impact on Crypto
The escalating geopolitical tensions in the Middle East, as reported by sources like Reuters and Bloomberg, are a major catalyst behind the surge in oil prices and the subsequent market reaction. Retaliatory strikes impacting energy infrastructure have sent shockwaves through global energy markets, pushing crude prices higher and reviving fears of sustained inflation. This uncertainty naturally leads to a 'risk-off' sentiment. In such an environment, investors prioritize capital preservation, often flocking to traditional safe-haven assets like the US dollar and government bonds, while shedding riskier assets.
Bitcoin, despite its narrative as a potential inflation hedge and a digital safe haven, often struggles to maintain its uncorrelated status during periods of extreme macro stress. When traditional 'risk-off' sentiment dominates, Bitcoin can be sold alongside equities and other growth assets. The hawkish signals from the Fed, in response to the resurfacing inflation fears driven by oil prices, reinforce this dynamic. The market is essentially pricing in a scenario where monetary policy remains tight, and economic growth could be constrained, both of which are headwinds for speculative assets like Bitcoin. The current price action suggests that Bitcoin is being treated more as a risk asset than a safe haven in this specific macro climate.
Trade Scenarios: Navigating the Uncertainty
Bearish Scenario: Support Breakdown
65% ProbabilityNeutral Scenario: Consolidation Around $70K
25% ProbabilityBullish Scenario: Bounce from Oversold
10% ProbabilityNavigating the Current Market Environment
The current market environment for Bitcoin is characterized by significant uncertainty, driven by a potent mix of macroeconomic headwinds and conflicting technical signals. The bearish sentiment is amplified by the strengthening US Dollar, currently trading at 100.04 on the DXY, and the sharp rise in oil prices, which has reignited inflation concerns. These factors are contributing to a 'risk-off' sentiment across global markets, impacting major equity indices like the S&P 500 and Nasdaq, which are also trading lower. The technicals on shorter timeframes (1H and 4H) are predominantly bearish, with strong downtrend indicators like ADX readings above 35 and oversold RSI levels. However, the daily chart presents a weaker trend, suggesting that the current price action might be more of a reaction to external pressures than a fundamental shift in Bitcoin's long-term trajectory.
The critical support level to watch is the daily support at $69,588. A break below this level would likely trigger further selling, potentially targeting the subsequent supports at $67,909 and $65,315. On the upside, resistance at $70,854 on the 1-hour chart and the daily resistance at $73,861 will need to be overcome for any significant bullish reversal to take hold. The high probability (65%) bearish scenario hinges on a breakdown below $69,588, driven by sustained dollar strength and negative market sentiment. Conversely, a neutral scenario involving consolidation between $69,588 and $71,295 holds a 25% probability, reflecting the market's indecision. The bullish scenario, requiring a clear bounce from oversold conditions and a break of key resistance, is currently assigned a lower 10% probability, given the prevailing macro environment.
What Traders Should Watch Next
For traders, the immediate focus should be on the $69,588 support level. A decisive break below this point would invalidate any immediate hopes for a recovery and open the door for a deeper correction. Conversely, if Bitcoin can hold this level and begin to reclaim higher ground, the resistance at $70,854 becomes the next hurdle. Confirmation of a bullish reversal would likely require a break above this level, accompanied by improving market sentiment and a potential cooling off in the DXY. The interplay between Fed policy expectations, oil price movements, and the overall risk appetite will be critical in determining the short-to-medium term direction.
The current technical setup, particularly the oversold conditions on the daily chart combined with weak trend strength (ADX 16.2), suggests that while downside risk is elevated, there might be a limited window for a technical bounce. However, this bounce would need to overcome significant selling pressure and a hostile macro environment. Traders should remain vigilant for any shifts in the DXY or oil prices, as these will likely dictate the broader market sentiment and, consequently, Bitcoin's price action. Patience and disciplined risk management are paramount in this environment, waiting for clear setups rather than chasing volatile price swings.
The Fed's Shadow and Oil's Volatility: A Double Whammy
The Federal Reserve's recent policy meeting has cast a long shadow over risk assets. Their hawkish stance, signaling fewer rate cuts than previously anticipated, has bolstered the US Dollar. The DXY is currently at 100.04, reflecting this strength. This rise in the dollar makes it more expensive for global investors to purchase dollar-denominated assets, directly impacting demand for Bitcoin. Furthermore, the unexpected surge in oil prices, with Brent crude reaching $114.15, has rekindled inflation fears. This scenario forces the Fed to remain vigilant, potentially keeping interest rates higher for longer, which is a significant headwind for speculative assets like Bitcoin. The market is now grappling with the possibility of stagflation – rising inflation coupled with slowing economic growth – a scenario that typically leads to a 'risk-off' environment.
This dual pressure from a strong dollar and renewed inflation concerns is creating a challenging environment for Bitcoin. While Bitcoin has often been touted as a hedge against inflation, its correlation with risk assets like equities means it can suffer during periods of broad market deleveraging. The S&P 500 (6608.1) and Nasdaq (24344.89) are both showing declines, underscoring the prevailing risk-off sentiment. This suggests that Bitcoin is currently being viewed more as a risk-on asset, susceptible to broader market downturns, rather than a safe-haven alternative in this specific macro climate. The technical indicators, particularly on shorter timeframes, reinforce this bearish outlook, with strong downtrend signals prevalent.
Key Levels to Monitor
The technical structure for BTCUSD highlights several critical levels that traders must monitor closely. On the daily chart, the primary support lies at $69,588. A decisive break below this level would signal a significant shift in sentiment and could accelerate declines towards the next support at $67,909, followed by $65,315. These levels represent areas where buying interest could potentially emerge, but given the current macro pressures, a sustained bounce from these zones is not guaranteed without a shift in the broader market narrative.
On the resistance side, the 1-hour chart shows immediate resistance at $70,854, followed by $71,295. These levels represent the immediate hurdles for any potential short-term recovery. A sustained move above $71,295 would be a significant bullish development, potentially signaling a shift in momentum. However, the overarching bearish sentiment, driven by macro factors, suggests that overcoming these resistance levels will be challenging without a catalyst for improved risk appetite. The daily resistance at $73,861 remains a key longer-term target for bulls, but it appears distant given the current market conditions.
What the Indicators Are Saying
The technical indicators for BTCUSD present a picture of oversold conditions on longer timeframes, conflicting with strong bearish momentum on shorter timeframes. On the 1-hour chart, the RSI is at 24.61, indicating oversold territory, but the ADX at 42.27 points to a strong downtrend. Similarly, the 4-hour chart shows an RSI of 35.15 and an ADX of 35.33, reinforcing the bearish trend. The daily chart, however, shows a weaker trend (ADX 16.2) with an RSI at 36.31, suggesting that the current downtrend lacks long-term conviction and might be heavily influenced by external market forces rather than intrinsic Bitcoin dynamics.
The Stochastic Oscillator on the daily chart is deeply oversold at 6.24 (%K) and 16.69 (%D), a signal that historically has preceded bounces. However, the MACD remains negative across all timeframes, indicating persistent bearish momentum. This divergence between oversold conditions on longer timeframes and strong bearish momentum on shorter ones creates a complex trading environment. It suggests that while a bounce is technically possible, it might be short-lived unless the macroeconomic headwinds subside. The overall signal across multiple timeframes leans heavily towards 'Sell', reflecting the immediate bearish pressure, but the underlying daily conditions warrant close observation for potential reversals.
The Path Forward: Risk Management is Key
In the current market climate, characterized by rising dollar strength, soaring oil prices, and hawkish central bank rhetoric, Bitcoin faces significant headwinds. The technical indicators suggest that while oversold conditions exist on longer timeframes, the immediate pressure is bearish, with key support levels at risk. The most probable scenario involves further consolidation or a breakdown below critical support at $69,588, targeting lower levels. A neutral scenario between $69,588 and $71,295 is possible, but a sustained bullish move appears less likely without a significant shift in macro sentiment.
For investors and traders, the emphasis must be on risk management. The $69,588 level is the line in the sand. A close below this on the daily chart would likely confirm the bearish scenario and trigger stop-loss orders, potentially leading to cascading selling. Conversely, holding this support and seeing a break above the $70,854 resistance could signal the beginning of a short-term recovery, but confirmation would be needed from broader market sentiment and a softening of the DXY. Given the volatility and the strong influence of macroeconomic factors, position sizing and stop-loss placement are paramount. Patience will be rewarded; waiting for clearer signals and favorable risk-reward setups is the prudent approach in these uncertain times.
Frequently Asked Questions: BTCUSD Analysis
What happens if BTCUSD breaks below the $69,588 support level?
If BTCUSD closes below the critical daily support at $69,588, it would likely trigger a bearish scenario with a 65% probability. This could lead to further declines targeting support levels at $67,909 and potentially $65,315 as market sentiment sours.
Is the current RSI reading of 36.31 a buy signal for BTCUSD at $70,169?
The RSI at 36.31 on the daily chart is in neutral territory, leaning towards oversold but not a definitive buy signal on its own. Given the strong bearish momentum on shorter timeframes and macro headwinds, it suggests potential for a bounce but not a guaranteed trend reversal.
How will the Fed's hawkish stance and rising oil prices affect BTCUSD's trend?
The hawkish Fed stance is strengthening the DXY to 100.04, and rising oil prices are fueling inflation fears, both of which create a 'risk-off' environment. This typically pressures risk assets like BTCUSD, making a sustained bullish trend unlikely without a significant shift in these macro factors.
What is the immediate resistance level for BTCUSD if it attempts a recovery from $70,169?
If BTCUSD attempts a recovery from current levels, the immediate resistance to watch is on the 1-hour chart at $70,854. A sustained break above this level, coupled with positive market sentiment, would be needed to signal a potential shift towards the next resistance at $71,295.
Track markets in real-time
AI-powered analysis, technical indicators and real-time price data.
Join Our Telegram Channel
Breaking market news, AI analysis and trading signals instantly.
Join Channel