DXY Holds Near $100.06: Dollar Eyeing Gains Amidst Fed Hawkishness and Oil Shock
The Dollar Index (DXY) hovers near $100.06 as markets digest a hawkish Fed stance and surging oil prices. Technical indicators suggest consolidation ahead of key price levels.
The Dollar Index (DXY) is currently treading water, clinging precariously to the $100.06 mark. This pivotal level, a psychological and technical battleground, finds itself under intense scrutiny as traders digest a potent cocktail of hawkish Federal Reserve signals and a sharp surge in oil prices. The narrative is clear: the greenback is showing resilience, but the path forward is fraught with both opportunity and significant risk. Having watched the DXY navigate these choppy waters, it’s evident that the current price action is a complex interplay of monetary policy expectations, inflation fears, and geopolitical tremors. This isn't just about a single number; it's about the underlying forces shaping global financial markets right now.
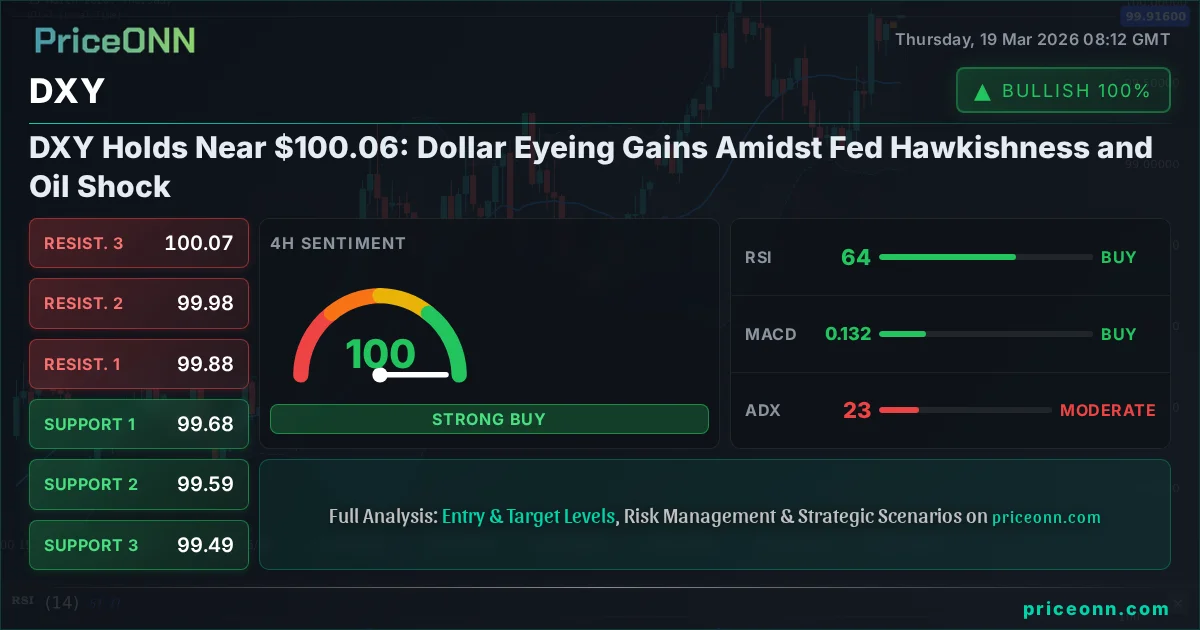
- The DXY is holding near $100.06, a critical psychological and technical level.
- RSI at 67.12 on the daily chart indicates strong upward momentum but approaches overbought territory, signaling potential consolidation.
- Key support for the DXY is identified at $99.36, with resistance looming at $100.23.
- Hawkish Fed undertones and rising oil prices are currently supporting the dollar, but market sentiment remains cautious.
- A break above $100.23 could signal further upside, while a fall below $99.36 would indicate a shift in momentum.
The Federal Reserve's recent stance has been a significant tailwind for the dollar. While they maintained interest rates, the subtle but unmistakable hawkish undertones signaled fewer rate cuts for 2026 than previously anticipated. This shift in forward guidance, especially in the face of sticky inflation data - as reinforced by the recent surge in US Producer Price Index (PPI) - creates a fertile ground for dollar strength. The market is recalibrating its expectations, pricing in a higher-for-longer interest rate environment in the US compared to other major economies. This divergence in monetary policy expectations is a classic driver of currency strength, and the DXY's ability to hold its ground near $100.06 is a testament to this underlying trend. The 1-hour chart shows a strong upward trend (Power: 94%), but the daily RSI at 67.12 suggests we are nearing a point where caution is warranted. It’s not yet overbought, but the bulls are certainly pushing the envelope.
Adding another layer of complexity and supporting the 'risk-off' sentiment is the dramatic surge in crude oil prices. Brent crude has rocketed past $110, with WTI following suit. This isn't just a commodity price move; it's a signal of escalating geopolitical tensions, potentially in the Middle East, and a stark reminder of inflation's persistent nature. Higher energy costs translate to higher input costs for businesses and higher prices for consumers, fueling inflation concerns. This inflationary pressure is precisely what the Fed is trying to combat, and it indirectly bolsters the dollar's appeal as a safe-haven asset. When inflation fears rise, and geopolitical uncertainty clouds the horizon, capital tends to flow towards perceived safe havens, and the US dollar, backed by the world's largest economy and deepest financial markets, often benefits. The correlation between rising oil prices and a stronger dollar, especially when coupled with inflation concerns, is a well-established phenomenon we've seen play out time and again.
Looking at the technical picture, the DXY is currently consolidating around the $100.06 level. On the 1-hour chart, the ADX at 28.58 indicates a strong uptrend, but the RSI at 74.04 is flirting with overbought territory. This suggests that while the momentum is to the upside, the pace may be unsustainable in the very short term, potentially leading to a period of consolidation or a minor pullback. The MACD is positive and above its signal line, supporting the bullish momentum, but the Stochastic Oscillator, with %K at 83.65 and %D at 74.2, is also in the upper reaches, hinting at potential overextension. It’s a classic case of strong trend meeting overbought conditions, a scenario that often precedes a pause or a minor correction before the next leg higher, IF the underlying fundamentals remain supportive.
The daily chart offers a broader perspective. The trend is still classified as Up (Power: 93%), and the RSI at 67.12 is in bullish territory but not yet in the extreme overbought zone. This gives the bulls some room to maneuver. The MACD histogram remains positive, indicating sustained upward momentum on the daily timeframe. However, the ADX at 35.95 points to a strong trend, which can sometimes lead to extended moves before any significant reversal. The critical support level to watch on the daily chart is $99.36. A decisive break below this level would likely signal a weakening of the bullish conviction and could open the door for a more significant correction. Conversely, resistance is clearly defined around $100.23. A sustained move above this resistance level, particularly on increasing volume, would likely confirm the continuation of the uptrend and could pave the way for further gains towards the next significant technical barrier.
The interplay between the DXY and other markets is crucial for understanding the broader risk sentiment. With the DXY strengthening, we typically see pressure on gold and silver prices, as well as on major currency pairs like EUR/USD and GBP/USD. Currently, XAUUSD is trading at $4719.98, down 2.05% for the day, with its 1-hour ADX at a robust 48.71 indicating a strong downtrend. This inverse correlation is playing out as expected. Similarly, EUR/USD is hovering around 1.1447, showing a daily downtrend (Power: 99%), a direct consequence of dollar strength. The Nasdaq 100, a key indicator of risk appetite, is trading at 24349.01, down 0.13% on the day, with its 1-hour ADX at 44.85 signalling a strong downtrend. This suggests that risk aversion is present, which typically benefits the dollar, reinforcing the DXY's upward bias. The market is clearly leaning towards safety and dollar strength in the current environment.
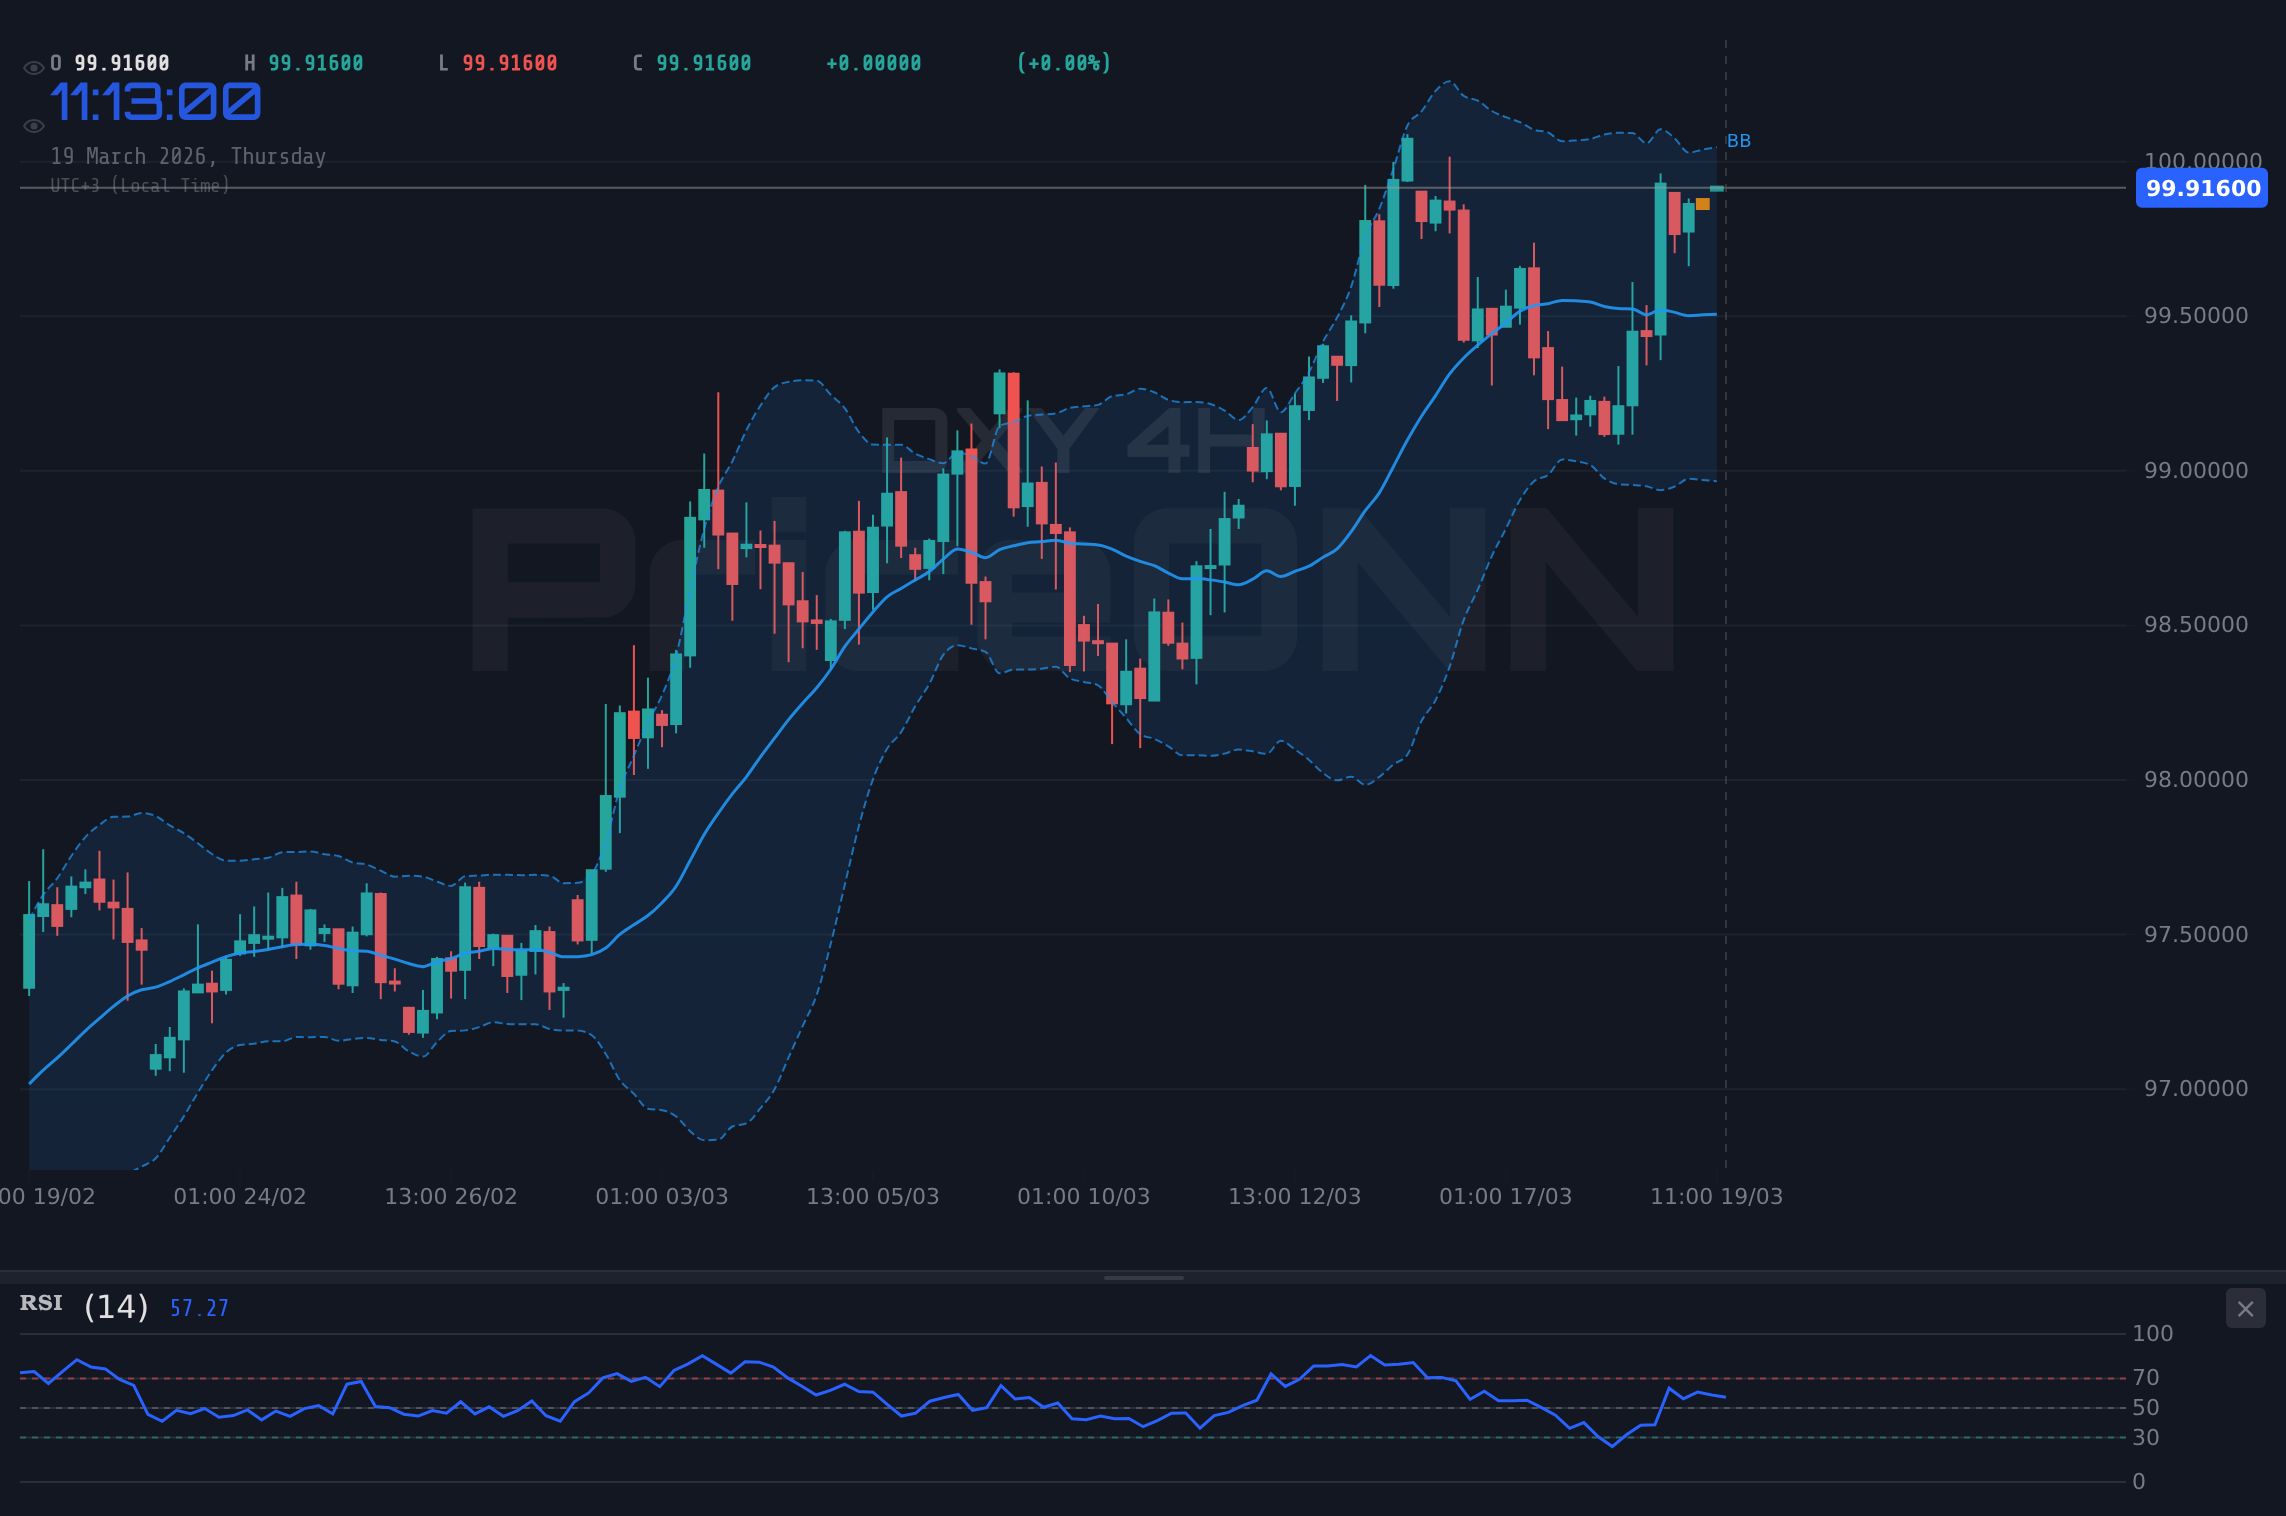
When we analyze the intraday movements, the 1-hour chart for DXY presents a picture of a strong uptrend, but with signs of exhaustion near the $100.06 level. The price is trading above the middle Bollinger Band, indicating bullish sentiment, but the upper band is being tested. The Stochastic Oscillator is in overbought territory, and while the ADX confirms trend strength, the RSI's proximity to 75 warrants caution for aggressive long entries at these exact levels. This suggests that while the overall direction is up, the immediate risk/reward for new long positions might be less favorable without a clear breakout confirmation or a minor pullback to a more attractive entry point. Patience here could be a trader's best friend.
The 4-hour timeframe provides a slightly different lens. The trend is still classified as neutral (Power: 50%), which is interesting given the 1-hour and daily strength. The RSI is at 64.2, still comfortably in bullish territory but not yet overbought. The MACD is positive, and the ADX at 23.3 indicates a moderate trend. The Stochastic Oscillator is significantly overbought at 91.3, signaling that the upward move on this timeframe might be due for a pause or reversal. This divergence between the overall trend strength and the overbought Stochastic on the 4-hour chart highlights the potential for choppiness around current levels. It suggests that while the direction might be up, we could see sideways movement or minor pullbacks as the market digests the recent gains and waits for fresh catalysts.
The recent news flow, particularly the jump in oil prices and the hawkish Fed undertones, has significantly influenced market sentiment. The unexpected geopolitical events leading to the oil surge, pushing Brent past $108 and WTI higher, have reignited inflation fears. This aligns perfectly with the Fed's cautious approach to rate cuts. The market is now pricing in a scenario where inflation remains a concern, forcing the Fed to maintain a tighter monetary policy for longer. This environment is inherently supportive of the US dollar. The DXY's ability to hold $100.06 is a direct reflection of this macroeconomic backdrop. It’s a clear signal that the market is positioning for a stronger dollar in the near to medium term, barring any significant shifts in central bank rhetoric or a de-escalation of geopolitical tensions.
Trade Scenarios and Outlook
Bearish Scenario: Dollar Weakening Under Pressure
30% ProbabilityNeutral Scenario: Consolidation Around $100.06
35% ProbabilityBullish Scenario: Dollar Strength Continues
35% ProbabilityThe current technical setup on the DXY presents a compelling, albeit complex, picture. While the daily trend remains strong, the intraday indicators are flashing signs of potential exhaustion near the $100.06 level. The confluence of hawkish Fed expectations and rising oil prices provides fundamental support for the dollar, suggesting that any consolidation might be temporary. However, traders must remain vigilant. A close below the critical daily support at $99.36 would invalidate the immediate bullish outlook and signal a potential shift in momentum. Conversely, a decisive breakout above the $100.23 resistance, backed by strong volume, could confirm the next leg higher. The market is at a crossroads, and the next few trading sessions will be crucial in determining the short-term direction. Risk management remains paramount; understanding these levels and acting with discipline will be key to navigating this environment.
The market is highly sensitive to geopolitical developments and incoming economic data, particularly inflation figures and Fed commentary. Any unexpected news could lead to sharp price movements and increased volatility. Always manage your risk exposure and ensure your stop-loss orders are appropriately placed.
For those looking to trade the DXY, patience and precision are key. Waiting for a clear confirmation of a breakout above $100.23, or a pullback to a more favorable entry level near the daily support of $99.36, might offer a better risk-reward ratio than chasing the price at current levels. The market is giving us signals; the art of trading is in interpreting them correctly and acting decisively when the setup aligns with your strategy. Remember, discipline is your greatest ally in these dynamic market conditions.
Frequently Asked Questions: DXY Analysis
What happens if DXY breaks decisively above the $100.23 resistance level?
A sustained move above $100.23 would likely trigger further buying pressure, potentially targeting the daily resistance levels at $100.54 (R2) and then $101.11 (R3). This would confirm the continuation of the bullish trend, supported by hawkish Fed expectations.
Should I buy DXY at current levels of $100.06 given the RSI at 67.12?
Entering long at $100.06 with the daily RSI at 67.12 carries some risk of a short-term pullback due to approaching overbought conditions. A more prudent approach might be to wait for a minor dip towards support or confirmation of a breakout above resistance, offering a better risk-reward profile.
Is the RSI at 67.12 a sell signal for DXY right now?
An RSI of 67.12 is not a definitive sell signal; it indicates strong upward momentum but is not yet in the extreme overbought territory (typically considered above 70 or 75). While it suggests caution for new longs, it doesn't automatically signal a reversal without other confirming bearish indicators or price action.
How will the recent oil price surge and Fed hawkishness affect DXY this week?
The combination of surging oil prices, signaling inflation concerns, and the Fed's hawkish stance is fundamentally supportive of the DXY. This environment suggests the dollar could continue to strengthen, pushing DXY higher, provided no major geopolitical de-escalation occurs or the Fed signals a less restrictive path.
| Indicator | Value | Signal | Interpretation |
|---|---|---|---|
| RSI (14) | 67.12 | Neutral | Approaching overbought; watch for consolidation |
| MACD Histogram | Positive | Bullish Momentum | Sustained buying pressure |
| Stochastic | K=83.65, D=74.2 | Bullish | Overbought territory; potential for pause |
| ADX | 35.95 | Strong Trend | Confirms established upward momentum |
| Bollinger Bands | Middle Band | Bullish | Price above middle band; supports uptrend |
Track markets in real-time
AI-powered analysis, technical indicators and real-time price data.
Join Our Telegram Channel
Breaking market news, AI analysis and trading signals instantly.
Join Channel