NZDUSD Technical Analysis: Bears Test $0.58492 Resistance Amid Weakening Trend
NZDUSD faces critical resistance at $0.58492. With a weak trend and oversold indicators, traders eye potential bounces, but a breakdown below $0.58076 could accelerate losses.
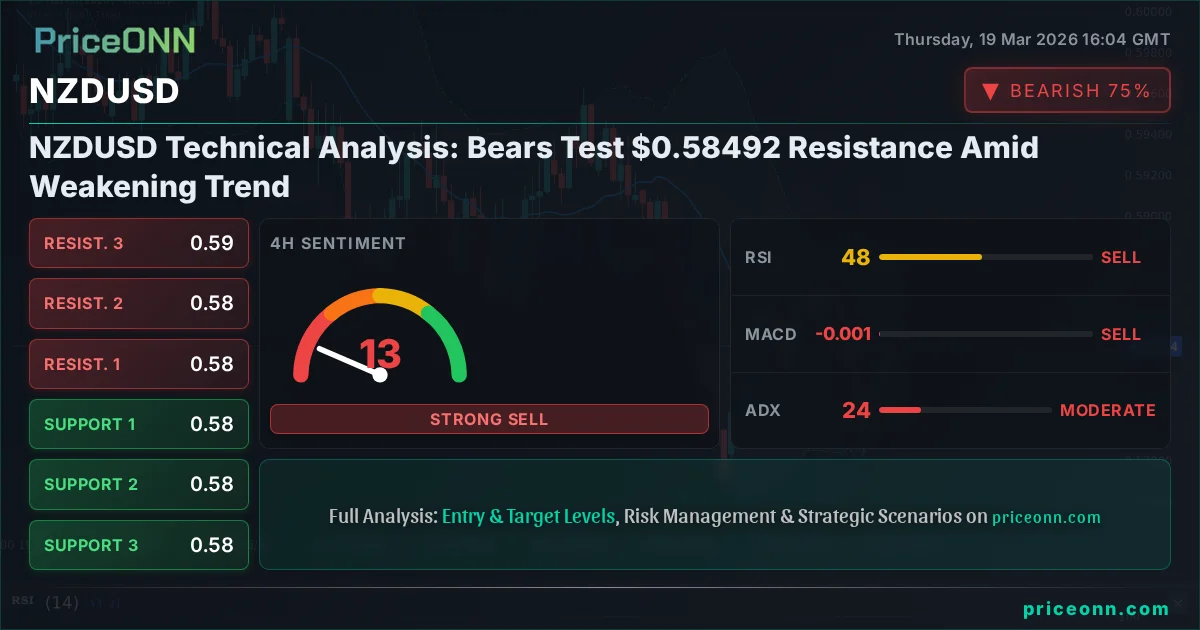
The New Zealand Dollar against the US Dollar (NZDUSD) is currently navigating a crucial juncture, trading at $0.58382. Following a significant daily decline of -0.74%, the pair is testing the upper bounds of its immediate trading range, with bears eyeing the $0.58492 resistance level. This price action unfolds amidst a backdrop of mixed technical signals across multiple timeframes, suggesting a period of heightened volatility and potential for a decisive move. Traders are closely monitoring whether the current resistance will hold, potentially leading to a further test of key support levels, or if a breakout above will signal a shift in momentum.
- NZDUSD faces critical resistance at the $0.58492 level, tested today amidst a daily drop of -0.74%.
- The 1-hour RSI at 53.96 indicates a neutral stance, while the 4-hour RSI at 44.14 suggests a bearish lean, reflecting conflicting short-term sentiment.
- Key support is identified at $0.58076 (S1) on the 4-hour chart, while immediate resistance sits at $0.58469 (R1) on the 1-hour chart.
- The ADX across timeframes ranges from 13.72 (1H) to 28.38 (1D), indicating a predominantly weak to strong downtrend, suggesting the current price action might be a temporary consolidation.
The 1-hour chart paints a picture of cautious optimism for the bulls, with the Relative Strength Index (RSI) hovering around 53.96. This is firmly within neutral territory, suggesting neither extreme overbought nor oversold conditions, but the MACD histogram is showing positive momentum, indicating that buying pressure is currently present on this short-term timeframe. Stochastic oscillators are also showing a bullish signal, with the %K line at 81.5 crossing above the %D line at 62.05, suggesting upward momentum may continue in the immediate term. However, the Average Directional Index (ADX) at 13.72 signals a very weak trend, implying that any upward movement might lack conviction and could be susceptible to reversal. This combination of a weak trend with bullish short-term indicators suggests that while there's some upward pressure, the underlying market structure is not yet confirming a strong bullish reversal.
Digging deeper into the 4-hour timeframe, the technical indicators present a more bearish outlook. The RSI here is significantly lower, sitting at 44.14, which leans towards a bearish sentiment as it falls below the 50-midpoint. The MACD is showing negative momentum, indicating that selling pressure is building on this intermediate timeframe. The Stochastic Oscillator, while showing a potential for a bounce with %K at 43.25 and %D at 35.25, is still in a lower range. More concerning is the ADX, which reads 23.71. While not a 'strong' trend reading, it signifies a more established downtrend than on the 1-hour chart, suggesting that the prevailing sentiment is downwards. The Bollinger Bands on the 4-hour chart are also positioned below the middle band, reinforcing the bearish inclination. This divergence between the short-term bullish signals and the intermediate-term bearish indicators highlights the indecision in the market and the importance of observing how the price reacts around key levels.
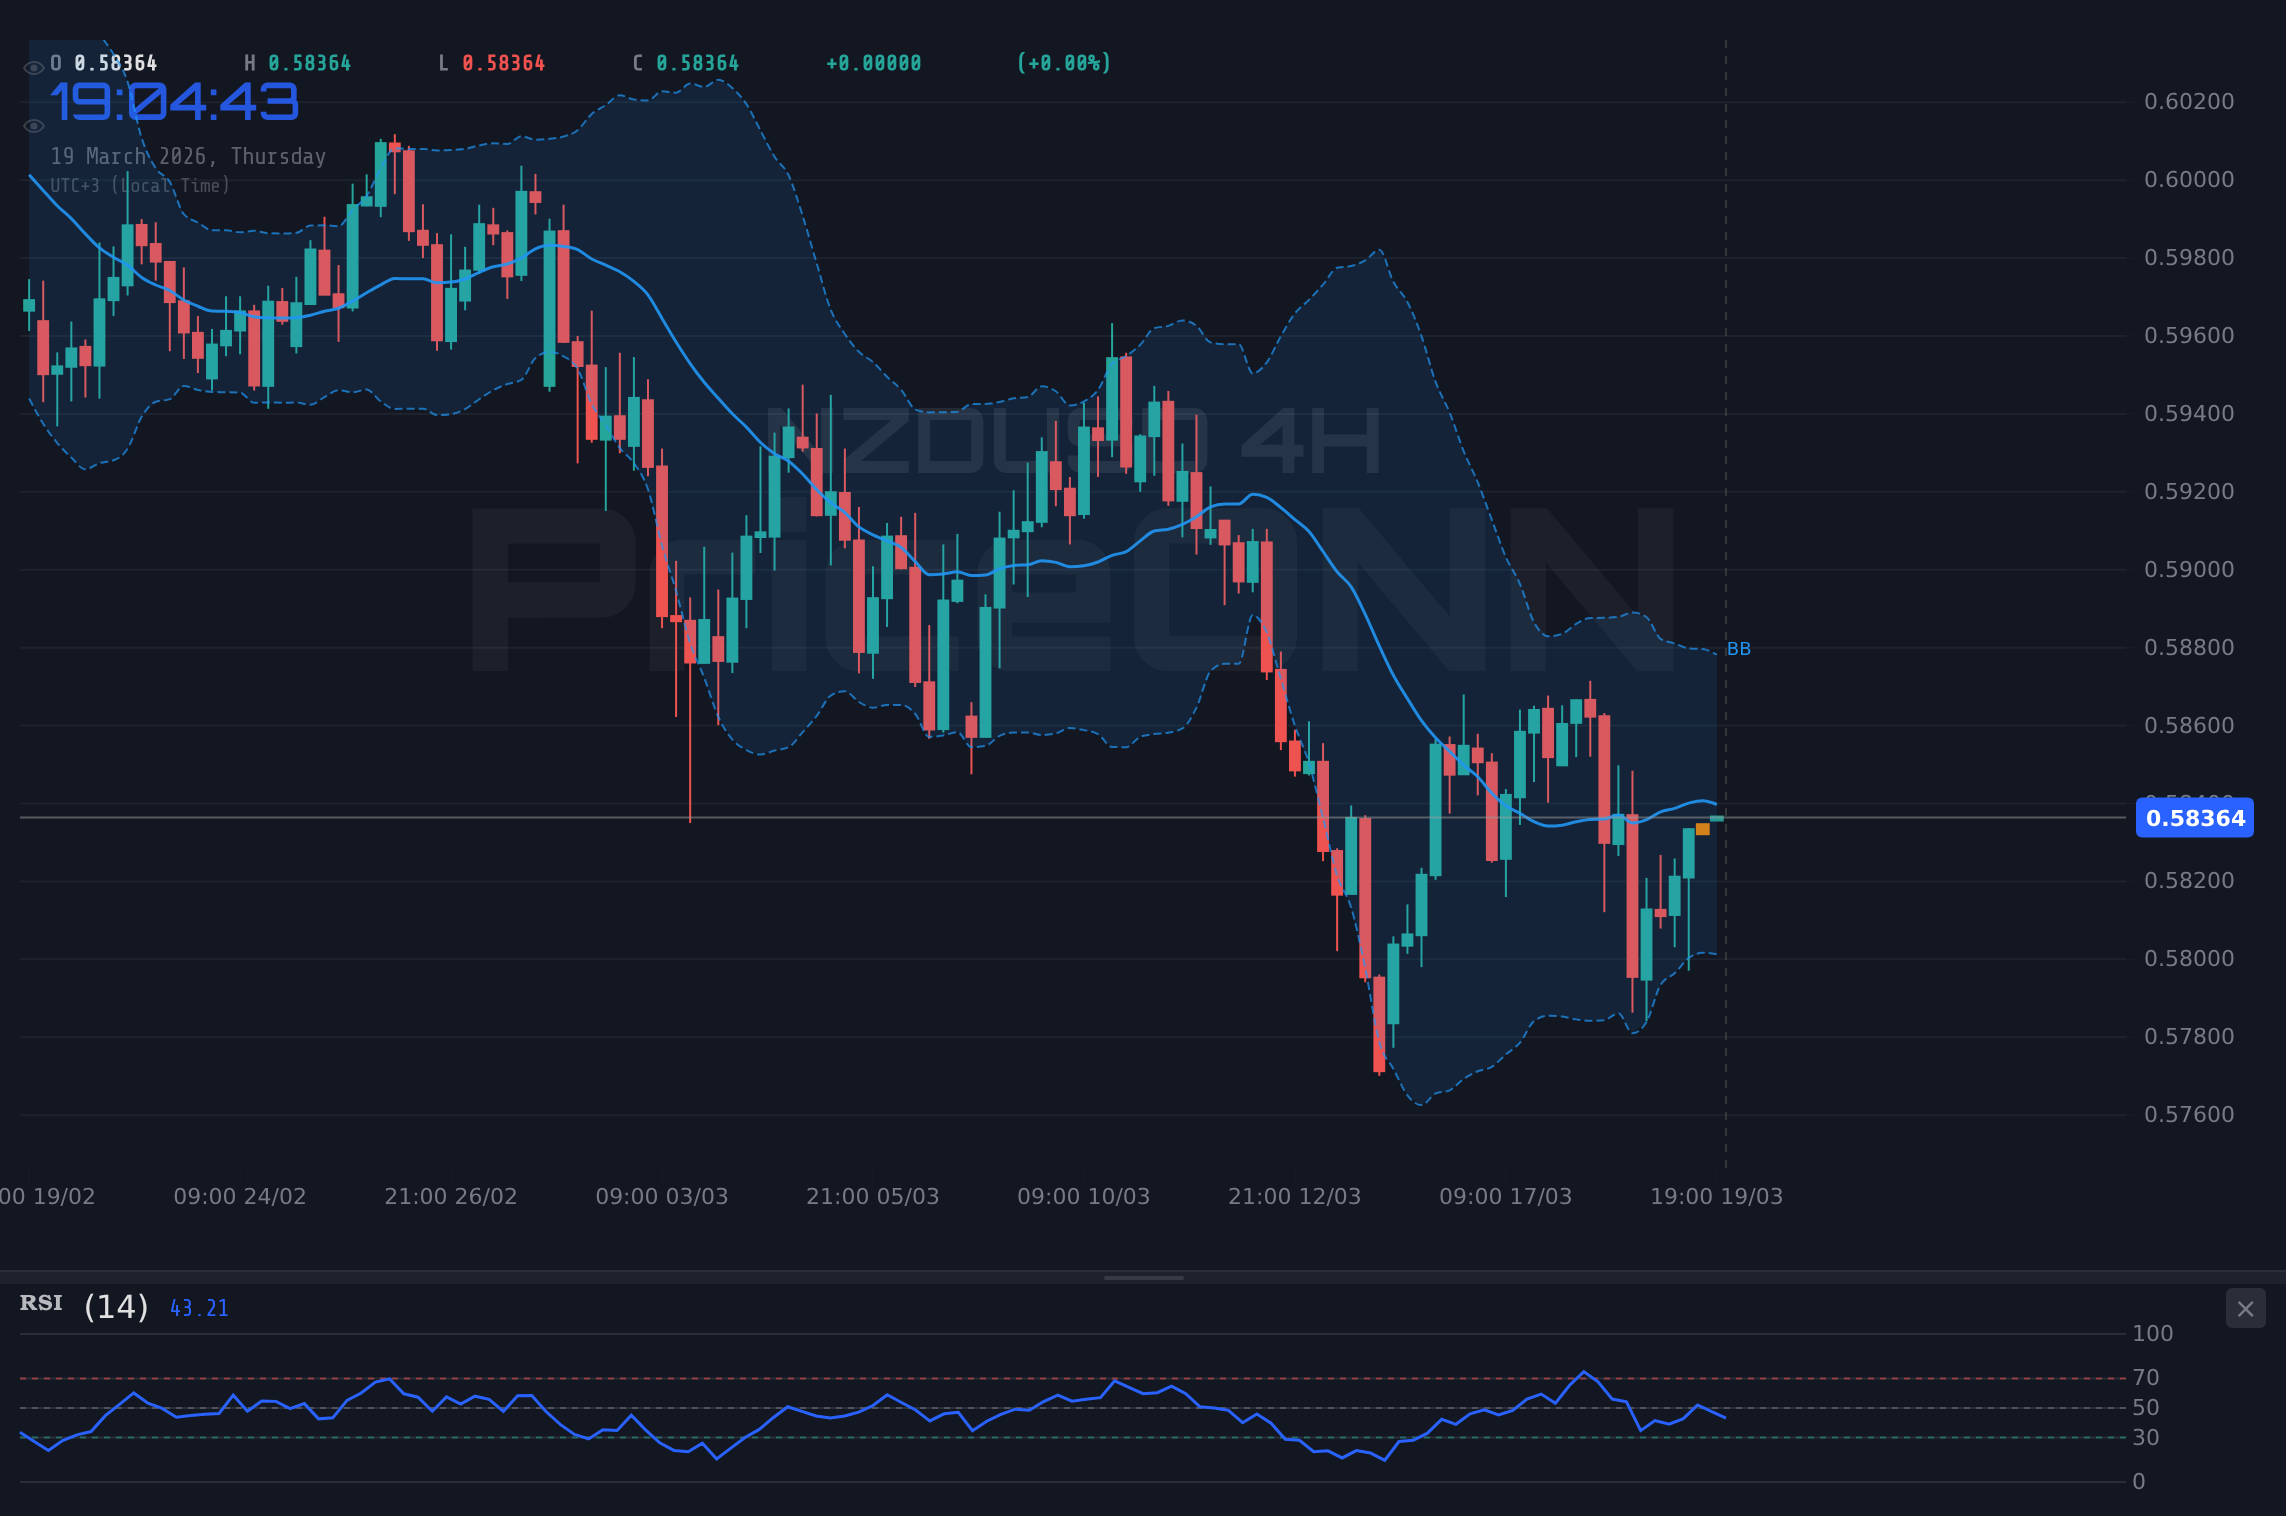
On the daily chart, the NZDUSD presents a predominantly bearish picture, though with some conflicting signals that warrant attention. The RSI stands at 42.6, comfortably in neutral territory but leaning towards the bearish side, indicating room for further downside before reaching oversold conditions. The MACD indicator is generating negative momentum, with the MACD line below its signal line, reinforcing the bearish bias on this longer timeframe. The Stochastic Oscillator, however, shows a potential buy signal with %K at 29.33 crossing above %D at 26.98, hinting at a possible oversold bounce. The ADX on the daily chart is at 28.38, indicating a strong downtrend is in play, which aligns with the overall bearish sentiment. The Bollinger Bands are also below the middle band, further confirming the downward pressure. The significant daily drop of -0.74% and the current price hovering near resistance suggest that the bears are actively defending key levels.
The current price action around $0.58382 is critical. On the 1-hour chart, the immediate resistance is identified at $0.58469. A sustained push above this level, potentially fueled by continued bullish momentum from the Stochastic, could see the pair target the next resistance at $0.58566. However, the underlying weak trend indicated by the 1-hour ADX makes such a move questionable without further confirmation. Conversely, a failure to break above $0.58469 could lead to a retest of the 1-hour support at $0.58270. Given the mixed signals, the 1-hour chart suggests a potential for range-bound trading or a whipsaw move before a clearer direction emerges.
Looking at the 4-hour timeframe, the key support level to watch is $0.58076. A break below this point would invalidate any short-term bullish hopes and could accelerate selling pressure towards the next support at $0.57939. This level is significant as it represents a more substantial floor where buyers might step in more aggressively. The resistance on the 4-hour chart is set at $0.58304. If the price can decisively break and hold above this level, it would suggest a potential shift in the intermediate-term sentiment. However, with the RSI below 50 and MACD showing negative momentum, overcoming this resistance will be challenging. The ADX reading of 23.71 on this timeframe implies that the market is not yet in a strong trending phase, making breakouts less reliable.
The daily chart reinforces the bearish outlook, with the primary support level located at $0.57640. A decisive close below this mark would signal a significant bearish development, potentially opening the door for a much larger decline towards $0.57326. On the upside, the first significant resistance barrier is at $0.58492. This is the level that bears are currently testing and defending. A strong daily close above $0.58492 would be a crucial bullish signal, suggesting that the downtrend might be faltering and a reversal could be on the cards, with the next target at $0.59030. The ADX at 28.38 on the daily chart confirms that a strong trend is in place, and the current price action is occurring within the context of this dominant downward movement.
The Bank of Japan's decision to hold rates steady at 0.75% this Thursday, as reported by breaking news, while oil prices surge due to geopolitical fears, creates a complex global economic backdrop. Although this news doesn't directly impact NZDUSD, it contributes to a broader market sentiment. The strengthening US Dollar, as hinted at by the Fed's projection of fewer rate cuts and the NZD's weak Q4 GDP growth of just 0.2%, is likely putting downward pressure on the pair. The reported weakness in New Zealand's economy raises concerns about its growth prospects, potentially making the NZD less attractive to investors compared to the USD, especially if the Federal Reserve maintains a hawkish stance. This macroeconomic backdrop aligns with the bearish technical signals observed on the longer timeframes for NZDUSD.
Considering the technical indicators and the macroeconomic environment, the prevailing sentiment for NZDUSD leans bearish, especially on the daily and 4-hour charts. The ADX readings across all timeframes (13.72, 23.71, 28.38) indicate a dominant downtrend, with the daily chart showing a strong trend. While the 1-hour chart exhibits some bullish divergence with the Stochastic oscillator and positive MACD momentum, this is overshadowed by the bearish signals on the higher timeframes. The RSI on the 1-hour chart is neutral, but the 4-hour RSI is bearish, and the daily RSI is also leaning bearish. The key resistance at $0.58492 is currently being tested, and a failure to break above it, especially with the strong downtrend indicated by the ADX, would likely lead to further downside.
The recent news regarding the Bank of Japan holding rates steady amidst rising oil prices and geopolitical tensions, while relevant to global markets, indirectly affects NZDUSD by influencing currency correlations. More directly, the reported faltering NZ GDP growth of 0.2% in Q4 2025, missing forecasts, coupled with the Fed's signal of potentially fewer rate cuts, creates a bearish fundamental outlook for the pair. This suggests that the US Dollar may continue to find strength against the New Zealand Dollar. The technical picture supports this, with the daily and 4-hour charts showing strong bearish trends. The immediate focus remains on the $0.58492 resistance. A rejection here could see NZDUSD fall back towards the $0.58076 support level, aligning with the prevailing downward momentum.
The divergence in signals between the short-term (1H) and longer-term (4H, 1D) timeframes presents a challenge for traders. The 1-hour chart shows a potential for a short-term bounce, with Stochastic and MACD showing some positive signs. However, the higher timeframes, particularly the strong downtrend indicated by the daily ADX at 28.38, suggest that any bounce is likely to be a counter-trend move within a larger bearish structure. Therefore, traders should exercise caution. A break above the immediate 1-hour resistance at $0.58469 might offer a small scalping opportunity, but the probability of a sustained move is low given the overall trend. The more significant levels to watch are the daily support at $0.57640 and resistance at $0.58492. Trading strategies should likely focus on the prevailing downtrend, looking for opportunities to short on pullbacks or after a confirmed break of support.
The current market sentiment, characterized by a strong US Dollar outlook due to Fed policy signals and a weakening New Zealand economy, coupled with the bearish technical setup on the NZDUSD, paints a clear picture. The pair is testing a significant resistance level at $0.58492. Failure to overcome this hurdle, especially with the dominant downtrend confirmed by the daily ADX, suggests that further depreciation is likely. The key support to monitor remains at $0.58076 on the 4-hour chart. A break below this level would confirm the bearish thesis and could trigger a cascade towards lower price targets. Conversely, a decisive breakout above $0.58492, sustained by strong volume and positive fundamental news, would be required to invalidate the bearish outlook and signal a potential trend reversal.
The energy markets are also presenting a mixed picture, with Brent crude oil prices surging past $112 amid Iran-Israel tensions, while WTI crude slipped to $96 as the US Dollar strengthened. This geopolitical backdrop adds another layer of complexity, potentially increasing safe-haven demand for the USD and further pressuring risk-sensitive currencies like the NZD. The strong upward move in Brent, driven by supply concerns, could fuel inflation expectations, which might influence central bank policies globally, although the immediate impact on NZDUSD seems secondary to the direct economic and Fed-related factors. The correlation between oil prices, inflation, and currency movements is something to keep an eye on, but for now, the domestic economic data and Fed policy outlook appear to be the primary drivers for NZDUSD.
The breakdown of NZDUSD below key psychological levels and its current struggle near resistance underscores the importance of risk management. While the 1-hour chart might tempt some traders with oversold Stochastic signals, the overwhelming bearish sentiment on higher timeframes, particularly the strong daily ADX, suggests that such opportunities are likely to be short-lived counter-trend moves. The probability of the pair continuing its downward trajectory, especially if it fails to break above $0.58492, remains high. Traders should be prepared for potential consolidation around the current levels before the next significant move, but the overall bias should remain bearish until key resistance levels are decisively breached with conviction.
The technical indicators on the 1-hour chart, such as the RSI at 53.96 and Stochastic showing bullish signals, might suggest a short-term upward movement. However, this is contrasted by the bearish MACD and a very weak ADX trend strength of 13.72. On the 4-hour chart, the RSI dips to 44.14 and the MACD shows negative momentum, with ADX at 23.71 indicating a more established downtrend. The daily timeframe reinforces this bearish bias with an RSI of 42.6, negative MACD, and a strong ADX of 28.38. The confluence of bearish signals on higher timeframes, coupled with the fundamental weakness in the New Zealand economy and a potentially hawkish Fed stance, points towards a bearish outlook for NZDUSD. The critical resistance at $0.58492 is the key level to watch; a failure to break it could initiate a move towards the $0.58076 support.
Bearish Scenario: Breakdown Below Support
65% ProbabilityNeutral Scenario: Consolidation Around Resistance
25% ProbabilityBullish Scenario: Breakout Above Resistance
10% ProbabilityFrequently Asked Questions: NZDUSD Analysis
What happens if NZDUSD breaks below the $0.58076 support level?
A break below the 4-hour support at $0.58076 would likely trigger a bearish move, invalidating short-term bullish hopes. This could accelerate selling pressure towards the next support at $0.57939, aligning with the prevailing downtrend indicated by the daily ADX.
Should I trade NZDUSD at current levels of $0.58382 given the conflicting signals?
Given the conflicting signals between the 1-hour and higher timeframes, caution is advised. A high-probability setup would involve waiting for a confirmed break of either the $0.58492 resistance or the $0.58076 support. The current price action presents a riskier entry without clear confirmation.
Is the RSI at 44.14 on the 4-hour chart a sell signal for NZDUSD?
An RSI of 44.14 on the 4-hour chart leans bearish, falling below the 50 midpoint and indicating room for further downside before oversold conditions are met. While not an immediate sell signal on its own, it reinforces the bearish bias seen on higher timeframes.
How will the Fed's signal of fewer rate cuts affect NZDUSD this week?
The Fed signaling fewer rate cuts likely strengthens the US Dollar, creating a headwind for NZDUSD. This fundamental factor supports the bearish technical outlook, suggesting that resistance levels like $0.58492 may hold firm, potentially leading to further declines in the pair.
Track markets in real-time
AI-powered analysis, technical indicators and real-time price data.
Join Our Telegram Channel
Breaking market news, AI analysis and trading signals instantly.
Join Channel