The currency markets are holding their breath as AUDUSD finds itself at a critical juncture, hovering around the $0.68496 mark. This pivotal moment arrives not just with significant technical levels in play, but also with the looming specter of Federal Reserve Chair Jerome Powell's testimony and escalating geopolitical tensions in the Middle East. The interplay between these fundamental forces and the granular technical signals is creating a complex, yet potentially rewarding, landscape for traders ready to navigate the volatility. Understanding AUDUSD today analysis requires a deep dive into the macro backdrop, the technical indicators, and the specific price action that will dictate the next move.
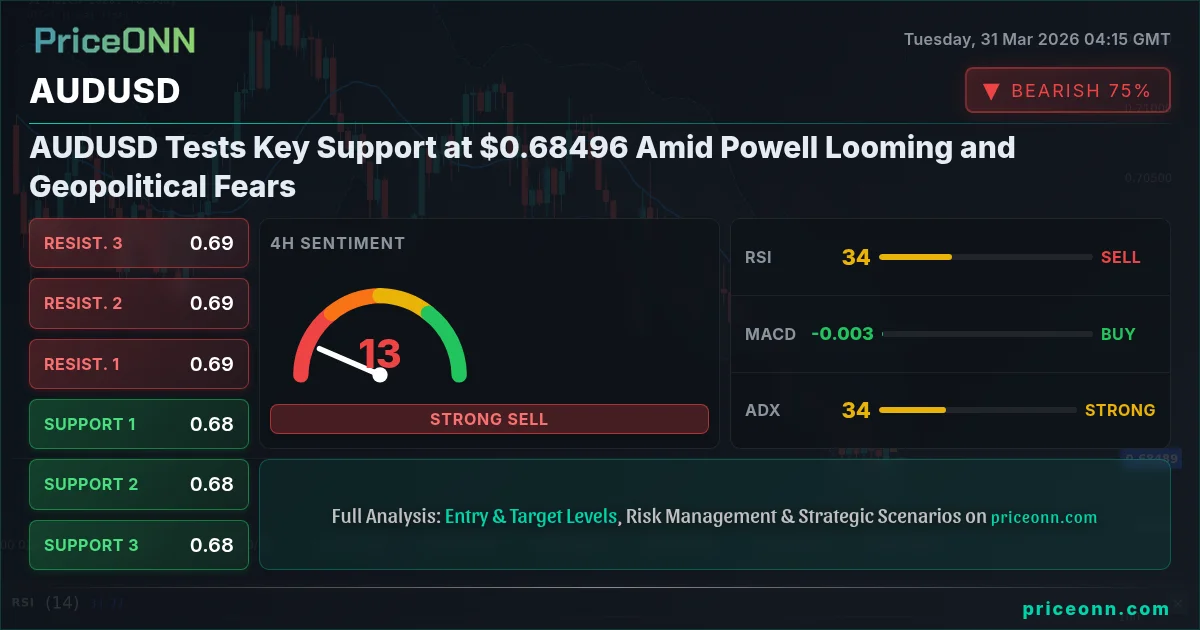
- AUDUSD is currently trading at $0.68496, testing key support levels as geopolitical risks and Fed expectations drive market sentiment.
- Critical support sits at $0.68409, a level that has historically acted as a floor; a break below could trigger significant downside.
- RSI at 43.78 on the 1H chart signals bearish pressure, while the 1D ADX at 27.65 indicates a strong downtrend in play.
- The strengthening DXY (currently 100.25) is adding pressure to AUDUSD, reflecting a risk-off sentiment driven by oil price surges and Middle East instability.
The narrative surrounding AUDUSD is currently dominated by a confluence of factors, making a straightforward directional call a challenge. On the technical front, the daily chart paints a bearish picture, with the ADX at 27.65 suggesting a strong downtrend is in motion. This is further reinforced by the RSI(14) reading of 36.16 on the daily timeframe, indicating significant bearish momentum. However, the 1-hour and 4-hour charts show some signs of potential stabilization or even a minor bounce, with RSI readings hovering around 43-56 and some buy signals appearing in shorter timeframes. This divergence across timeframes highlights the current indecision in the market, where short-term technicals might be battling against the dominant longer-term trend.
Navigating the Technical Crosscurrents for AUDUSD
Delving deeper into the technicals, AUDUSD's price action on the 1-hour chart reveals a cautious approach, with the pair trading around $0.68496. The trend is currently categorized as 'Düşüş' (Downfall) with 85% strength, yet the ADX at 19.18 suggests a relatively weak trend, implying that the downtrend might be losing steam or entering a consolidation phase. The RSI(14) at 43.78 is in neutral territory but trending downwards, aligning with the bearish bias. However, the Stochastic oscillator is showing a bullish divergence with %K (58.48) crossing above %D (58.23), hinting at potential upward momentum in the very short term. This mixed signal set on the 1H chart suggests that while the overall sentiment is bearish, there might be short-lived counter-trend opportunities or consolidation before the next major move.
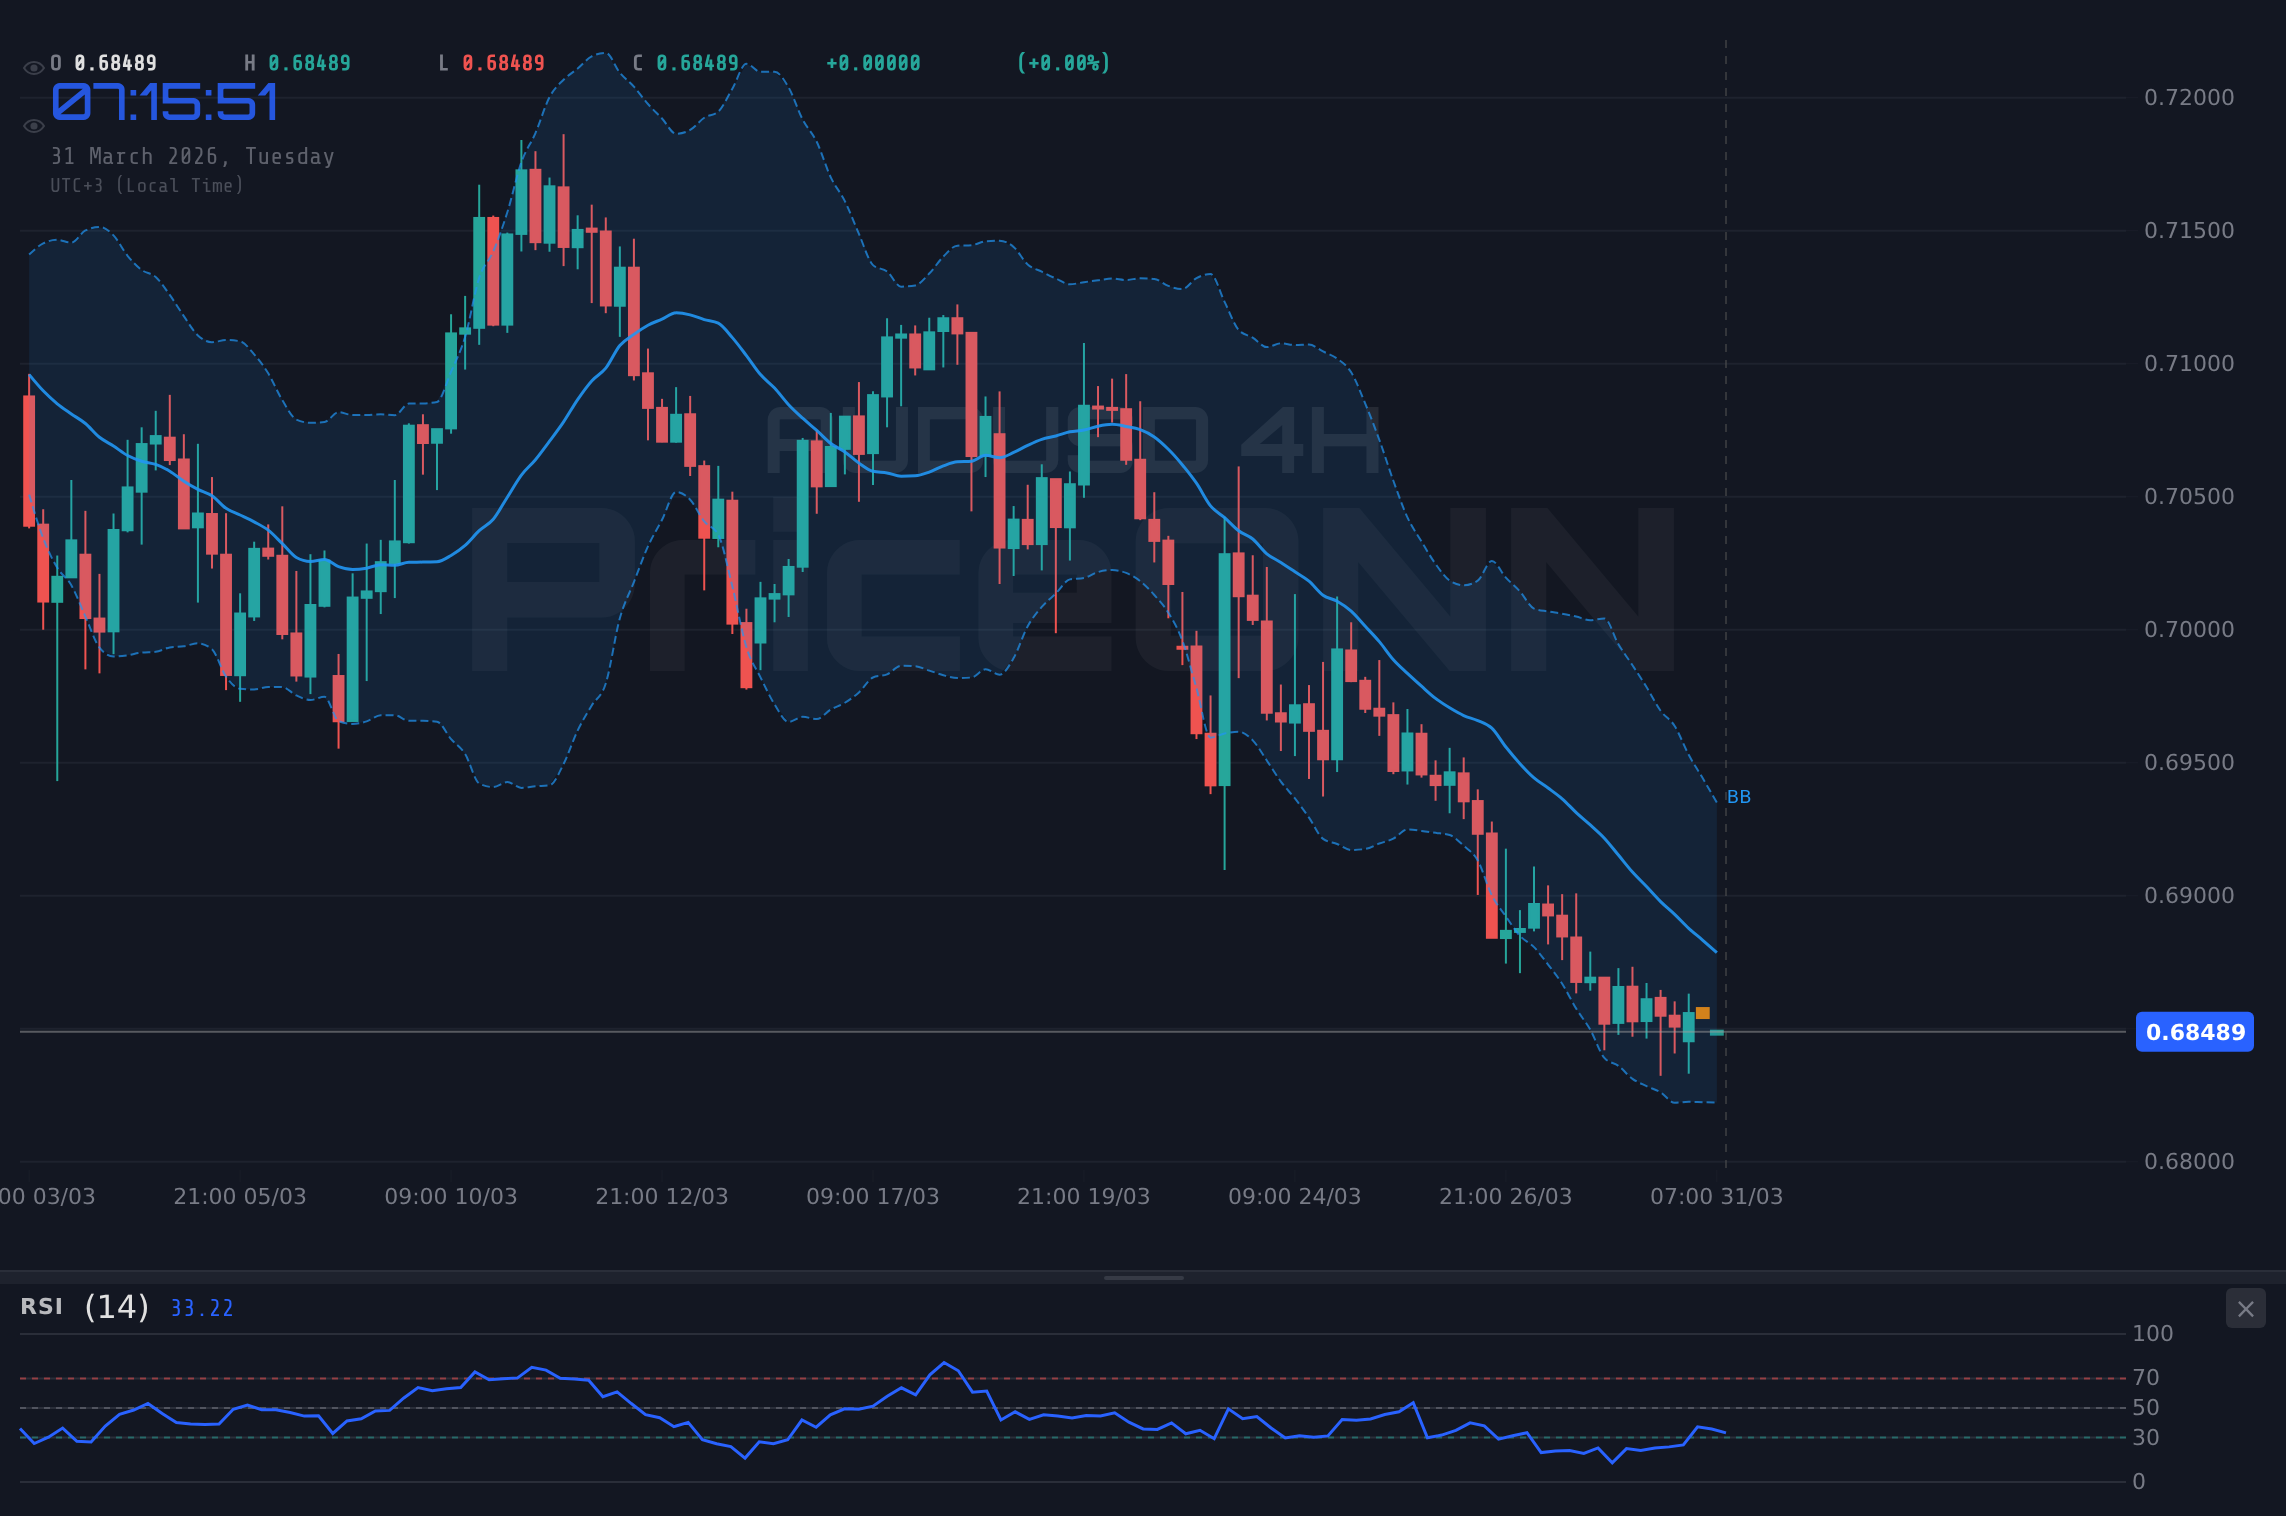
The 4-hour timeframe amplifies the bearish outlook. Here, the trend is strongly 'Düşüş' (Downfall) with 97% strength. The ADX reading of 33.89 confirms a strong downtrend, and the RSI(14) at 33.71 is firmly in oversold territory, suggesting that further downside might be limited in the near term, or that a correction is due. The Stochastic oscillator, with %K at 30.98 and %D at 24.38, also indicates a potential bullish reversal signal, as %K is above %D and moving upwards from oversold levels. This is a classic case of conflicting signals: a strong downtrend indicated by ADX and RSI, but potential oversold exhaustion signaled by Stochastic. Traders are watching closely to see if this oversold condition can translate into a meaningful bounce or if the strong trend will simply push lower.
The divergence between shorter-term bullish signals from Stochastic and the dominant bearish trend indicated by daily ADX and RSI is a key point. This suggests that any bounce might be a corrective move within a larger downtrend, rather than a fundamental shift in direction. The $0.68409 support level is crucial; a decisive break below it would invalidate any short-term bullish hopes and likely accelerate the descent towards lower targets.
On the daily chart, the picture becomes even clearer regarding the prevailing bearish sentiment. The trend is firmly 'Düşüş' (Downfall) with 89% strength, and the ADX at 26.75 confirms a solid downtrend. The RSI(14) sits at 36.16, well below the 50-midpoint and indicating bearish control. The Stochastic oscillator is in the oversold region, with %K at 4.98 and %D at 15.44, strongly suggesting that the pair is deeply oversold on a daily basis. This oversold condition on the daily chart is the primary reason for considering potential bounces or consolidation. However, the overall trend strength and the directional bias from ADX and RSI suggest that any rallies might be opportunities for sellers to re-enter the market at better prices, rather than the start of a sustained uptrend.
Macroeconomic Headwinds and Geopolitical Storms
The macroeconomic environment is a significant driver of AUDUSD's current weakness. The US Dollar Index (DXY), currently trading at 100.25, is showing signs of strength, particularly on the daily and 4-hour charts, with ADX at 28.62 and 33.32 respectively, indicating a robust uptrend. A stronger dollar typically exerts downward pressure on currency pairs like AUDUSD, as the Australian dollar is often viewed as a riskier asset compared to the perceived safe-haven status of the US dollar. The current DXY level of 100.25 suggests that global demand for the dollar remains elevated, likely fueled by uncertainty and a desire for safety.
Adding to the pressure on AUDUSD are the escalating geopolitical tensions in the Middle East. Crude oil prices, a key indicator of global inflation expectations and geopolitical risk, have surged. WTI crude is trading around $103.32, and Brent around $110.97. This rise in oil prices, driven by supply concerns stemming from the Middle East conflict, directly impacts inflation expectations globally. Higher inflation can complicate central bank policy, potentially leading to prolonged higher interest rates or more aggressive tightening, which typically favors currencies like the USD over commodity-linked currencies such as the AUD.
The Middle East conflict remains a significant wildcard. Any further escalation could lead to sharper increases in oil prices, further stoking inflation fears and potentially prompting central banks to adopt more hawkish stances. This would likely strengthen the USD and put additional downward pressure on AUDUSD, potentially accelerating a move below the critical $0.68409 support level. Traders should monitor news flow from the region closely.
The upcoming testimony from Federal Reserve Chair Jerome Powell is another crucial event on the horizon. While the Fed Funds futures data isn't explicitly provided here, the general market sentiment suggests that Powell's remarks will be scrutinized for any hints about the future path of interest rates. If Powell adopts a hawkish tone, emphasizing the persistence of inflation and the need for continued vigilance, it could further bolster the dollar and weigh on AUDUSD. Conversely, any dovish signals or acknowledgments of slowing economic momentum could provide temporary relief for the pair. The market's reaction to Powell's testimony will be a key determinant of AUDUSD's near-term trajectory, especially as it approaches significant technical support.
The Australian economic calendar, while less impactful globally than Fed speak, still holds relevance. The recent economic data, such as the previous figures for [EUR] (0.2), [GBP] (0.1), and [USD] (-0.2), provide context for the broader currency landscape. While specific upcoming Australian data points are not detailed, any significant deviations from forecasts in upcoming releases, particularly concerning inflation or employment, could influence the Reserve Bank of Australia's (RBA) monetary policy outlook and, consequently, the AUD's performance against the USD. However, the current global macro and geopolitical narrative appears to be overshadowing domestic Australian factors for AUDUSD.
Trading Scenarios and Risk Management
Given the conflicting signals and the high-impact events on the horizon, a scenario-based approach to trading AUDUSD is prudent. The technical picture, particularly on the daily chart, leans bearish, but the oversold conditions and potential for short-term bounces cannot be ignored. The $0.68409 support level on the 1-hour chart and the $0.68310 level on the daily chart are critical price points to watch. A break below these levels could signal a continuation of the downtrend, while holds could lead to a short-term corrective rally.
Bearish Scenario: Trend Continuation
65% ProbabilityNeutral Scenario: Consolidation and Observation
25% ProbabilityBullish Scenario: Short-Term Rebound
10% ProbabilityThe dominant trend on the daily chart, confirmed by ADX 27.65 and RSI 36.16, suggests that the path of least resistance is still downwards. The oversold Stochastic on the daily chart at 4.98/15.44 presents a risk for short-sellers, as it indicates that the market is deeply fatigued to the downside and could be prone to sharp, albeit potentially short-lived, bounces. Therefore, the 65% probability assigned to the bearish scenario reflects the prevailing technical trend, while the neutral scenario accounts for potential consolidation ahead of major news events. The bullish scenario, with only a 10% probability, acknowledges the technical oversold condition but underscores the significant headwinds against a sustained upward move.
Risk management is paramount in this environment. Traders considering a bearish position should look for confirmation on a break of the $0.68310 support, potentially using the $0.68409 level as an initial risk-off point. Conversely, those looking for a bullish reversal would need to see a decisive hold above $0.68409, followed by a move above the $0.68720 resistance, ideally on increasing volume. The DXY at 100.25 remains a key correlated asset; any significant move in the dollar index will likely have a direct impact on AUDUSD. As we look towards Fed Chair Powell's testimony and potential geopolitical shifts, patience and strict adherence to risk management protocols will be crucial for navigating the volatility surrounding AUDUSD at these critical levels.
Frequently Asked Questions: AUDUSD Analysis
What happens if AUDUSD breaks below the $0.68310 support level?
A break below the daily support at $0.68310 would likely invalidate any short-term bullish hopes and confirm the continuation of the downtrend. This could trigger further selling pressure, with the next key targets around $0.68111 and potentially $0.67900.
Should I consider buying AUDUSD at current levels of $0.68496 given the oversold daily Stochastic?
While the daily Stochastic is deeply oversold (4.98/15.44), the dominant bearish trend (ADX 27.65) suggests caution. A low-probability bullish scenario might emerge if price holds $0.68409 with strong conviction, targeting resistance at $0.68720. However, the risk of further downside below $0.68310 remains significant.
Is the RSI at 36.16 on the daily chart a sell signal for AUDUSD?
An RSI reading of 36.16 on the daily timeframe indicates strong bearish momentum, but it is not yet in extreme oversold territory (typically below 30). It confirms the prevailing downtrend and suggests that further price declines are more probable than significant rallies in the absence of strong bullish catalysts.
How will Fed Chair Powell's upcoming testimony affect AUDUSD around the $0.68496 level?
Powell's testimony could be a major catalyst. A hawkish tone on inflation would likely strengthen the USD and push AUDUSD lower, potentially breaking support at $0.68310. Conversely, any dovish hints might offer temporary respite, allowing AUDUSD to test resistance levels around $0.68720.
Technical Outlook Summary
| Indicator | Value | Signal | Interpretation |
|---|---|---|---|
| RSI (14) | 36.16 | Bearish | Strong bearish momentum on Daily. |
| MACD Histogram | -0.00045 | Bearish | Negative momentum on Daily. |
| Stochastic | 4.98 / 15.44 | Bullish Reversal Signal | Deeply oversold on Daily, potential bounce. |
| ADX | 27.65 | Strong Downtrend | Confirms a solid downtrend on Daily. |
| Bollinger Bands | Middle Band Breach | Bearish | Price below middle band on Daily. |
Key Levels
Track markets in real-time
AI-powered analysis, technical indicators and real-time price data.
Join Our Telegram Channel
Breaking market news, AI analysis and trading signals instantly.
Join Channel