The Australian Dollar is currently finding itself in a precarious position, trading near the $0.69636 mark. This level, while seemingly stable, represents a critical juncture for AUDUSD as the market grapples with conflicting technical indicators and a lack of clear directional conviction. The proximity to the significant support level at $0.69218 is drawing considerable attention, with traders and analysts alike scrutinizing every tick for clues about the pair's next major move. This analysis delves into the intricate technical landscape, dissecting the signals across multiple timeframes to paint a comprehensive picture of the current trading environment.
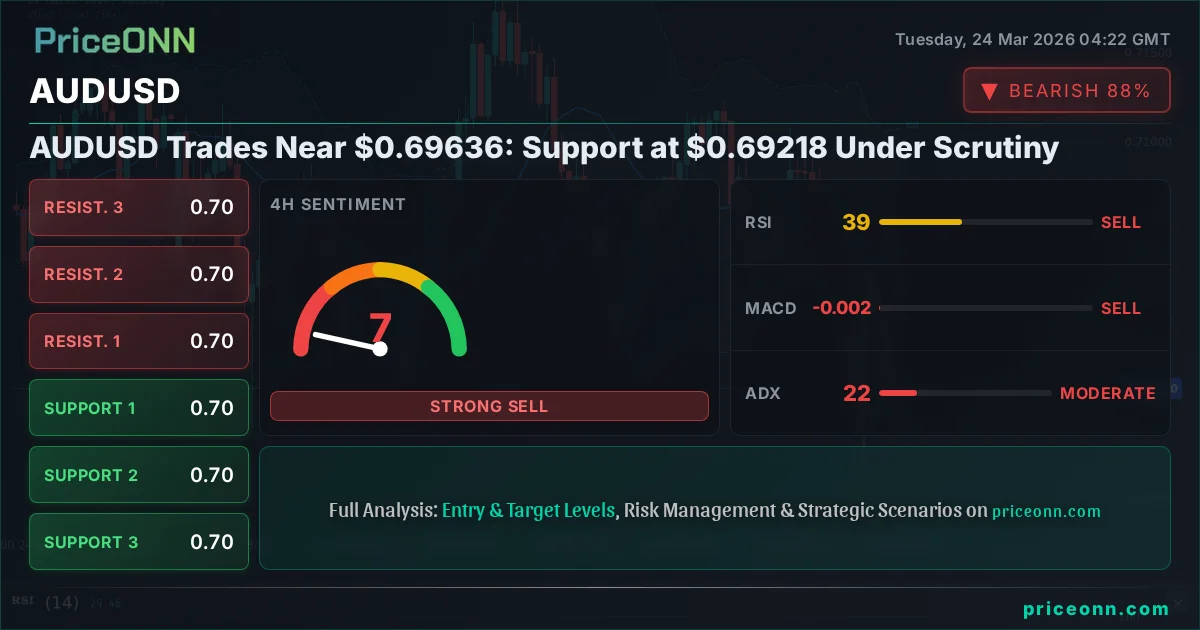
- AUDUSD hovers near $0.69636, with the 4-hour chart showing a neutral bias despite a strong 1D downtrend.
- Key support is located at $0.69218, a level that historically acts as a floor for the pair.
- RSI(14) readings are mixed: 40.74 (1H), 39.36 (4H), and 44.06 (1D), all indicating a lack of strong momentum but leaning towards bearish sentiment.
- The US Dollar Index (DXY) is showing strength, currently at 99.21, which typically exerts downward pressure on AUDUSD.
- Geopolitical tensions in the Middle East are adding a layer of uncertainty, potentially boosting safe-haven assets and impacting currency pairs like AUDUSD.
The Tightrope Walk at $0.69636: A Technical Snapshot
Navigating the 1-Hour Chart: Mixed Signals and Fading Momentum
On the 1-hour timeframe, AUDUSD presents a rather indecisive picture. The trend is officially neutral, with a 50% strength rating, reflecting the tug-of-war between the bulls and bears. The current price of $0.69636 is sandwiched between immediate support at $0.69608 and resistance at $0.69766. The RSI(14) hovers at 40.74, firmly in neutral territory but with a bearish inclination, suggesting that while there's no immediate oversold condition, upward momentum is not building. The MACD, while showing positive momentum, has its signal line above, a subtle hint of potential weakness. However, the Stochastic Oscillator paints a more concerning bearish signal, with %K at 5.17 and %D at 25.12, indicating a strong downward bias and potential for further declines. The ADX at 19.33 suggests a weak trend, meaning any move might lack conviction and could be prone to reversals. The overall signal on this timeframe leans towards a 'SELL', with 0 buys, 8 sells, and 0 neutral signals.
The 4-Hour Perspective: A Deeper Dive into Bearish Undercurrents
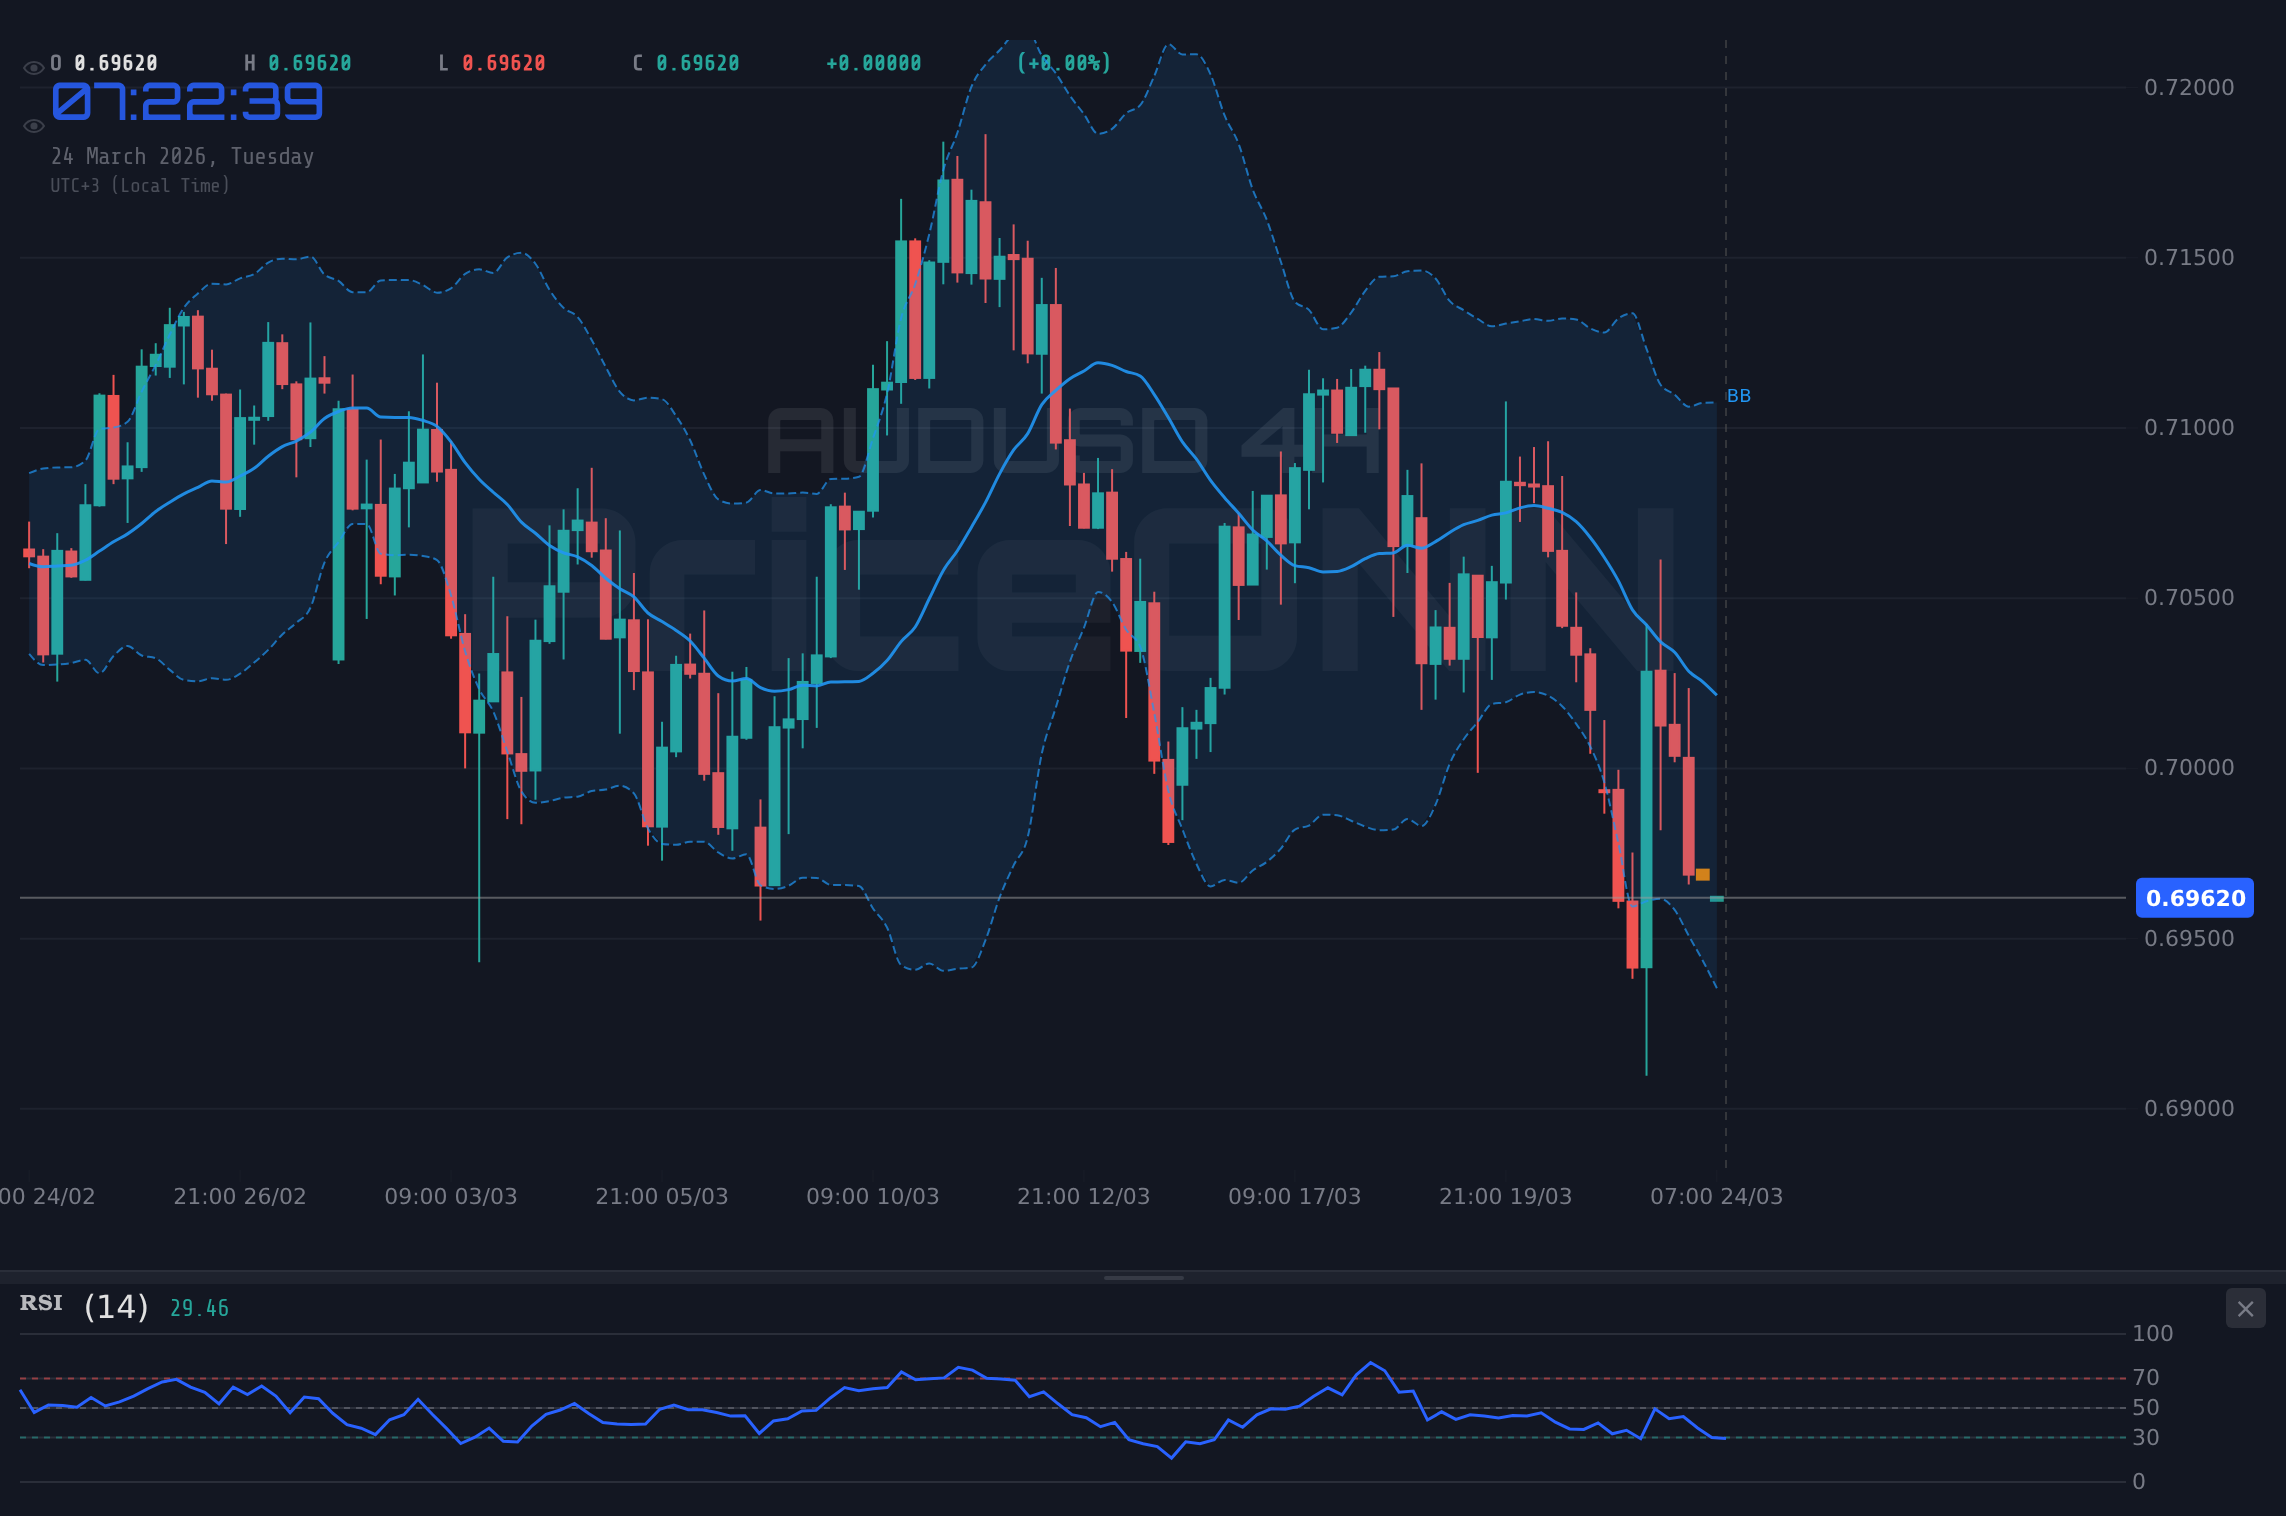
Shifting to the 4-hour chart, the bearish undercurrents become more pronounced. The trend is identified as bearish with a significant 96% strength. The current price of $0.69636 finds itself below the immediate resistance at $0.70205 and above support at $0.69943. The RSI(14) is at 39.36, still in neutral territory but reinforcing the bearish sentiment seen on the 1-hour chart. The MACD is below its signal line, confirming negative momentum. Bollinger Bands are showing the price below the middle band, indicating a bearish inclination. The Stochastic Oscillator, while showing a %K of 49.17 and %D of 30.07, suggests a potential for a bounce as %K is above %D, but the overall trend remains bearish. The ADX at 22.11 points to a moderate-strength downtrend. The aggregated signal on this timeframe is overwhelmingly 'SELL' (1 Buy, 7 Sell, 0 Neutral), reinforcing the idea that the path of least resistance for AUDUSD is currently downwards.
Daily Chart Analysis: The Long-Term Trend and Potential Reversal Zones
On the daily chart, AUDUSD is exhibiting a neutral trend with a 50% strength rating, a stark contrast to the shorter timeframes. This neutrality suggests that while the long-term direction might be uncertain, the immediate pressure is leaning bearish. The RSI(14) is at 44.06, again in neutral territory but leaning bearishly. The MACD is negative, and below its signal line, indicating bearish momentum. The Bollinger Bands are positioned below the middle band, signaling a bearish inclination, and potentially indicating oversold conditions or a breakdown. The Stochastic Oscillator, with K at 24.96 and D at 39.51, shows a bearish signal, but it's approaching oversold territory, hinting at a possible reversal or consolidation soon. The ADX at 21.67 indicates a moderate-strength downtrend. The overall signal on the daily chart is 'SELL' (1 Buy, 7 Sell, 0 Neutral), confirming the prevailing bearish sentiment, yet the presence of significant support levels at $0.69218, $0.68399, and $0.67701 offers potential respite for the Aussie.
Key Levels and Price Action: Where the Battle Lines Are Drawn
The current price of $0.69636 places AUDUSD precariously close to its first significant daily support level at $0.69218. This level has historically acted as a crucial psychological and technical floor for the pair. A decisive break below $0.69218 would likely trigger further selling pressure, potentially targeting the subsequent support at $0.68399. This would confirm the bearish signals observed across the shorter timeframes and suggest a deeper retracement. On the upside, resistance is encountered first at $0.69766 on the hourly chart, followed by the daily resistance at $0.70735. A sustained move above $0.70735 would be necessary to challenge the prevailing bearish narrative and suggest a potential trend reversal. The interplay between these support and resistance levels will dictate the short-to-medium term trajectory of AUDUSD.
The Dollar's Shadow: DXY's Influence on AUDUSD
The US Dollar Index (DXY) is currently trading at 99.21, showing a strengthening trend on the daily chart with 91% strength. This upward momentum in the dollar typically exerts downward pressure on currency pairs like AUDUSD, especially given the inverse correlation often observed. With the DXY at 99.21, the dollar's strength provides a headwind for the Australian dollar. Traders are watching the DXY closely; a continued push towards the 100.34 resistance level would likely exacerbate the bearish pressure on AUDUSD, potentially accelerating a move towards the lower support levels. Conversely, any sign of weakness in the DXY, perhaps a retreat towards its daily support at 98.24, could offer some relief to the Aussie.
Geopolitical Ripples and Their Impact on AUDUSD
The current geopolitical climate, particularly the heightened tensions in the Middle East, cannot be ignored when assessing AUDUSD. While the immediate impact on the Australian dollar might be indirect, these global events often influence risk appetite across financial markets. Escalating conflicts tend to boost demand for safe-haven assets, which can sometimes include currencies like the US Dollar or Japanese Yen, indirectly weakening risk-sensitive currencies such as the Australian Dollar. News regarding crude oil prices, for instance, can have ripple effects. Brent crude is trading at $104.38, showing a strong upward trend on the daily chart, while WTI is at $92.34 with a very strong daily uptrend. Higher energy prices can fuel inflation concerns globally, potentially leading to tighter monetary policy expectations from central banks, which in turn affects currency valuations. While the direct link to AUDUSD might not be immediately obvious, the general risk sentiment driven by these geopolitical events is a crucial backdrop for currency trading.
The Market's Verdict: Indicator Dashboard Signals
The aggregated signals from various timeframes paint a predominantly bearish picture for AUDUSD, though with nuances that suggest potential for consolidation or short-term bounces. On the 1-hour chart, the sentiment is strongly 'SELL' (0 Buys, 8 Sells). The 4-hour chart echoes this with a decisive 'SELL' signal (2 Buys, 6 Sells), emphasizing the current downtrend. The daily chart, while showing a neutral trend, still leans bearish with a 'SELL' leaning (3 Buys, 5 Sells). This consistent bearish pressure, especially on the shorter timeframes, highlights the immediate risk of further downside. However, the approaching oversold conditions on the daily Stochastic Oscillator and the psychological significance of the $0.69218 support level suggest that a bounce or period of consolidation is not entirely out of the question.
Trading Scenarios: Mapping the Path Forward
Given the current technical landscape, several scenarios could unfold for AUDUSD. The prevailing bearish sentiment suggests that downside risks are elevated, but the confluence of support levels and mixed signals on longer timeframes warrants a cautious approach. The probabilities assigned reflect the current data; however, market dynamics can shift rapidly, especially with ongoing geopolitical events and economic data releases on the horizon.
Bearish Continuation: Testing the Lower Supports
65% ProbabilityConsolidation Around Key Levels
25% ProbabilityAussie Rebound: Challenging Resistance
10% ProbabilityFrequently Asked Questions: AUDUSD Analysis
What happens if AUDUSD breaks below the $0.69218 support level?
A confirmed break below $0.69218 on the daily chart would invalidate the current neutral stance and likely accelerate the bearish trend. This would open the door for a move towards the next support at $0.68399, confirming the downtrend signaled by shorter timeframes.
Is the current RSI reading of 44.06 a sell signal for AUDUSD?
While RSI at 44.06 is in neutral territory, its position below 50 and leaning bearishly, especially when viewed alongside other bearish indicators like the MACD and Stochastic on shorter timeframes, contributes to the overall negative sentiment. It suggests momentum is not in favor of buyers.
How will the strong DXY at 99.21 affect AUDUSD trading this week?
The strengthening US Dollar Index (DXY) at 99.21 generally exerts downward pressure on AUDUSD due to the inverse correlation. Continued dollar strength towards the 100.34 resistance could push AUDUSD towards its key support levels, making any bullish attempts more challenging.
Should traders consider buying AUDUSD at current levels near $0.69636?
Buying at $0.69636 is a high-risk proposition given the bearish signals on shorter timeframes and the proximity to key support. A more prudent approach would be to wait for confirmation, such as a hold above $0.69766 or a clear bounce from $0.69218, before considering long positions.
Track markets in real-time
AI-powered analysis, technical indicators and real-time price data.
Join Our Telegram Channel
Breaking market news, AI analysis and trading signals instantly.
Join Channel