The price of Brent crude oil stands at a critical juncture, currently trading at $112.79. This level comes after a significant upswing, driven by a confluence of escalating geopolitical tensions in the Middle East and robust demand signals. As traders and analysts assess the trajectory for the coming week, the market is keenly focused on whether this bullish momentum can overcome key resistance levels or if profit-taking will set in. This analysis delves into the intricate market dynamics, cross-market correlations, and the critical technical levels that will dictate Brent's path forward.
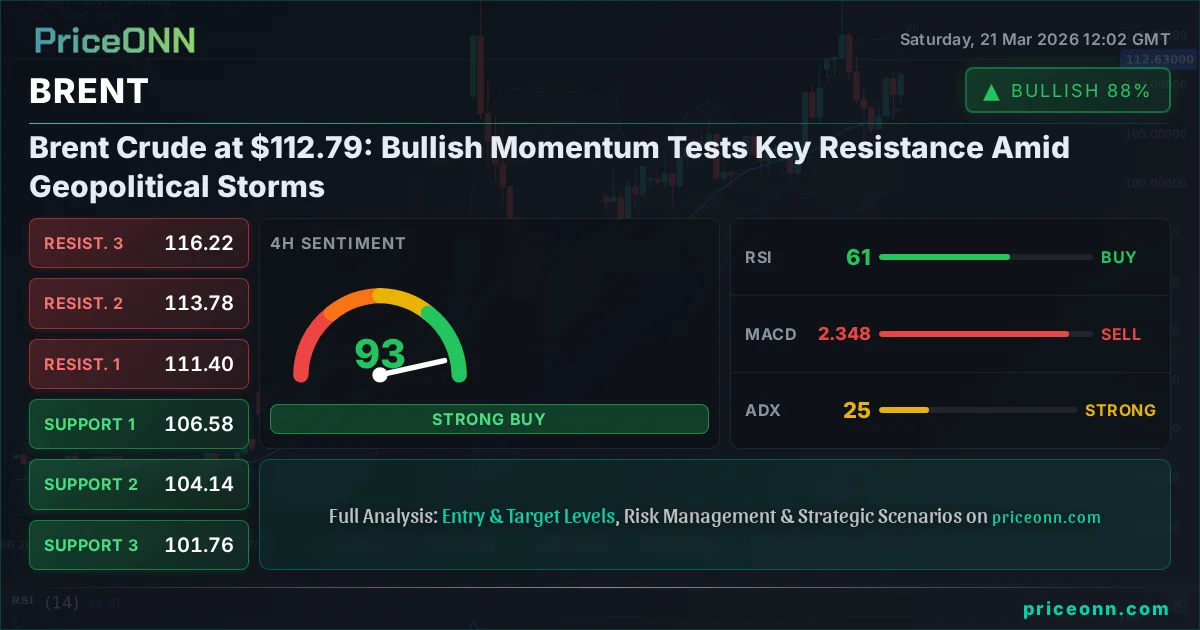
- Brent crude is trading at $112.79, showing strong bullish momentum with an ADX of 25.01 indicating a powerful trend.
- Key support sits at $111.06, while resistance is eyed at $114.02, a level that has historically capped rallies.
- The RSI at 62.15 signals a strong uptrend but is approaching overbought territory, suggesting caution is warranted for new entries.
- Geopolitical escalations in the Middle East are a primary driver, correlating with rising WTI prices and a widening Brent-WTI spread.
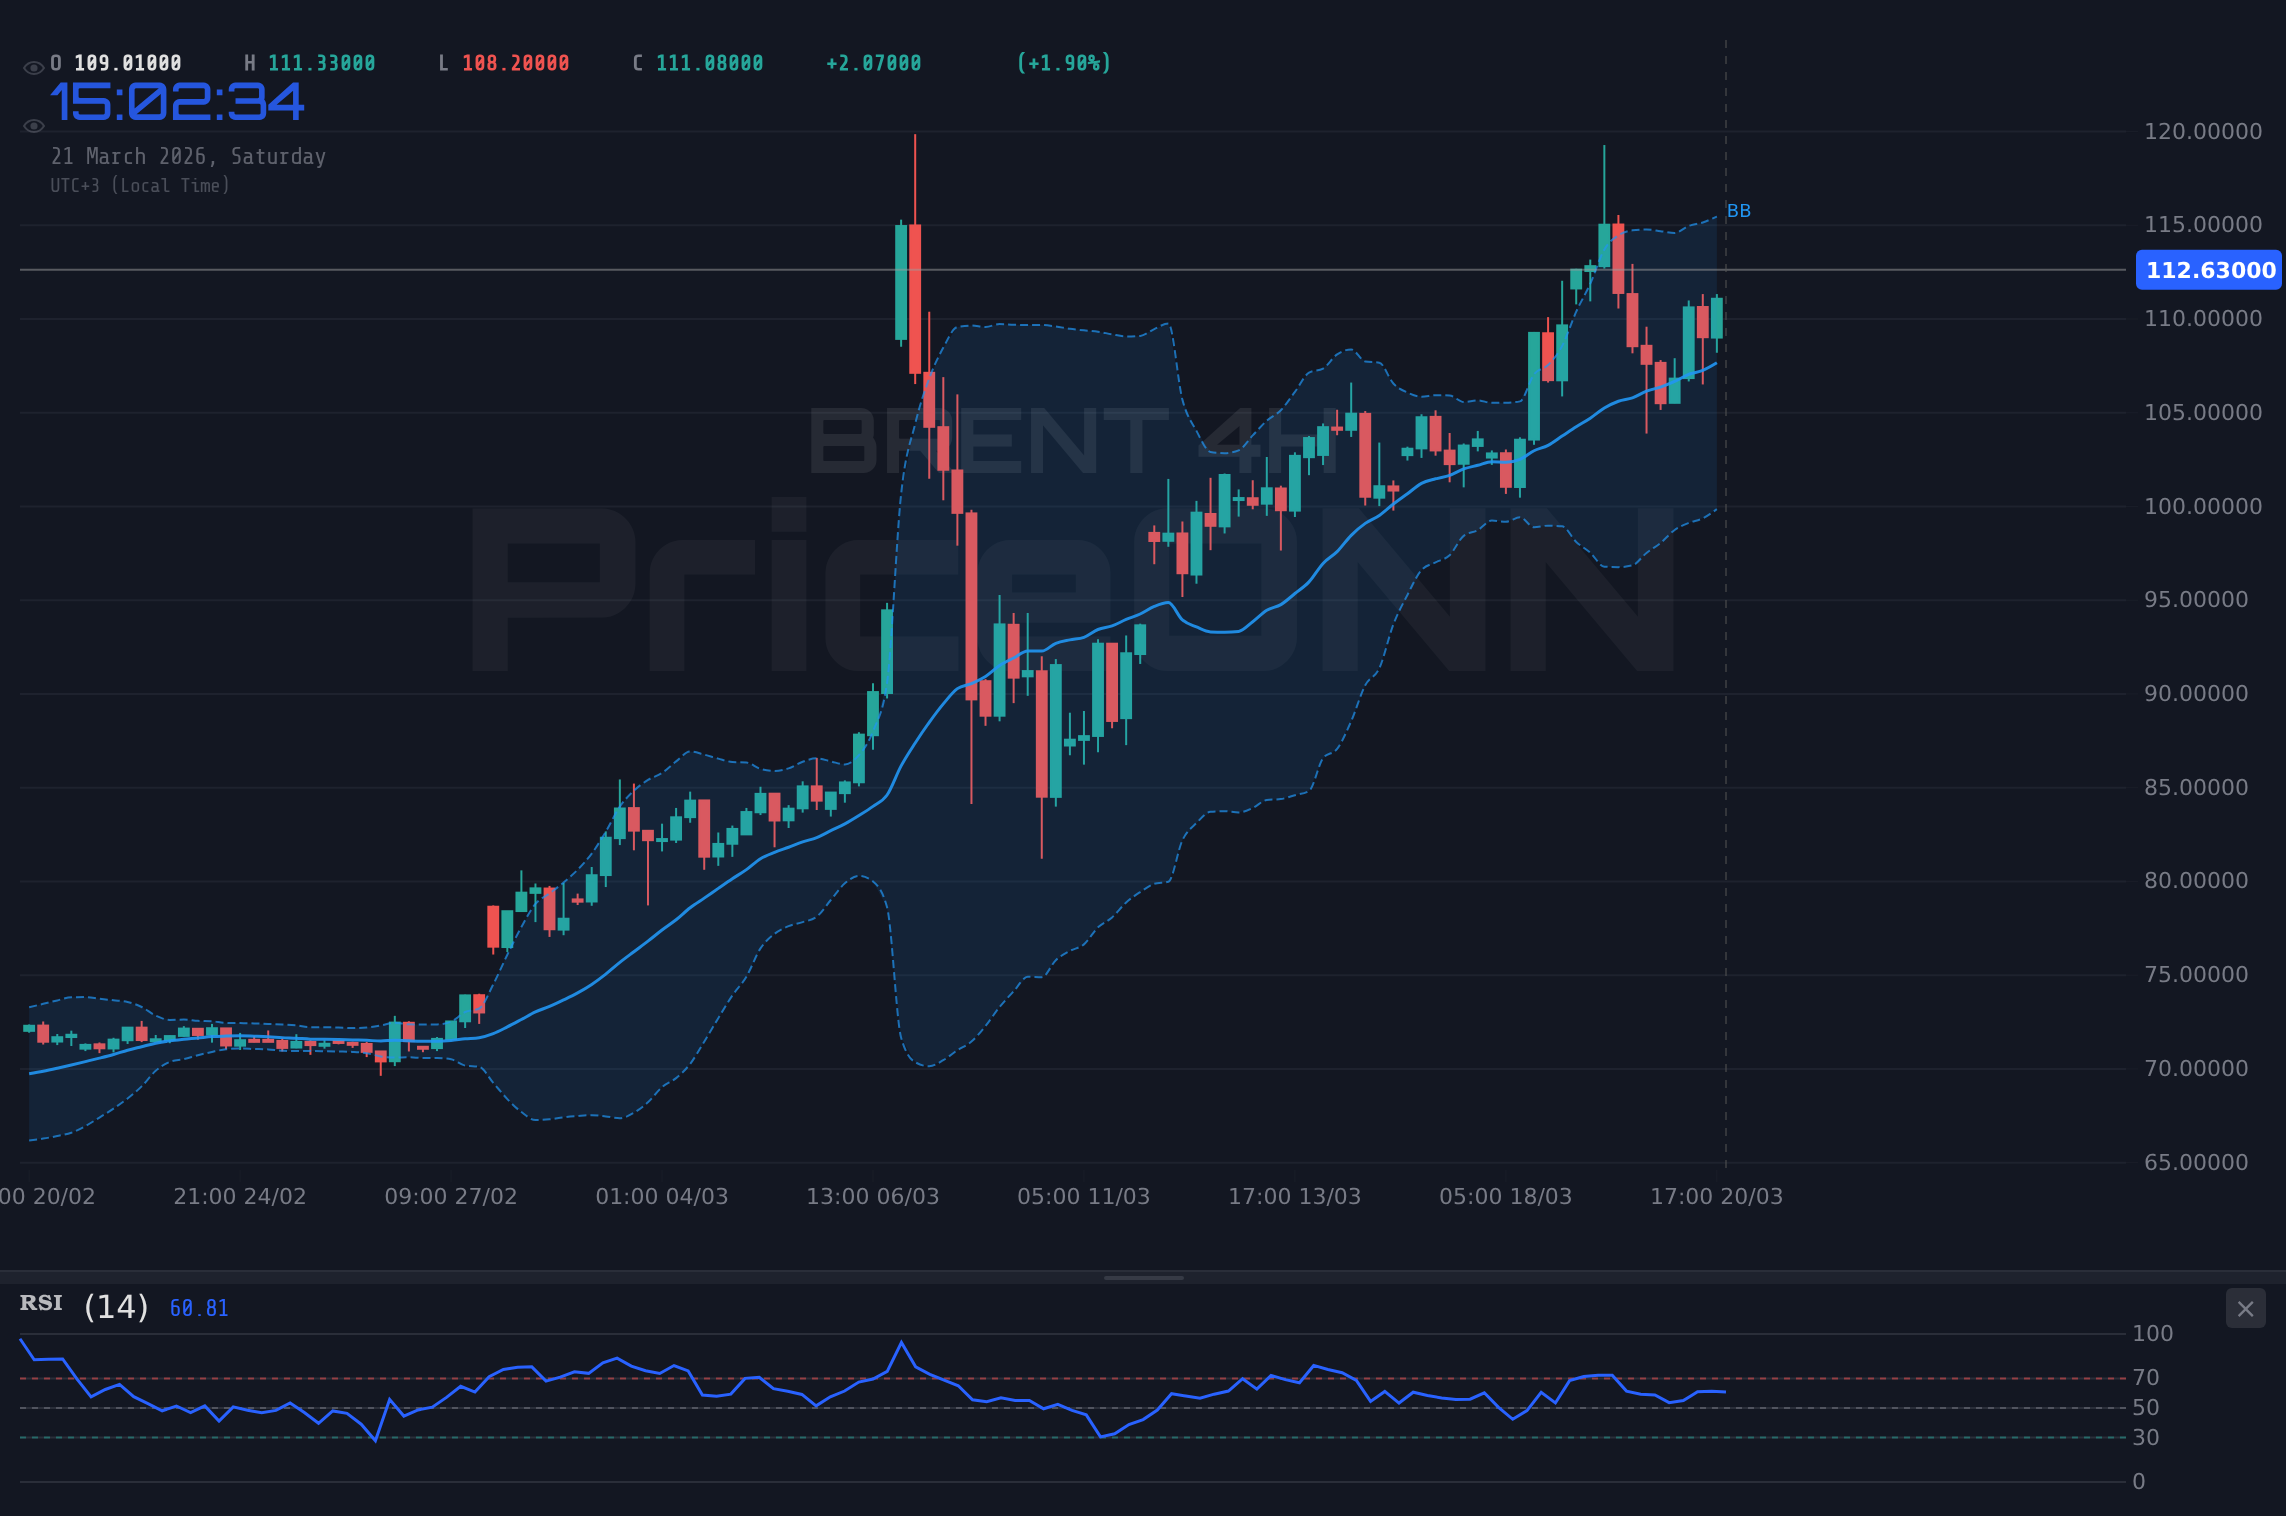
Last week presented a dramatic narrative for crude oil markets, with Brent crude oil notably surging to its current position around $112.79. This upward trajectory was largely fueled by renewed concerns over supply disruptions stemming from the Middle East. As tensions flared, traders reacted swiftly, pushing prices higher in a classic risk-on sentiment for energy commodities. The daily change saw Brent fluctuate between $105.15 and $113.22, ultimately closing with a significant daily gain of 4.81%. This sharp move underscores the market's sensitivity to geopolitical events, a factor that has consistently played a pivotal role in oil price volatility.
The strength of the current uptrend is evident across multiple timeframes. On the 1-hour chart, the ADX is reading 17.96, suggesting a nascent but strengthening trend. However, the 4-hour chart shows a more robust ADX of 25.01, confirming a solid trend in play. The daily chart's ADX at 65.23 indicates a very strong upward trend, painting a picture of sustained bullish pressure. This consistent trend strength across different timeframes suggests that the current move is not merely a short-term blip but a more significant market shift. The RSI on the daily chart is at 82.55, firmly in overbought territory, which historically suggests potential for a pullback or consolidation, even within a strong trend.
The Bullish Scenario: Charting a Path Above Resistance
The 'Bull Scenario' for Brent crude hinges on sustained geopolitical risk premiums and continued strong demand, pushing the price decisively above current resistance. The immediate hurdle lies at the 1-hour resistance level of $114.02. A clean break and sustained hold above this level would signal further upside potential. This scenario is supported by the strong bullish signals observed on shorter timeframes, with the 1-hour Stochastic K and D lines both above 89, indicating strong upward momentum, albeit in extreme overbought territory. If price can consolidate above $114.02, the next logical target would be the 4-hour resistance at $116.22, potentially extending towards the daily resistance of $125.65 if supply fears intensify significantly.
The underlying catalysts for this bullish outlook are multifaceted. Firstly, ongoing conflicts and tensions in the Middle East continue to cast a shadow over global oil supply, particularly concerning potential disruptions to major shipping routes and production facilities. News reports from March 21st, such as those from Reuters and Bloomberg, highlight renewed attacks in the Persian Gulf, directly impacting crude oil prices and pushing WTI towards $97.82 while Brent climbs. This geopolitical risk premium is a key driver that could keep prices elevated. Secondly, despite global economic uncertainties, demand for oil remains surprisingly resilient, particularly from key consuming nations. The fact that WTI prices have lagged Brent, widening the spread, suggests that specific supply concerns related to the Middle East are a more dominant factor for Brent currently.
From a technical perspective, confirmation of this bullish scenario would involve price holding above the 1-hour support at $111.06 after breaking resistance. The MACD on the daily chart remains positive, indicating underlying bullish momentum. While the daily RSI at 82.55 is a flashing warning sign for immediate new entries, it doesn't necessarily negate the possibility of further upside in a strong trend; rather, it suggests that any pullback might be a buying opportunity for those with a longer-term view. The strong ADX readings across all timeframes reinforce the idea that the trend, once established, has the power to extend.
The Bearish Scenario: When Risk Aversion Takes Hold
Conversely, the bearish scenario for Brent crude at $112.79 would be triggered by a significant de-escalation of geopolitical tensions in the Middle East or a sharp downturn in global risk appetite. If the immediate supply fears subside, the premium priced into Brent could evaporate rapidly. The key level to watch for a bearish confirmation is the break below the 1-hour support of $111.06. A decisive close below this level on the 1-hour chart would likely open the door for a test of the next support at $109.18. Should broader market sentiment turn risk-off, exemplified by a significant drop in indices like the S&P 500 (currently at 6536.05, down 1.21%), this could accelerate selling pressure on oil.
The technical indicators provide a mixed bag but lean towards caution for the immediate future, especially given the extreme readings. The daily RSI at 82.55 is a primary concern, suggesting that the market is significantly overbought and ripe for a correction. While strong trends can persist in overbought territory, corrections are often sharp when they occur. The Stochastic on the 1-hour chart, though showing %K above %D, is in extreme overbought conditions (K=94.74, D=72.65), indicating a potential reversal is imminent. Furthermore, the widening Brent-WTI spread, while currently favoring Brent due to specific supply risks, could narrow if broader economic concerns begin to dominate, leading to a sell-off in the more sensitive Brent contract.
A key piece of news that could fuel this bearish scenario would be a diplomatic breakthrough in the Middle East, or official statements from major central banks signaling a more aggressive stance on inflation, potentially dampening global growth and oil demand. The fact that the DXY (Dollar Index) is currently at 99.39 and showing signs of strength could also weigh on oil prices, as a stronger dollar typically makes dollar-denominated commodities like oil more expensive for holders of other currencies. The breakdown below $111.06 would be the first major sign that the bullish narrative is faltering, potentially leading to a rapid unwinding of long positions and a swift move towards the $108.10 support level.
The Waiting Game: Consolidation Around $112.79
The neutral or consolidation scenario posits that Brent crude will struggle to make significant directional moves in the near term, trading within a defined range around the current price of $112.79. This scenario typically plays out when conflicting market forces balance each other, or when participants await a clearer catalyst. In this case, the bullish drivers (geopolitical risk, resilient demand) are being counterbalanced by technical overbought conditions and potential demand concerns stemming from a strengthening dollar and global economic uncertainties.
Technically, consolidation would likely see price action confined between the 1-hour support at $111.06 and the 1-hour resistance at $114.02. The ADX readings, particularly the weaker ones on the 1-hour (17.96) and 4-hour (25.01) charts when viewed in isolation from the daily's very strong 65.23, could support a period of range-bound trading before the next major move. During such a phase, volatility might decrease, and price could oscillate within this band as market participants digest recent gains and assess upcoming economic data or geopolitical developments. The MACD, while positive, might hover near its signal line, indicating a lack of strong directional momentum.
Key events that could prolong or break this consolidation include upcoming economic data releases, particularly inflation reports and central bank commentary, which could influence risk sentiment and dollar strength. If no major new geopolitical escalations occur, the market might use this period to reassess the sustainability of current oil prices given the lofty RSI levels. A break below $111.06 would favor the bearish view, while a decisive push above $114.02 would reignite the bullish trend. Until then, traders might adopt a range-trading strategy, looking to buy near the lower bound and sell near the upper bound, with tight stops to manage risk.
Market Correlations and Intermarket Dynamics
Understanding Brent's price action requires a keen eye on its relationship with other key markets. The Dollar Index (DXY) is currently at 99.39 and showing signs of upward momentum, which typically exerts downward pressure on dollar-denominated commodities like oil. A stronger dollar makes oil more expensive for holders of other currencies, potentially dampening demand. However, in the current environment, geopolitical risk seems to be temporarily overriding this inverse correlation, as both the dollar and oil are seeing some strength, albeit for different reasons. The escalating Middle East tensions are driving safe-haven demand for both assets to some extent.
Equities, represented by the S&P 500 at 6536.05 and Nasdaq at 23992.13, are showing weakness, down 1.21% and 1.65% respectively. This indicates a decline in overall risk appetite. Typically, a risk-off environment would lead to lower oil prices as demand expectations diminish. However, the specific supply-side risks in the oil market are currently powerful enough to counteract this broader trend. The fact that oil prices are rising while stocks are falling highlights the unique supply-driven nature of the current oil market rally.
The relationship between Brent and WTI (West Texas Intermediate) is also crucial. Currently, WTI is trading around $98.50, meaning the spread between Brent and WTI has widened significantly. This divergence is often attributed to specific regional supply concerns. The news on March 19th and 20th highlighted this, with Brent surging past $114 while WTI lagged, driven by risks impacting Middle Eastern crude flows. This widening spread is a direct consequence of the geopolitical situation and suggests that the supply disruption fears are more acutely impacting the global Brent benchmark.
The Week Ahead: Key Events and Levels to Watch
Looking ahead, the trajectory of Brent crude at $112.79 will be heavily influenced by geopolitical developments and key economic data. The primary focus will remain on the Middle East; any further escalation or de-escalation will have an immediate impact on prices. Traders will also be closely monitoring central bank communications, particularly from the Federal Reserve, as their stance on interest rates and inflation can significantly affect the DXY and overall market risk sentiment. The Fed's actions, or inaction, will be critical in determining if the dollar's strength continues or reverses, impacting oil's correlation.
From a technical standpoint, the levels of $111.06 (support) and $114.02 (resistance) on the 1-hour chart are paramount. A decisive break above $114.02 could signal a continuation of the bullish trend towards $116.22 and potentially higher, contingent on sustained geopolitical risk. Conversely, a break below $111.06, especially if accompanied by a broader market sell-off or positive news from the Middle East, could trigger a sharper correction towards $109.18 and $108.10. The daily RSI at 82.55 remains a significant cautionary flag, suggesting that the market is overheated and vulnerable to a pullback, regardless of the underlying trend strength.
The ADX across all timeframes confirms a strong trend is in place, particularly on the daily chart (65.23). This suggests that while pullbacks are possible, the path of least resistance is currently to the upside. However, extreme RSI readings necessitate vigilance. Traders should be looking for confirmations: a close above resistance for bullish continuation, or a break of support coupled with negative sentiment shifts for bearish confirmation. The sustainability of Brent's rally will depend on whether the geopolitical risk premium continues to expand or begins to recede, balanced against global demand dynamics and the strength of the US dollar.
Scenario Analysis: Mapping Potential Price Paths
Bearish Scenario: Risk Aversion and De-escalation
35% ProbabilityNeutral Scenario: Consolidation and Observation
30% ProbabilityBullish Scenario: Geopolitical Premium Sustained
35% ProbabilityThe current market setup presents a compelling, albeit volatile, picture for Brent crude. The potent combination of geopolitical risk and underlying demand strength has propelled prices higher, but the extreme technical readings, particularly the daily RSI at 82.55, suggest that the market is stretched. The most probable outcome in the short term appears to be a continuation of the bullish trend, provided geopolitical tensions remain elevated and no significant de-escalation occurs. However, the potential for a sharp correction cannot be ignored, making risk management paramount.
The probability split reflects this tension: a 35% chance for continued bullish momentum, a 35% chance for a bearish reversal or significant pullback driven by de-escalation or risk-off sentiment, and a 30% chance for consolidation as the market digests the current situation. The critical levels to watch remain $111.06 for support and $114.02 for resistance on the 1-hour chart. A break of either will likely dictate the market's direction for the immediate future.
What I'm Watching This Week
For the upcoming week, my focus will be on three key triggers that could significantly impact Brent crude's price action around the $112.79 mark:
- Geopolitical Developments: Any news or statements indicating a de-escalation or, conversely, further escalation of conflicts in the Middle East will be the primary driver. A diplomatic breakthrough could see prices fall sharply, while new attacks could push them higher.
- Break of Key Levels: A decisive 4-hour candle close above $114.02 resistance would signal bullish continuation. Conversely, a close below $111.06 support would likely initiate a bearish move.
- DXY and Equities Movement: Monitoring the Dollar Index (currently 99.39 and rising) and major equity indices like the S&P 500 (at 6536.05, falling) will provide crucial context on overall market risk sentiment. A strengthening dollar or a significant equity sell-off could pressure oil prices, even amidst supply concerns.
The high ADX values across timeframes suggest that when a move does occur, it's likely to be strong. Therefore, waiting for clear confirmation at these key levels is crucial. Patience in this market, especially with the extreme RSI readings, will be key to identifying favorable risk/reward setups. The interplay between supply-side geopolitical risks and broader economic demand factors will continue to shape the narrative for Brent crude.
📊 Indicator Dashboard
| Indicator | Value | Signal | Interpretation |
|---|---|---|---|
| RSI (14) | 82.55 | Bearish | Overbought territory on daily; suggests potential for pullback. |
| MACD Histogram | +1.85 | Bullish | Positive momentum indicates upward trend continuation. |
| Stochastic | K:94.74, D:72.65 | Bearish | Extreme overbought conditions on 1H chart; reversal likely. |
| ADX | 65.23 | Bullish | Very strong uptrend confirmed on daily chart. |
| Bollinger | Upper Band | Bullish | Price trading above upper band, indicating strong upward momentum. |
Key Levels
Frequently Asked Questions: BRENT Analysis
What happens if BRENT breaks decisively above $114.02 resistance at current levels?
A sustained break above $114.02, supported by ongoing geopolitical tensions, would likely trigger a bullish continuation. The next target would be the 4-hour resistance at $116.22, with potential for further upside towards $125.65 if supply fears intensify.
Should I consider selling BRENT at current levels of $112.79 given the extremely high daily RSI of 82.55?
While the daily RSI at 82.55 suggests overbought conditions and potential for a pullback, the strong trend indicated by the ADX (65.23) suggests caution against shorting solely based on RSI. A confirmed break below the 1-hour support at $111.06 would be a more reliable sell signal.
Is the current ADX of 65.23 on the daily chart a reliable indicator for a strong trend in BRENT?
Yes, an ADX reading of 65.23 signifies a very strong trend, indicating significant momentum behind the current price move. While it suggests the trend is likely to continue, it also implies that the market is extended and vulnerable to sharp corrections if momentum shifts.
How will the strengthening DXY at 99.39 affect BRENT crude prices this week?
A strengthening DXY typically puts downward pressure on dollar-denominated commodities like Brent crude. However, current geopolitical risks are creating a complex correlation. While the DXY's rise could cap oil gains, the immediate supply concerns are currently overriding this effect, though a sustained dollar rally could eventually weigh on oil prices.
Track markets in real-time
AI-powered analysis, technical indicators and real-time price data.
Join Our Telegram Channel
Breaking market news, AI analysis and trading signals instantly.
Join Channel