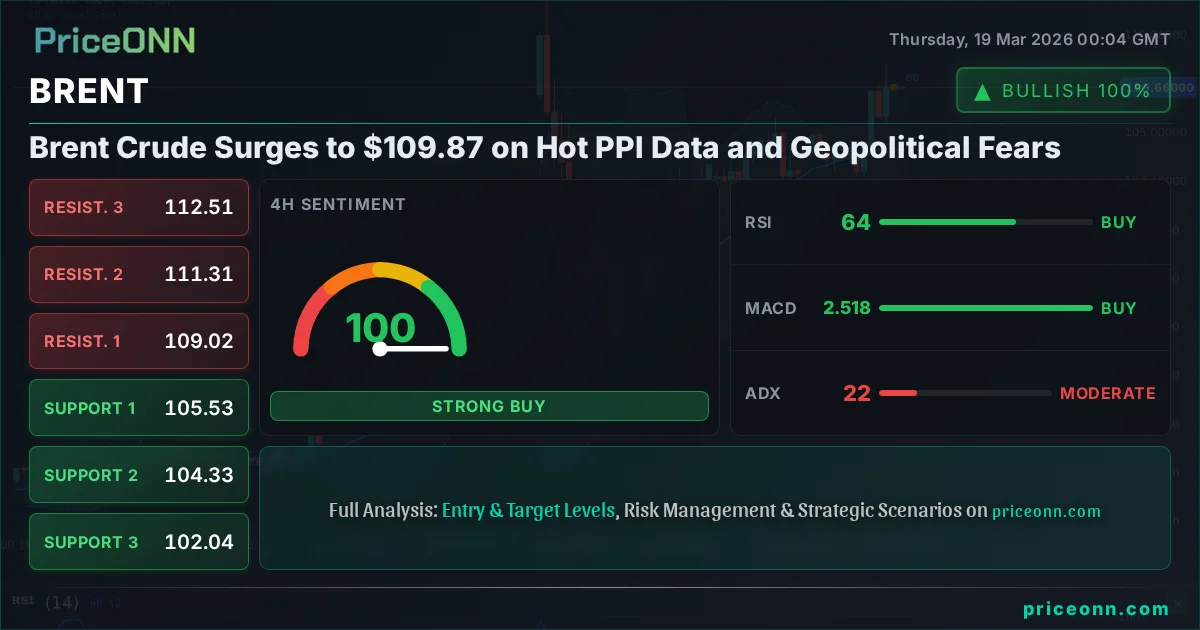
Brent crude oil prices have surged dramatically, breaching the $109.87 mark amidst a confluence of potent market forces. Yesterday's US Producer Price Index (PPI) data landed significantly hotter than anticipated, sparking fresh inflation worries and rattling market sentiment just ahead of a crucial Federal Reserve policy announcement. Simultaneously, escalating geopolitical tensions in the Middle East, particularly reports of an attack on Iran's energy infrastructure, have injected a potent risk premium into oil markets, driving prices higher. This dual pressure from both fundamental economic data and heightened geopolitical risk paints a complex picture for energy traders navigating these choppy waters.
- US PPI surged to 0.8% month-over-month, significantly exceeding the 0.3% forecast, indicating persistent inflationary pressures.
- Brent crude is trading at $109.87, with key resistance at $113.18 and support holding at $108.28 on the 1-hour chart.
- Geopolitical fears, including reports of an attack on Iran's South Pars gas field, are adding a significant risk premium to oil prices.
- The Federal Reserve's upcoming policy decision is a critical wildcard, with market participants closely watching for signals on interest rate trajectory amid sticky inflation.
The dramatic ascent of Brent crude past $109.87 is a clear signal that the market is pricing in a renewed inflationary impulse, driven by both supply-side shocks and robust demand indicators. The US PPI data, often seen as a precursor to consumer inflation, jumped by 0.8% month-over-month, far surpassing the consensus forecast of 0.3%. This sharp increase suggests that producers are facing higher costs, which are likely to be passed on to consumers. In an environment where central banks are already grappling with elevated inflation, such a reading injects a significant dose of uncertainty into the economic outlook. For oil markets, this translates directly into a higher perceived inflation hedge value for crude, bolstering demand from investors seeking to protect their capital against rising prices. The implications are far-reaching, potentially influencing central bank policy decisions and further tightening financial conditions globally.
Adding fuel to the fire are the intensifying geopolitical risks, particularly in the Middle East. Reports of an attack on Iran's South Pars gas field, coupled with broader regional instability, have sent shockwaves through energy markets. While the immediate impact on global supply is still being assessed, the mere threat of disruption to major oil and gas producing regions is enough to trigger a significant risk premium. History has shown that geopolitical flare-ups in this critical energy hub can lead to swift and substantial price spikes, as supply chains become vulnerable. The market's reaction underscores the delicate balance of global energy security, where even the *perception* of supply disruption can lead to sharp price movements. This adds a layer of volatility that is difficult to quantify but undeniably influential on price action.
Navigating the Technical Landscape: A Tale of Two Timelines
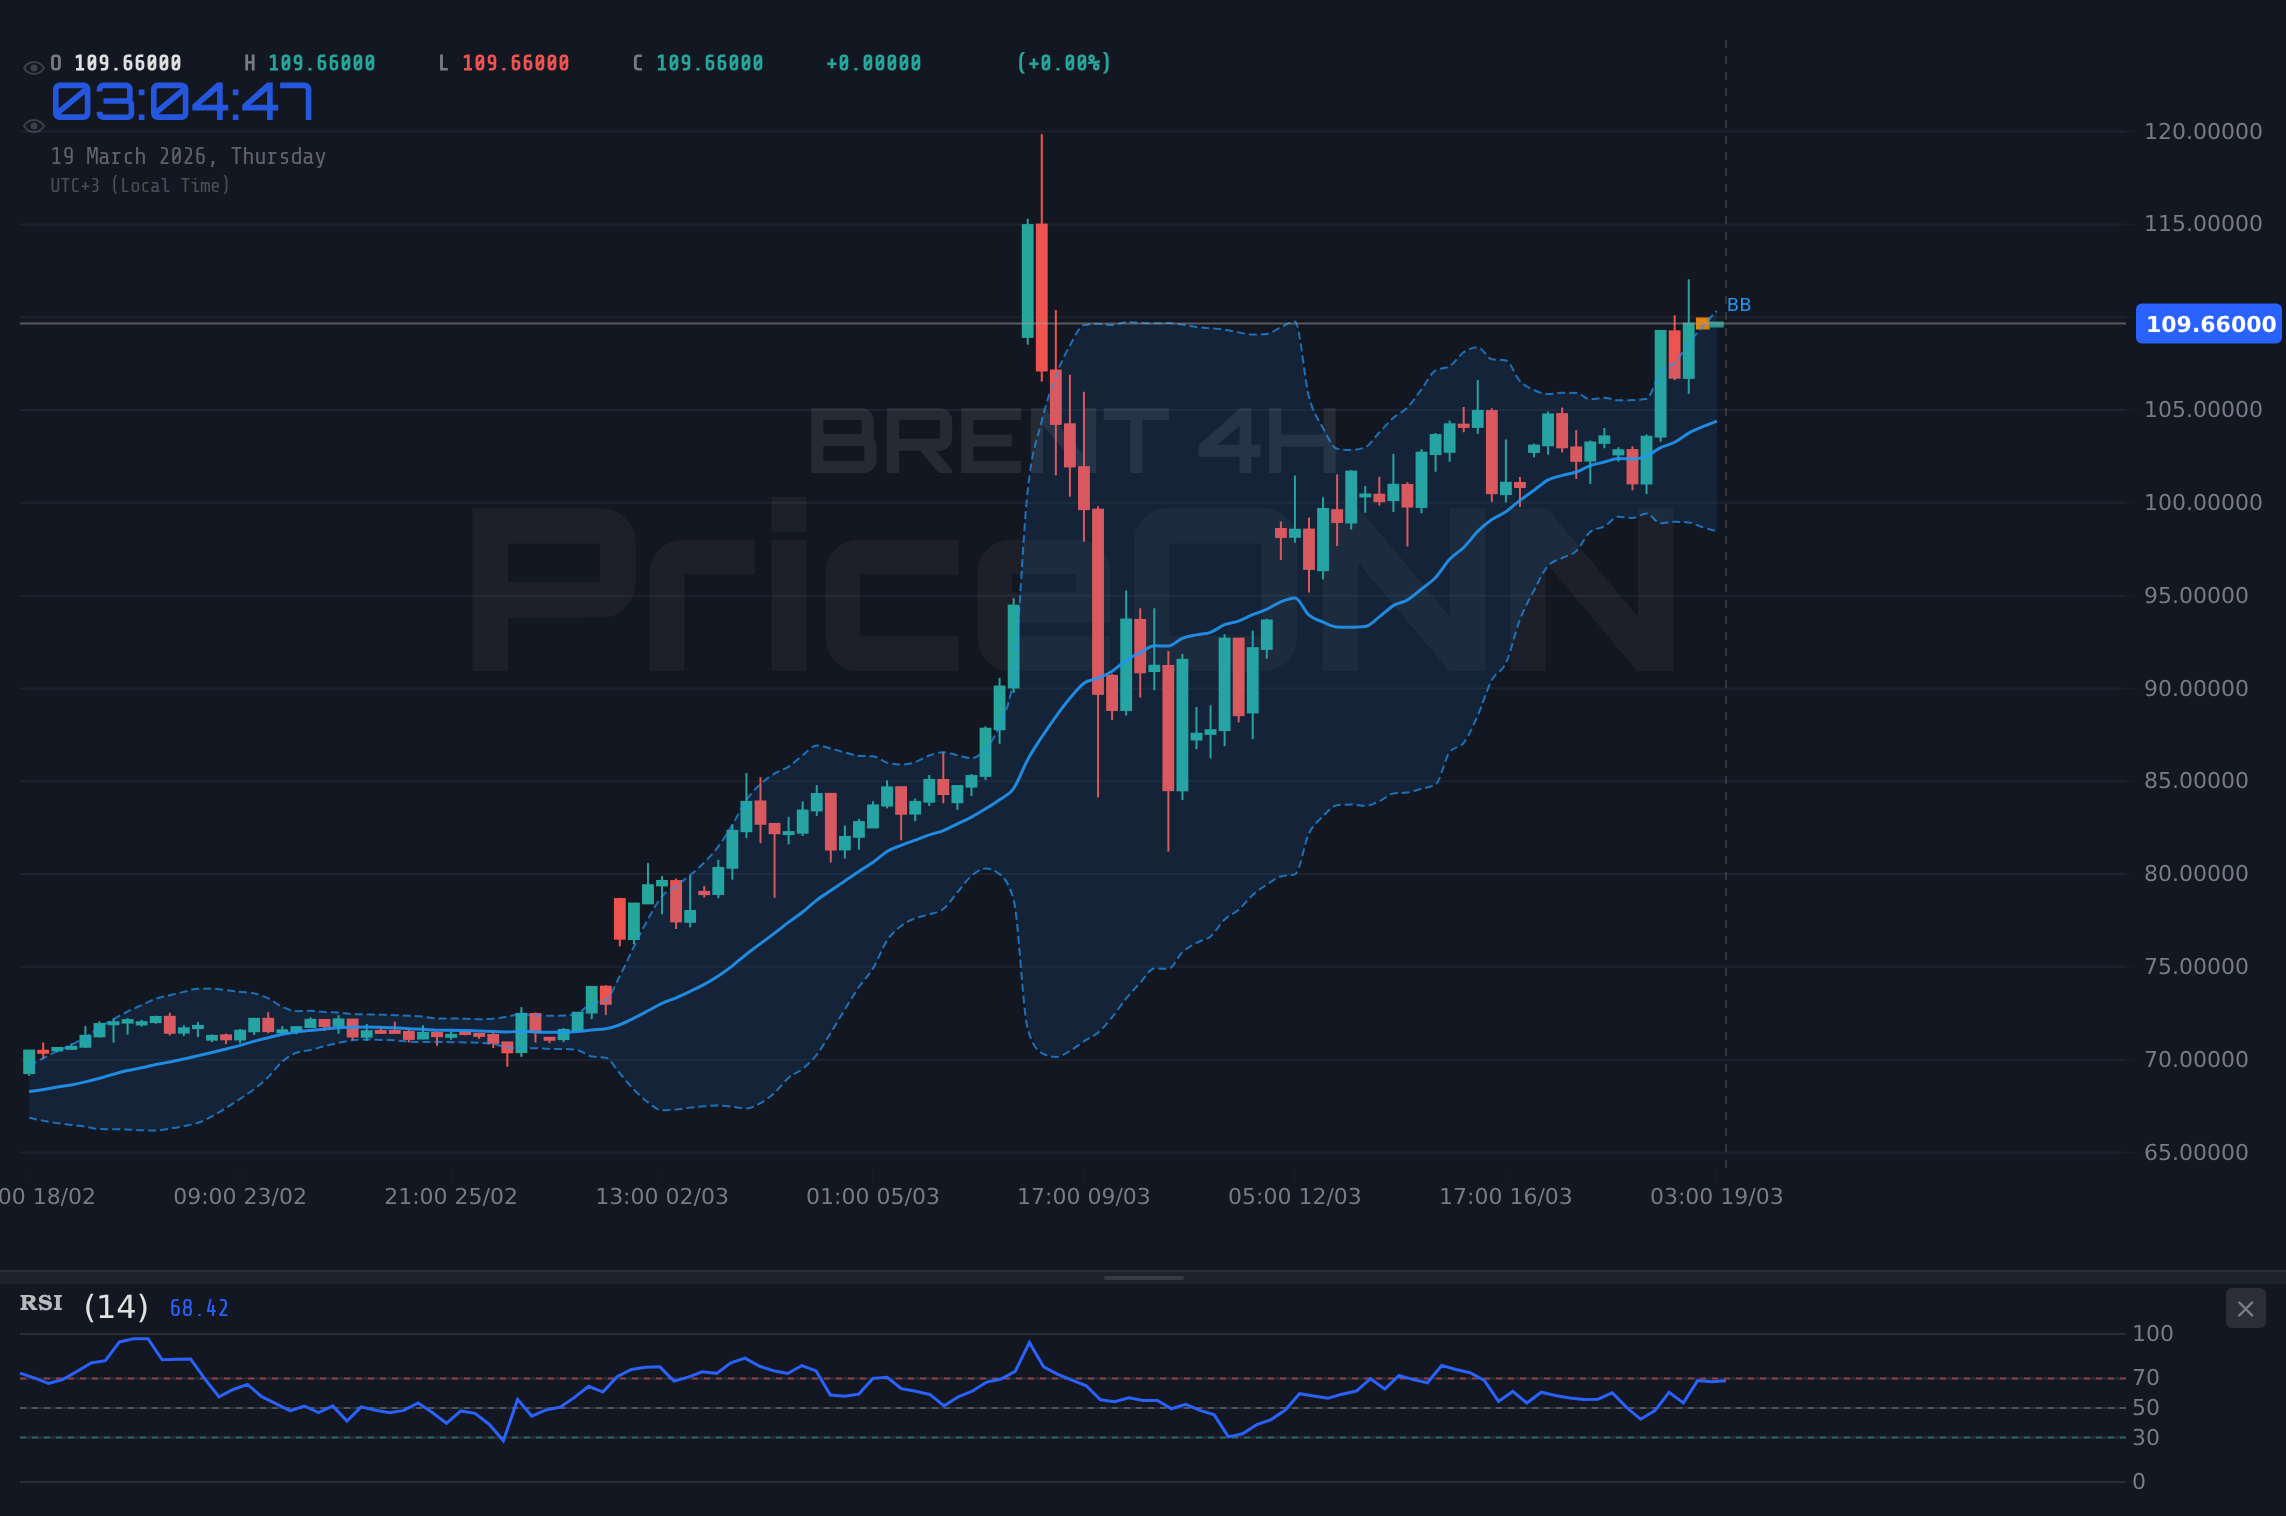
Examining Brent crude through a technical lens reveals a market in a strong bullish trend on the daily timeframe, yet showing signs of potential consolidation or a short-term pullback on shorter frames. The daily chart presents a powerful uptrend, with the price firmly above the 200-day moving average and showing strong momentum. The ADX reading of 61.6 on the daily chart indicates a very strong trend, reinforcing the bullish conviction. RSI at 84.71 is deep in overbought territory, suggesting that while the trend is strong, the market is overheated and may be due for a pause or correction. This is a classic scenario where trend followers might look for pullbacks to enter, while short-term traders might anticipate a temporary reversal.
However, the 1-hour and 4-hour charts offer a more nuanced perspective. On the 1-hour timeframe, the ADX at 29.21 still signals a strong trend, and the RSI at 68.98, while elevated, is not yet at extreme levels seen on the daily chart. The Stochastic K and D lines are showing a bullish crossover (K=79.36, D=78.81), suggesting upward momentum might continue in the very short term. Key resistance is identified at $110.73, with a more significant hurdle at $111.65 and the psychological $113.18. Support is seen at $108.28, followed by $106.75. The MACD is positive and above its signal line, supporting the near-term bullish bias. This divergence between the daily's extreme overbought condition and the shorter-term bullish signals highlights the potential for short-term volatility and the importance of watching intraday price action for confirmation.
The Dollar's Shadow: DXY's Influence on Oil
The US Dollar Index (DXY) is currently trading at 99.98, showing a strong upward trend on the daily chart with an ADX of 34.52. This strengthening dollar typically exerts downward pressure on commodities priced in dollars, such as Brent crude. A stronger dollar makes oil more expensive for holders of other currencies, potentially dampening demand. However, the current market narrative is complex. While the DXY is rising, driven by factors like sticky inflation and potential Fed hawkishness, oil prices are also surging. This suggests that the geopolitical risk premium and inflation hedging demand for oil are currently outweighing the negative correlation with the dollar. The narrative is shifting: instead of a clear inverse relationship, we're seeing a battle between dollar strength and commodity-specific inflation fears. If the Fed signals a more aggressive stance on interest rates, it could strengthen the dollar further, creating a headwind for oil, but the immediate supply concerns might keep prices elevated regardless.
The 1-hour DXY chart shows RSI at 76.93, deep in overbought territory, suggesting a potential short-term pullback in the dollar. This could offer a brief reprieve for oil prices, allowing them to extend gains. However, the overall trend on the daily chart remains bullish for the dollar. The market is at a crossroads where the Fed's policy path, inflation data, and geopolitical events are creating conflicting signals across different asset classes. The interplay between the dollar's strength and oil's surge will be a key determinant of market direction in the coming days. Traders are closely monitoring whether the dollar's strength will eventually smother the commodity rally or if oil's inflationary pressures will continue to dominate, even with a strong dollar.
Fundamental Drivers: Inflation, Supply, and Central Banks
The surge in Brent crude to $109.87 is intrinsically linked to the broader macroeconomic environment, dominated by persistent inflation and the subsequent policy responses from central banks. The hot PPI data is a stark reminder that inflationary pressures are far from subdued. This forces central banks, particularly the US Federal Reserve, into a difficult position. On one hand, rising inflation calls for tighter monetary policy, including potential interest rate hikes or a slower pace of rate cuts. On the other hand, aggressive tightening could choke off economic growth and reduce demand for commodities like oil, potentially leading to a price crash. This policy dilemma creates significant market uncertainty.
The supply side also remains a critical factor. While Saudi Aramco has reportedly restarted its Ras Tanura refinery, the ongoing geopolitical tensions in the Middle East, including the strike on Iran's South Pars gas field, introduce a constant threat of supply disruption. OPEC+ decisions also loom large, with the cartel's production quotas playing a pivotal role in balancing global supply and demand. Any indication of further production cuts from OPEC+ would likely send oil prices soaring, while signs of increased output from non-OPEC+ producers, like US shale, could provide some relief. Currently, the market seems heavily weighted towards the supply disruption narrative, pushing prices higher despite a potentially strengthening dollar and the specter of tighter monetary policy.
The Specter of Recession vs. Inflationary Boom
We are currently witnessing a fascinating tug-of-war between two competing narratives: one of persistent inflation and supply constraints driving commodities higher, and another of aggressive central bank tightening leading to a potential economic slowdown or even recession. The hot PPI data and the geopolitical risk premium on oil clearly support the inflation narrative. This suggests that Brent crude prices could remain elevated, acting as a significant driver of headline inflation. Investors are keenly aware that if inflation remains stubbornly high, central banks might be forced to maintain a hawkish stance for longer than anticipated, potentially triggering a hard landing for the global economy.
Conversely, the sharp sell-off in equities, with the S&P 500 down 1.55% to 6614.65 and Nasdaq 100 down 1.67% to 24383.63, signals growing investor concern about economic growth. A global economic slowdown would typically lead to reduced demand for energy, putting downward pressure on oil prices. However, the current supply-side tightness and geopolitical risks seem to be insulating oil prices from the broader risk-off sentiment in the equity markets. This divergence is unusual and highlights the unique pressures impacting the energy complex. The market is essentially betting that supply constraints and geopolitical factors will keep oil prices high, even at the risk of exacerbating inflation and potentially triggering a recession. This is a high-stakes gamble that will likely keep volatility elevated.
Key Levels to Watch: $108.28 Support, $113.18 Resistance
From a technical perspective, the current price of $109.87 for Brent crude sits within a critical zone. On the 1-hour chart, the immediate support level to watch is $108.28. A break below this level could signal a short-term pullback, potentially targeting the next support at $106.75. This would align with the overbought conditions seen on shorter timeframes and could offer a buying opportunity for those anticipating a continuation of the broader uptrend after a healthy correction. The ADX on the 1-hour chart at 29.21 still indicates a strong trend, so any dip might be a buying opportunity rather than a reversal signal.
On the upside, resistance is initially seen at $110.73, followed by $111.65. The more significant resistance, however, lies at $113.18. A decisive move above this level, especially on increased volume and supported by positive geopolitical or inflation news, could signal a continuation of the strong bullish momentum observed on the daily chart. The daily RSI at 84.71 suggests that while the trend is strong, the market is extended, making a move above $113.18 potentially challenging without a significant fundamental catalyst or a clear signal of diminishing geopolitical risk. Traders will be watching for confluence between price action and technical indicators across different timeframes to gauge the strength and sustainability of any moves.
The Fed Factor: A Tightrope Walk
The Federal Reserve's upcoming policy decision looms large over all financial markets, and oil is no exception. The recent hot PPI data complicates the Fed's calculus significantly. If the central bank signals a more hawkish stance – perhaps by indicating a slower path for interest rate cuts or even the possibility of further hikes – it could strengthen the dollar and put a lid on commodity prices. A stronger dollar, as discussed, typically pressures oil. Furthermore, a more restrictive monetary policy could increase the odds of an economic slowdown, dampening future oil demand expectations.
Conversely, if the Fed maintains a relatively dovish tone, perhaps attributing the inflation surge to temporary factors or geopolitical shocks, it might provide some relief to risk assets and potentially allow oil prices to continue their upward trajectory, at least in the short term. The market will be dissecting every word from the Fed statement and subsequent press conference for clues. The current environment is one of high uncertainty, where the Fed's actions could either exacerbate inflationary pressures by being too slow to react or trigger a sharp economic downturn by being too aggressive. This balancing act is critical for oil price direction.
Scenario Analysis: Charting the Path Forward
Given the conflicting signals from technical indicators, fundamental data, and geopolitical events, a multi-scenario approach is essential for navigating Brent crude's path forward. The market is currently at a critical juncture, with several key levels dictating the potential direction.
Bearish Scenario: Inflation Fears Trigger Fed Tightening
60% ProbabilityNeutral Scenario: Consolidation Amid Fed Uncertainty
25% ProbabilityBullish Scenario: Geopolitical Risk Dominates
15% ProbabilityThe prevailing scenario leans bearish in the short term due to the extreme overbought conditions on the daily chart and the potential for a Fed policy shift. However, the geopolitical risk premium could easily override these technicals, pushing prices higher if tensions escalate further. The $108.28 support level is crucial for the bearish thesis, while a sustained move above $110.73 or even $113.18 would invalidate it and suggest continued bullish momentum.
The Road Ahead: Volatility Remains the Name of the Game
As we look towards the coming week, Brent crude at $109.87 presents a market grappling with powerful, yet somewhat contradictory, forces. Persistent inflation, as highlighted by the PPI data, coupled with ongoing geopolitical instability in the Middle East, creates a strong fundamental case for higher oil prices. This narrative is further supported by the strong bullish trend observed on the daily technical charts. However, the specter of aggressive central bank tightening, particularly from the Federal Reserve, poses a significant threat. A hawkish Fed could strengthen the dollar and increase recession risks, both of which are typically bearish for oil.
The technical picture offers mixed signals across different timeframes. While the daily chart is strongly bullish but overextended, shorter timeframes suggest potential for consolidation or a short-term pullback. Key levels to watch remain $108.28 for support and $113.18 for resistance. The interplay between these technical levels, the Fed's policy stance, and the evolving geopolitical situation will dictate the price direction. Traders should exercise caution, manage risk diligently, and be prepared for continued volatility. Patience and a clear strategy, focusing on price action around these key levels, will be paramount in navigating this complex market landscape.
Frequently Asked Questions: BRENT Analysis
What happens if Brent crude breaks below the $108.28 support level?
A break below $108.28 on the 1-hour chart would invalidate the immediate bullish outlook and could signal a short-term pullback. This scenario would likely target the next support at $106.75, potentially extending to $105.83 if broader market sentiment turns significantly risk-averse.
Should I consider buying Brent at current levels of $109.87 given the strong daily uptrend?
Buying at current levels carries risk due to the extreme overbought condition on the daily RSI (84.71) and potential Fed hawkishness. A more prudent approach might be to wait for a pullback to a key support level like $108.28, or confirm a bullish breakout above $113.18 with increased volume.
Is the RSI at 68.98 on the 1-hour chart a sell signal for Brent crude?
An RSI of 68.98 on the 1-hour chart is elevated but not yet definitively overbought territory, especially given the strong underlying trend. While it suggests momentum might be slowing, it's not a standalone sell signal. Confirmation would be needed, such as a bearish MACD crossover or a break below immediate support.
How will the upcoming Fed decision affect Brent crude prices this week?
A hawkish Fed decision, signaling higher-for-longer interest rates due to inflation, could strengthen the dollar and pressure oil prices downwards. Conversely, a more dovish or data-dependent tone might support oil, especially if geopolitical risks continue to drive supply concerns.
Track markets in real-time
AI-powered analysis, technical indicators and real-time price data.
Join Our Telegram Channel
Breaking market news, AI analysis and trading signals instantly.
Join Channel