The global financial landscape is currently a complex tapestry, woven with threads of escalating geopolitical tensions, volatile commodity prices, and shifting central bank expectations. In this intricate environment, Bitcoin, the digital flagship asset, finds itself navigating a critical juncture around the $69,047 mark. While the price action might seem contained, the underlying currents of global risk appetite, the strength of the US Dollar, and the surge in energy prices are creating a potent cocktail of forces that could soon dictate Bitcoin's next major move. This isn't just about crypto; it's about how digital assets react when the world's traditional safe havens and risk assets are pulled in opposing directions.
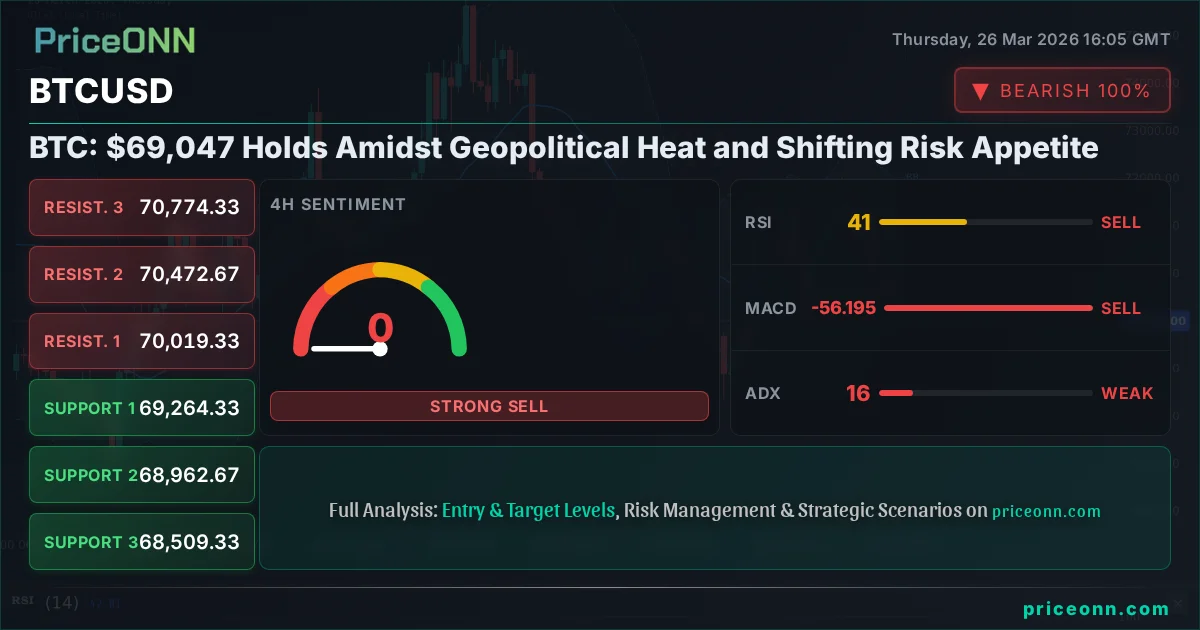
- Bitcoin is currently trading around $69,047, a critical psychological level.
- Geopolitical tensions are driving oil prices higher and strengthening the DXY, which typically pressures risk assets like BTC.
- Technical indicators on BTCUSD show a strong downtrend on the 1D chart (ADX: 42.61), but mixed signals across timeframes suggest a potential consolidation zone.
- A daily close above $70,111.67 resistance could signal a bullish continuation, while a break below $68,509.33 support risks further downside.
- The market is watching for confirmation of a sustained trend amid conflicting signals and broader macro uncertainty.
The Shifting Sands of Global Risk
The past 48 hours have been a stark reminder that geopolitical events rarely occur in isolation. Reports indicate escalating conflicts in the Middle East, with fears of supply chain disruptions pushing crude oil prices well past $99 per barrel for Brent. This surge in energy costs has a ripple effect across the global economy, often fueling inflation concerns and prompting central banks to re-evaluate their monetary policy stances. The US Dollar Index (DXY), a barometer of global risk sentiment and a traditional safe-haven asset, has seen a notable uptick, climbing to 99.63. This strengthening dollar typically exerts downward pressure on commodities like gold (XAUUSD, currently at $4,434.49) and can also weigh on riskier assets, including cryptocurrencies.
The correlation is clear: when the DXY strengthens significantly, it often signals a 'risk-off' environment. Investors tend to move capital from perceived riskier assets into the perceived safety of the dollar. For Bitcoin, which has increasingly shown correlation with tech stocks and other risk assets, this dynamic presents a significant headwind. The Nasdaq 100, for instance, is down 1.13% today, trading at 23884.64, mirroring the broader sentiment that any geopolitical shockwaves tend to dampen enthusiasm for speculative assets.
The interconnectedness is crucial to understand. The rise in oil prices, fueled by geopolitical uncertainty, directly impacts inflation expectations. If markets believe inflation will be stickier, central banks, particularly the Federal Reserve, might be forced to maintain a hawkish stance for longer, or even consider further rate hikes. This prospect of higher-for-longer interest rates is generally bearish for growth assets and cryptocurrencies, which often rely on cheaper capital for expansion and valuation. While the Fed Fund Futures are pricing in a complex outlook, any perceived shift towards tighter policy due to energy shocks would be a negative catalyst for BTC.
Bitcoin's Technical Tightrope Walk at $69K
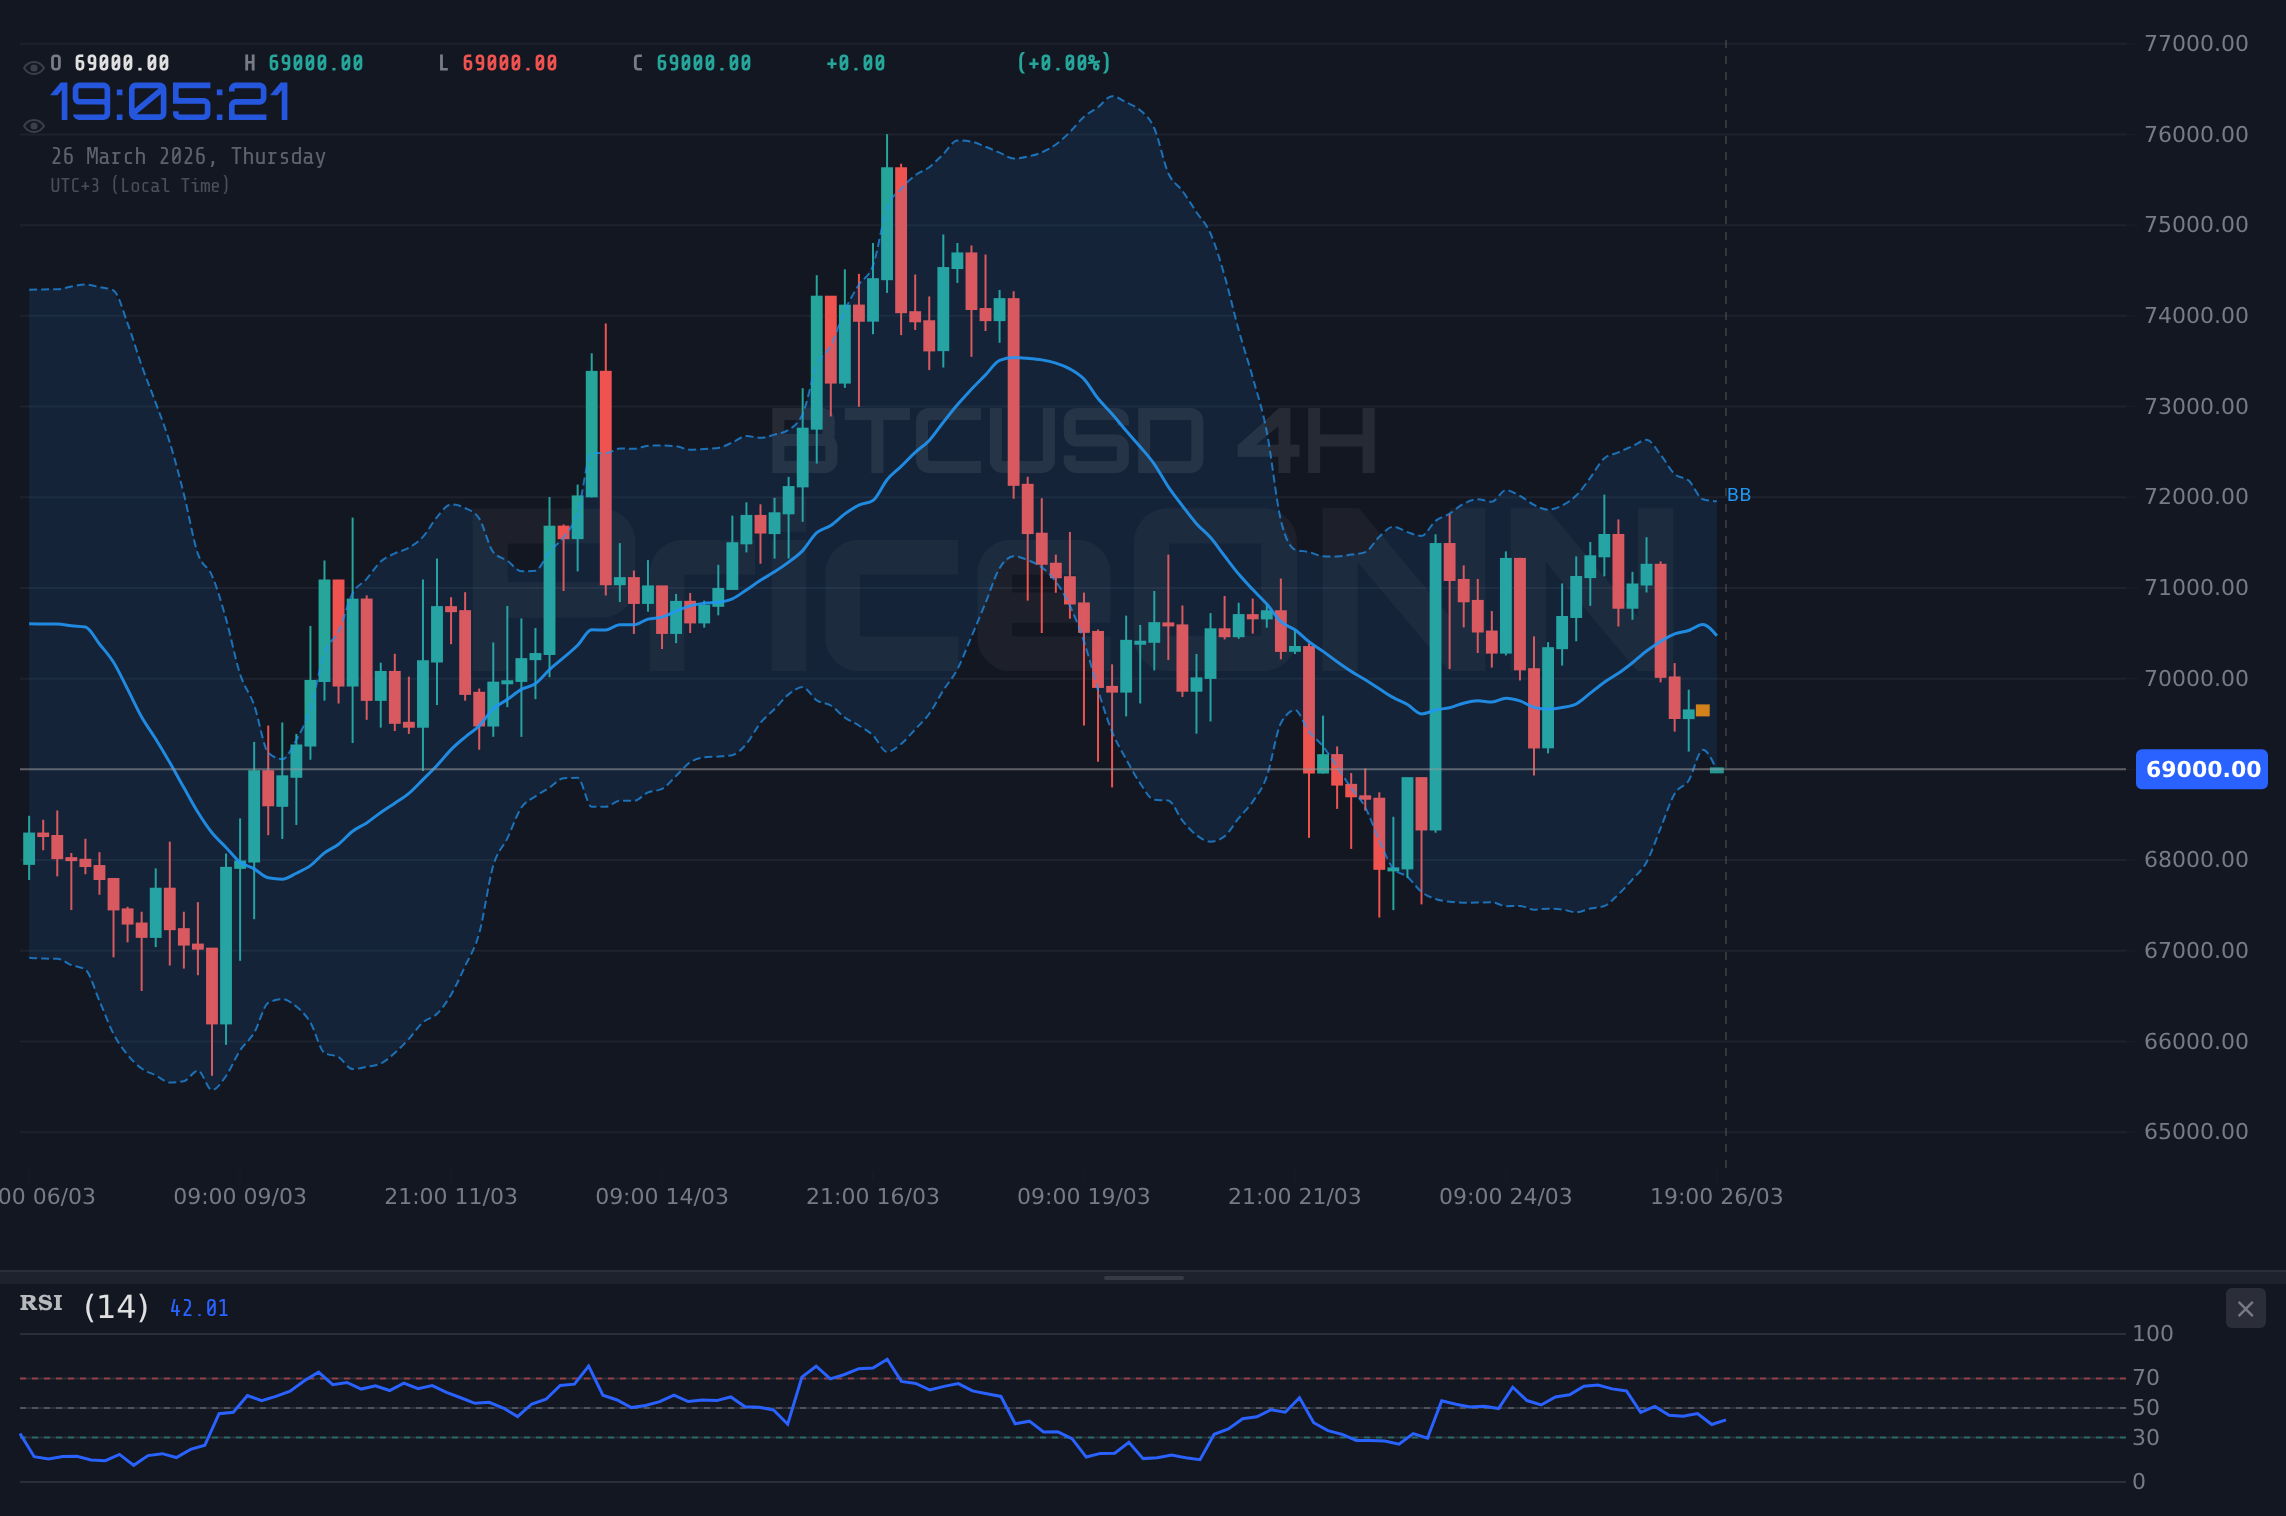
Against this macro backdrop, Bitcoin's price action at $69,047 presents a fascinating technical puzzle. The 1-hour chart suggests a neutral trend with a power of 50%, but the signals across different timeframes paint a more nuanced picture. The daily chart, in particular, shows a strong downtrend with an ADX reading of 42.61, indicating significant trend strength. However, the RSI(14) at 36.82 on the daily chart, while indicating a bearish eğilim, is still in the neutral zone, not yet oversold. This suggests that while the bears have been in control, there's room for a bounce or consolidation before a decisive move.
The MACD indicator on the daily timeframe is showing negative momentum, with the MACD line below its signal line. This reinforces the bearish short-to-medium term outlook. Similarly, Bollinger Bands are below the middle band, indicating downward pressure. Yet, the Stochastic Oscillator on the daily chart is showing a bullish signal (%K: 33.2, %D: 27), with the %K line crossing above the %D line. This divergence - a bearish MACD and RSI versus a bullish Stochastic - is precisely why the market is in a 'WATCH_ZONE'. It highlights indecision and the potential for a sharp move in either direction once confirmation arrives.
On the 4-hour chart, the trend is neutral, power 50%, with an ADX of 15.78. This low ADX value is particularly telling; it signifies a weak trend and a choppy market condition. Such environments are often characterized by false breakouts and difficulty in establishing sustained momentum. The RSI is at 41.3, again in neutral territory, while MACD shows negative momentum. The Stochastic, however, is firmly in oversold territory (%K: 11.77, %D: 54.09), suggesting a potential short-term bounce is brewing, though the overall trend strength remains weak.
The confluence of these indicators across multiple timeframes suggests that while the dominant daily trend is bearish, the immediate price action might be consolidating. The $69,047 level is acting as a crucial pivot. A failure to hold this level could lead to a test of the support at $68,509.33, and potentially lower towards $68,226.67. Conversely, a sustained push above the immediate resistance at $70,111.67, ideally with increasing volume and a daily close above it, would be the first sign of bulls regaining control and could open the door for a move towards $70,472.67 and beyond. Right now, it's a battleground.
Intermarket Dynamics: More Than Just Crypto
Understanding Bitcoin's potential trajectory requires looking beyond its own charts. The performance of related markets provides critical context. Gold, often seen as a competing safe-haven asset, is currently experiencing a sharp decline, trading at $4,434.49, down 1.59% on the day. This is somewhat counterintuitive if geopolitical tensions were solely driving 'risk-off' sentiment universally. However, the concurrent strength in the DXY (at 99.63) suggests that the dollar is the primary beneficiary of this uncertainty, potentially drawing capital away from gold as well. This dynamic can sometimes create a divergence where safe havens like the dollar strengthen, but others like gold weaken due to specific market flows or technical factors.
The energy sector, however, is telling a different story. WTI crude oil is up 3.68% at $94.89, and Brent crude is up 4.11% at $105.79. This significant jump is directly linked to the geopolitical heat in the Middle East. When oil prices surge, it has a direct impact on inflation expectations. This is precisely the kind of scenario that could force the Fed's hand, making them less likely to cut rates soon. This macro narrative reinforces the bearish pressure on risk assets like Bitcoin. The question becomes: will the fear of inflation and a stronger dollar ultimately overwhelm any 'digital gold' narrative for Bitcoin?
Forex pairs also offer clues. EURUSD is trading at 1.15403, showing a slight downtrend, reflecting the dollar's strength. GBPUSD is at 1.33488, also under pressure. AUDUSD and NZDUSD are further demonstrating weakness, trading at 0.6911 and 0.57765 respectively, both down significantly on the day. This broad-based dollar strength confirms the 'risk-off' sentiment permeating the currency markets. USDJPY, unusually, is showing a slight upward trend, trading at 159.661, which is a complex signal often associated with risk aversion but also influenced by yield differentials. The overall forex picture paints a clear narrative: the US Dollar is in demand.
The Path Forward: What Needs to Happen for BTCUSD?
Given the current 'WATCH_ZONE' status, the immediate future for BTCUSD hinges on confirmation. The technicals present a conflicting picture across timeframes. The daily chart suggests a strong downtrend is in place, with ADX at 42.61 indicating trend strength. However, the RSI is not yet oversold, and the Stochastic is showing a bullish signal, hinting at potential short-term relief. The 4-hour chart, with its weak ADX of 15.78, points to consolidation rather than a clear trend. This suggests that we are in a period of indecision.
For a bullish scenario to gain traction, Bitcoin needs to demonstrate conviction. A daily close above the key resistance level at $70,111.67 would be the first significant signal. This would need to be accompanied by a shift in momentum indicators, perhaps seeing the RSI move decisively above 50 and MACD showing signs of turning positive. Such a move would invalidate the current bearish outlook and potentially target the next resistance at $70,472.67, and subsequently $70,774.33. This scenario becomes more plausible if global risk sentiment improves, the DXY falters, and oil prices stabilize or begin to retreat.
Conversely, the bearish scenario remains very much alive. A break and sustained close below the critical support at $68,509.33 would confirm the continuation of the downtrend. This would likely be triggered by further escalation of geopolitical tensions, continued dollar strength, or rising inflation fears leading to hawkish central bank rhetoric. In this case, the targets would be the next support levels at $68,226.67 and potentially down to $67,900. The ADX reading on the daily chart supports the idea of a strong trend, so a breakdown could be sharp if it occurs.
The neutral scenario, which seems most likely in the very short term given the conflicting signals and weak ADX on the 4H chart, involves continued consolidation around the $69,047 level. This could be a period of accumulation or distribution, where price grinds sideways as traders await clearer macro or technical signals. Within this range, we might see volatility but no decisive trend. Key levels to watch would be the immediate support and resistance mentioned earlier. Without a catalyst - either a geopolitical de-escalation, a shift in Fed expectations, or a clear technical breakout - this choppy action could persist.
Bearish Scenario: Downside Momentum Builds
65% ProbabilityBullish Scenario: Resistance Breakout
25% ProbabilityNeutral Scenario: Consolidation Continues
10% ProbabilityFrequently Asked Questions: BTCUSD Analysis
What happens if BTCUSD breaks below $68,509.33 support amidst current geopolitical tensions?
A break below $68,509.33 on a daily close basis would confirm the bearish trend, potentially targeting $68,226.67 and $67,900. This scenario is heightened by the DXY's strength at 99.63 and rising oil prices, which typically pressure risk assets.
Should I buy BTCUSD at current levels around $69,047 given the conflicting technical signals?
Caution is advised. While the Stochastic shows a bullish signal on the daily chart, the dominant daily ADX of 42.61 indicates a strong downtrend. A confirmed breakout above $70,111.67 resistance is needed for a higher-probability bullish setup, rather than buying into current uncertainty.
Is the RSI at 36.82 a sell signal for BTCUSD right now?
An RSI of 36.82 on the daily chart indicates a bearish eğilim but is not yet in oversold territory. It suggests selling pressure is present, aligning with the overall downtrend, but doesn't necessarily signal an immediate, strong sell. Confirmation from other indicators or price action is crucial.
How will continued DXY strength at 99.63 affect BTCUSD this week?
Sustained strength in the DXY typically correlates with a 'risk-off' sentiment, putting downward pressure on assets like Bitcoin. If the dollar continues to rally due to geopolitical fears or inflation concerns, BTCUSD may struggle to find upward momentum and could face further downside.
Technical Outlook Summary
| Indicator | Value | Signal | Interpretation |
|---|---|---|---|
| RSI (14) | 36.82 | Bearish | Bearish eğilim, not oversold |
| MACD Histogram | -0.98 | Bearish | Negative momentum |
| Stochastic | 33.2 / 27.00 | Bullish | Bullish crossover, not extreme |
| ADX | 42.61 | Bullish | Strong trend (daily) |
| Bollinger Bands | Middle Band | Bearish | Below middle band, downward pressure |
Track markets in real-time
AI-powered analysis, technical indicators and real-time price data.
Join Our Telegram Channel
Breaking market news, AI analysis and trading signals instantly.
Join Channel