BTCUSD Eyes $73,009 as Bulls Attempt to Regain Momentum
BTCUSD is currently trading around $73,009, showing signs of recovery after a recent dip. Will the bulls manage to sustain this upward momentum?
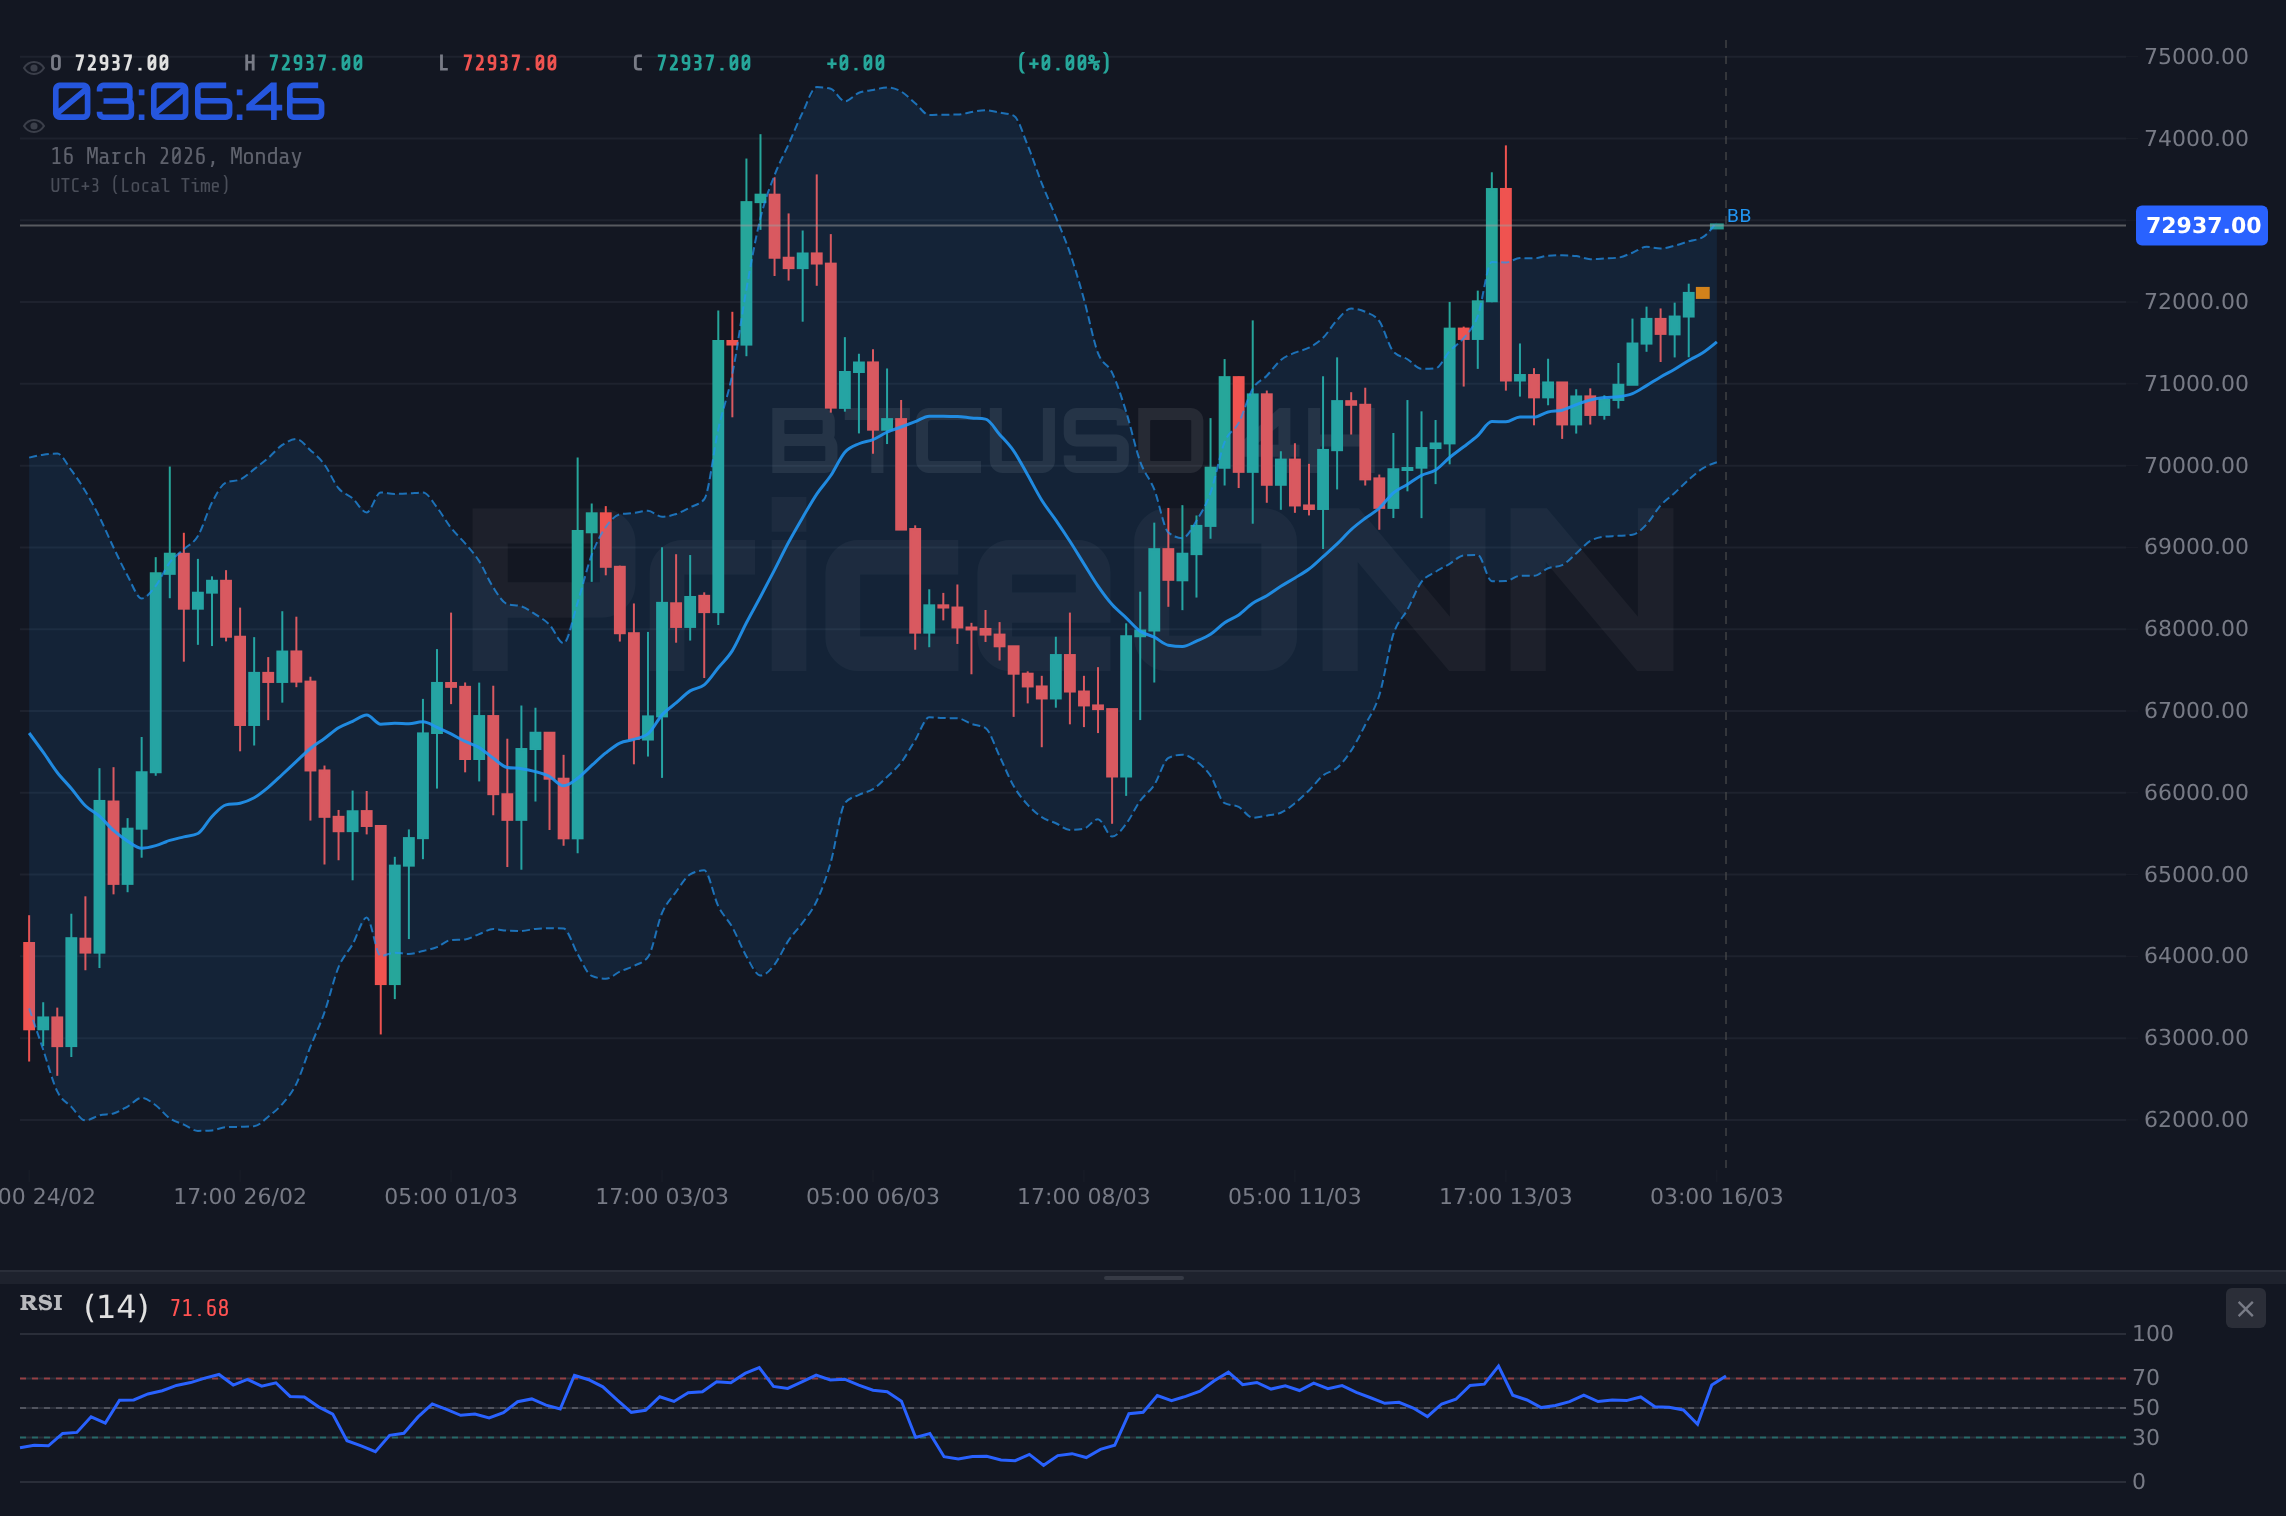
Bitcoin's price action is currently centered around $73,009, a level that's proving to be a critical battleground between bulls and bears. After a period of consolidation, the cryptocurrency is attempting to break higher, but several technical factors suggest caution.
- RSI at 74.37 signals overbought conditions on the 1-hour chart, suggesting potential for a short-term pullback.
- Key support level at $71,965 must hold to maintain the bullish momentum.
- MACD histogram remains positive on the 4-hour chart, indicating underlying strength.
- DXY strength is putting pressure on BTCUSD, requiring careful monitoring of the dollar index.
BTCUSD's recent performance has been impressive, but a closer look reveals some conflicting signals. On the one hand, the daily chart shows a clear uptrend, with the price consistently making higher highs and higher lows. The current price of $73,009 is a testament to this bullish momentum. The 1-hour chart shows the price is trading near the upper Bollinger Band, suggesting a possibility of a short-term correction. The middle band, around $71,965, could act as immediate support.
However, the technical indicators paint a more nuanced picture. The Relative Strength Index (RSI) on the 1-hour chart is currently at 74.37, which is approaching overbought territory. This suggests that the upward momentum may be losing steam, and a pullback could be imminent. The ADX on the 1-hour chart, however, shows a strong upward trend with a value of 32.14, indicating that the trend is still strong.
Click to expand
The 4-hour chart provides a slightly different perspective. The RSI is at 65.6, which is in neutral territory, suggesting that there is still room for further upside. The MACD histogram is positive, indicating that the bullish momentum is still intact. The key level to watch on the 4-hour chart is the resistance at $73,295. A break above this level could signal a continuation of the uptrend, with potential targets at $73,842 and $74,625.
The daily chart shows a neutral trend. With RSI at 57, there is more room to run, but the stochastic is showing %K at 72.56 and %D at 57.74, indicating that the market may be overbought.
Analyzing the DXY Impact on BTCUSD
The Dollar Index (DXY) is a critical factor influencing BTCUSD's price action. Currently, the DXY is trading at 99.98, up 0.58% on the day, according to the latest data. This strength in the dollar is putting downward pressure on BTCUSD. The inverse relationship between the dollar and Bitcoin is well-documented, and traders need to closely monitor the DXY's movements to anticipate potential shifts in BTCUSD's direction.
If the DXY continues to strengthen, BTCUSD could face significant headwinds. The rise in DXY is also reflected in the USDJPY, currently trading at 159.447. The strength of the dollar puts downward pressure on other major currencies.
The strength in the DXY is also influencing the price of gold. XAUUSD is currently trading at $5017.12, down 1.21% on the day. As the dollar strengthens, gold becomes more expensive for holders of other currencies, leading to a decrease in demand and price.
Macroeconomic Factors and Bitcoin's Outlook
Beyond technical analysis, several macroeconomic factors are influencing Bitcoin's outlook. The strength of the US economy, as reflected in recent economic data releases, is supporting the dollar and putting pressure on risk assets like Bitcoin. The market is closely watching upcoming economic data releases, such as GDP figures and inflation reports, to gauge the Federal Reserve's next move.
According to recent news reports, there are concerns about the impact of rising oil prices on gold miners. Oil is currently trading at $98.41, up 2.29% on the day. Historically, high oil prices have impacted gold miners. The rise in oil prices may also contribute to inflation, which could influence the Federal Reserve's decision on interest rates.
The upcoming economic data releases will be critical in determining the direction of BTCUSD. Strong economic data could lead to further dollar strength and downward pressure on Bitcoin, while weaker data could have the opposite effect. Traders need to carefully monitor these releases and adjust their positions accordingly.
BTCUSD: Key Support and Resistance Levels
Understanding key support and resistance levels is crucial for trading BTCUSD. Based on the current market data, the immediate support level is at $71,965, which is the middle band on the 1-hour chart. A break below this level could lead to further downside, with potential targets at $71,182 and $70,635.
On the upside, the immediate resistance level is at $73,295, which is the high from the 1-hour chart. A break above this level could signal a continuation of the uptrend, with potential targets at $73,842 and $74,625. These levels should be closely monitored for potential trading opportunities.
The current market environment is characterized by high volatility and uncertainty. Traders need to be cautious and manage their risk accordingly. It's important to have a clear trading plan and stick to it, regardless of short-term market fluctuations.
Risk Management and Trading Strategies for BTCUSD
Given the conflicting signals and the overall market uncertainty, risk management is paramount. Traders should consider using stop-loss orders to limit their potential losses. A stop-loss order placed below the $71,965 support level could help protect against a downside break.
It's also important to be aware of the potential for whipsaws and fakeouts. The market is likely to remain volatile in the near term, and traders should be prepared for sudden price swings. Patience and discipline are key to navigating these challenging market conditions.
A potential trading strategy for BTCUSD is to wait for a clear break above the $73,295 resistance level before entering a long position. A stop-loss order could be placed below the $71,965 support level to manage risk. Alternatively, traders could wait for a pullback to the $71,965 support level before entering a long position. This would allow them to get a better entry price and reduce their risk.
Frequently Asked Questions: BTCUSD Analysis
What happens if BTCUSD breaks above $73,295 resistance?
If BTCUSD decisively breaks above the $73,295 resistance level, it could signal a continuation of the uptrend. The next potential targets would be $73,842 and $74,625, based on the 1-hour chart data.
Should I buy BTCUSD at current levels of $73,009 given the RSI at 74.37?
Given the RSI at 74.37 on the 1-hour chart, which indicates overbought conditions, it might be prudent to wait for a pullback before entering a long position. A better entry point could be near the $71,965 support level.
Is the positive MACD histogram a reliable signal for BTCUSD trend analysis?
The positive MACD histogram on the 4-hour chart does suggest underlying bullish momentum. However, it's essential to consider other factors and not rely solely on one indicator. Look for confirmation from price action and other indicators before making a decision.
How will the upcoming economic data affect BTCUSD this week?
Upcoming economic data releases, such as GDP figures and inflation reports, could significantly impact BTCUSD. Strong economic data could lead to further dollar strength and downward pressure on Bitcoin, while weaker data could have the opposite effect.
Volatility creates opportunity- those prepared will be rewarded.
Track markets in real-time
Empower your investment decisions with AI-powered analysis, technical indicators and real-time price data.
Join Our Telegram Channel
Get breaking market news, AI analysis and trading signals delivered instantly to your Telegram.
Join Channel